

Issue #204:
BTC Breaks Through As Macro Holds Its Breath
BTC Runs Despite the “Low-Hire, Low-Fire” Labour Data
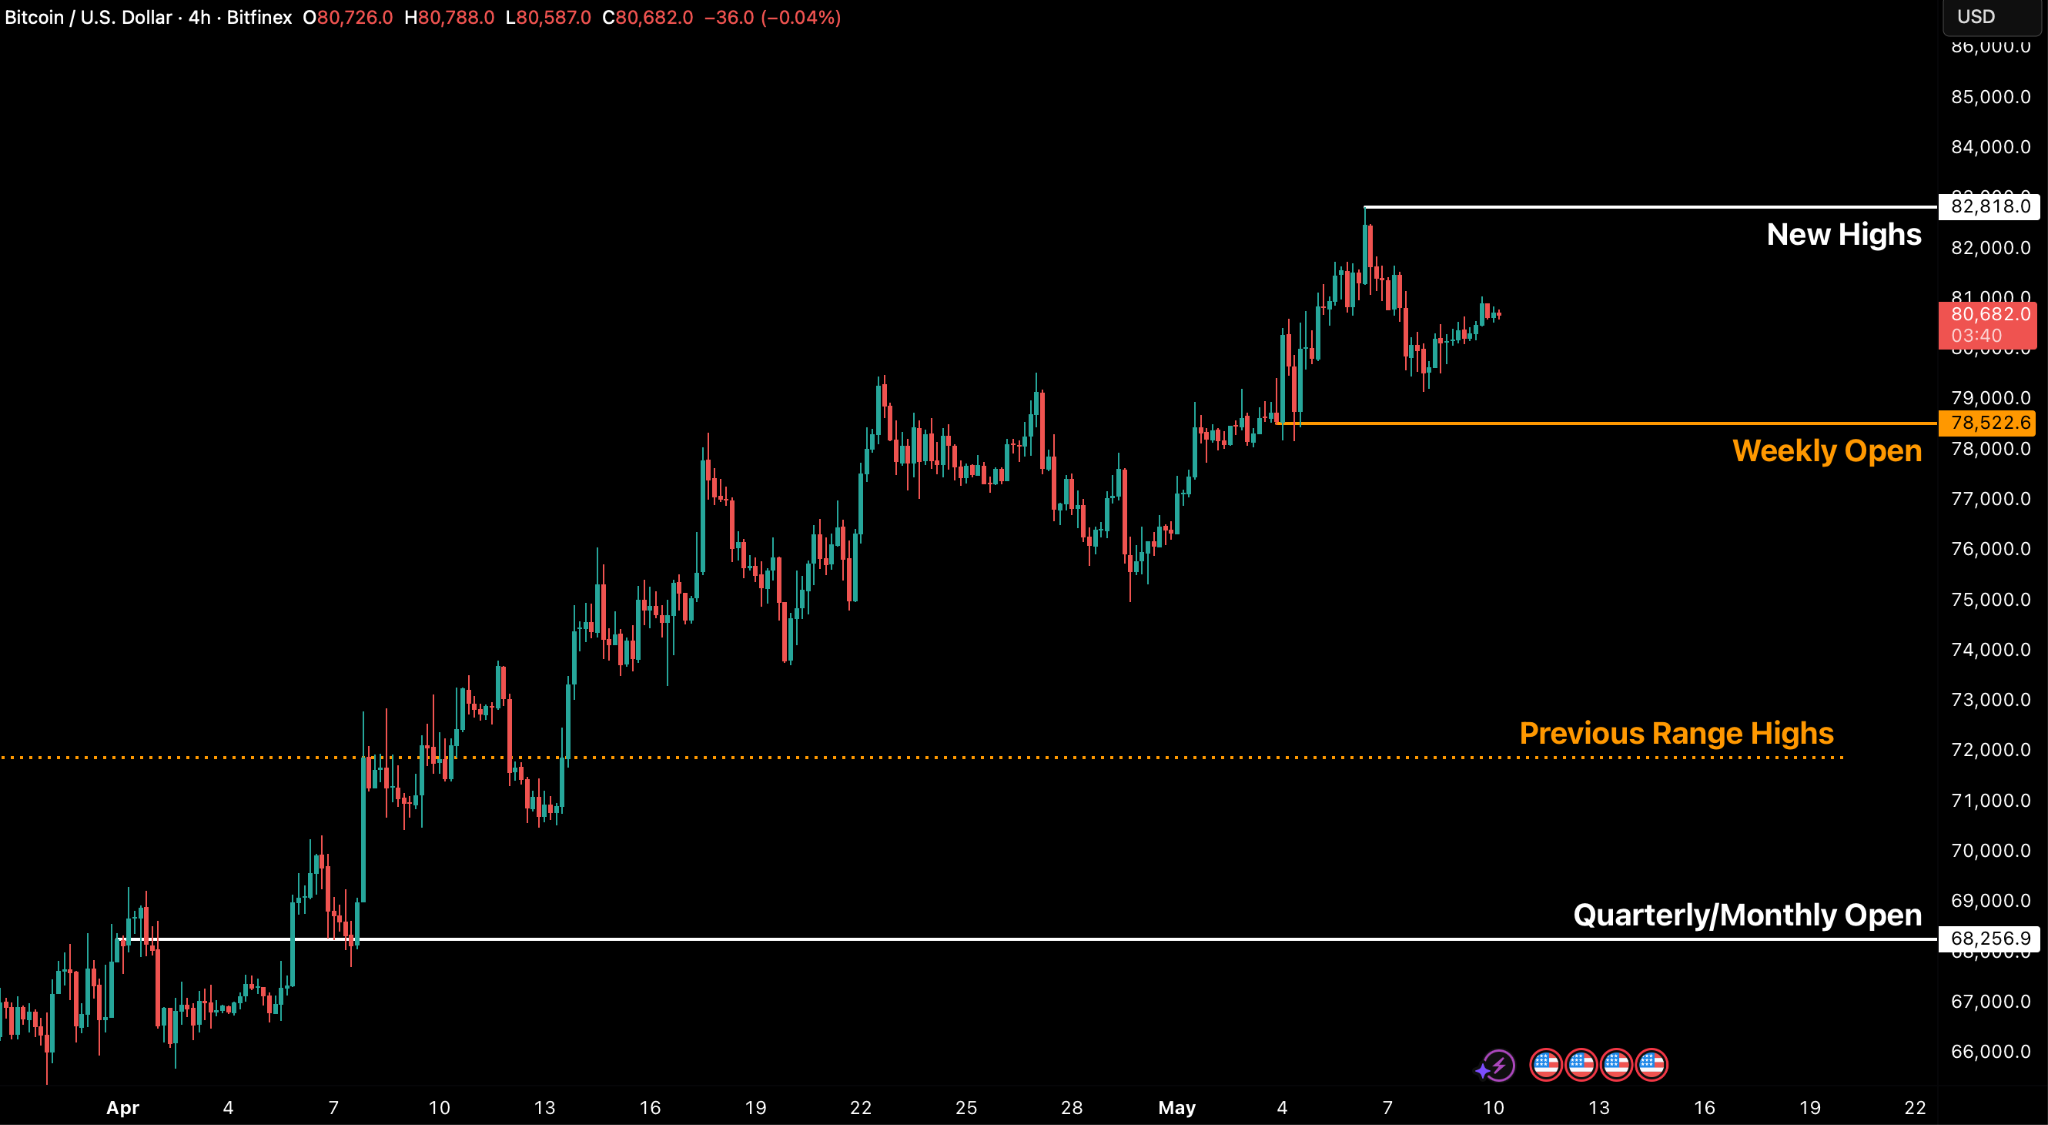
Bitcoin closed April with its strongest monthly performance in a year, rising nearly 12 percent and helping lift total crypto market capitalisation by $198 billion. The key development came in early May, when BTC broke decisively above $80,000 for the first time since 31 January, clearing the dense $78,000–$79,000 overhead supply zone and pushing toward $83,000. This move marks a meaningful structural improvement, especially as price has now reclaimed the True Market Mean near $79,800, shifting Bitcoin back above a critical aggregate cost-basis level.
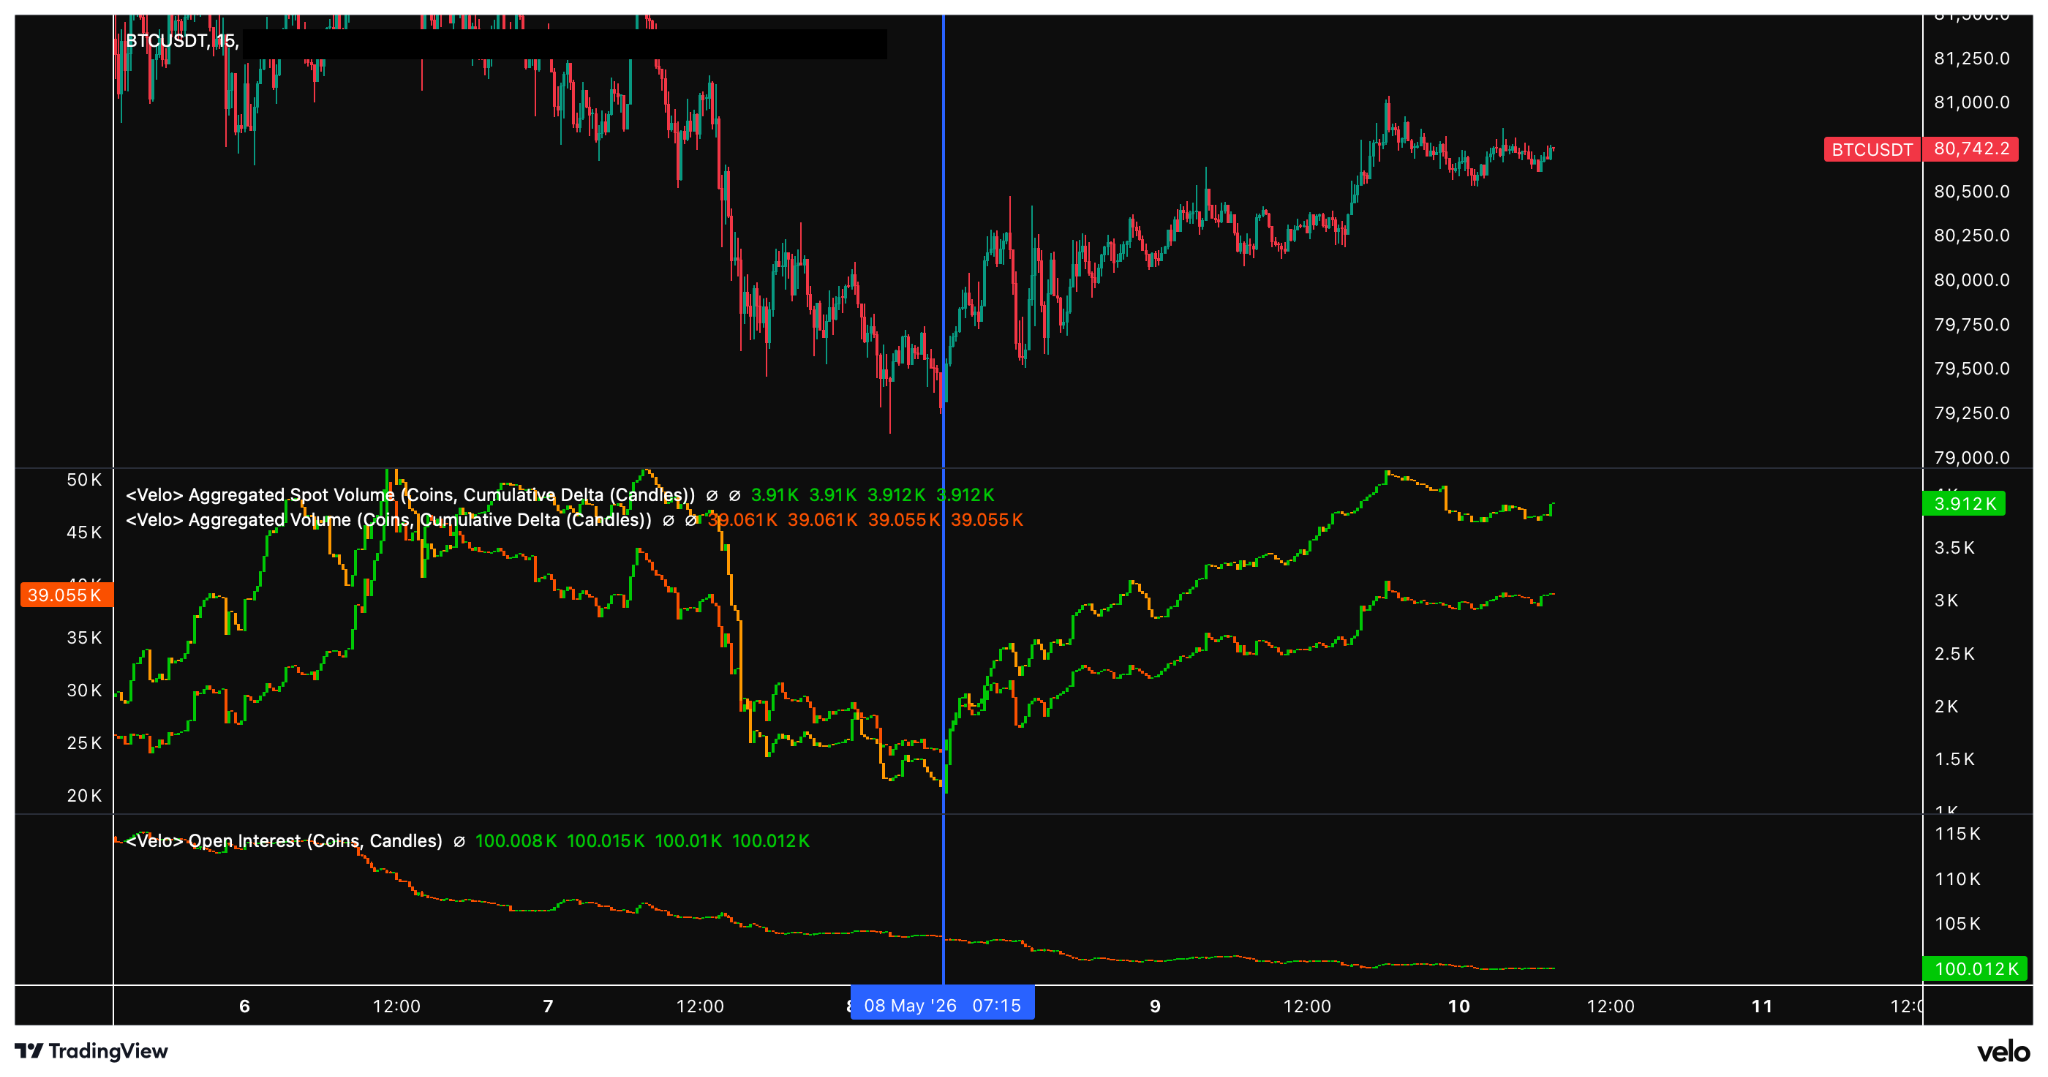
This BTC movement has been driven primarily by aggressive spot demand rather than leverage. Spot CVD rose sharply after 8 May, showing buyers lifting offers and absorbing supply at premium levels, while order books moved from bid-skewed to more neutral. ETF demand and open-market accumulation appear to be the main drivers, as the effect of STRC-linked Bitcoin purchases fades, while STRC has not yet traded consistently at or above par. More importantly, conviction buyers now hold nearly four million BTC, the largest surge in this cohort since the COVID-19 crash, indicating that long-horizon holders are absorbing supply and reducing available float.
The April Employment Situation report showed nonfarm payrolls rising 115,000 against a 55,000 consensus, the unemployment rate holding at 4.3 percent, and average hourly earnings up 3.6 percent year-on-year, with initial jobless claims at 200,000 and a four-week average of 203,250, the cycle low.
The configuration is a “low-hire, low-fire” regime: hiring has slowed materially, but firings have not. The 4.3 percent reading also reflects a tighter labour supply, with the Kansas City Fed placing 2026 breakeven employment growth at just 15,000–87,000 jobs per month.
The labour data sits inside a sharper divergence between hard and soft signals. Atlanta Fed GDPNow tracked Q2 real growth at 3.7 percent and ISM Services marked a twenty-second consecutive month of expansion, even as the University of Michigan Index of Consumer Sentiment fell to 48.2, the lowest reading since the survey began in 1952. The Fed’s G.19 reconciles the two: revolving credit expanded at a 9.1 percent annualised pace at an average APR of 21.00 percent, funding the marginal dollar of consumption as the personal savings rate holds below 4.5 percent. With March CPI at 3.3 percent and long-term inflation expectations at 3.4 percent, CME FedWatch is pricing a roughly 94 percent probability of a hold at the June FOMC, with the target range at 3.50–3.75 percent.
Against that backdrop, institutional crypto infrastructure broadened further as CME Group launched regulated AVAX and SUI futures with FalconX and G-20 Group executing the first block trades, signalling that institutional investors are treating selected Layer-1 tokens as investable assets, with CME also moving its crypto derivatives to 24/7 operation from 29 May. Regulatory pressure tightened in parallel: South Korea’s National Assembly approved amendments to the Foreign Exchange Transactions Act requiring crypto exchanges and custody providers handling cross-border flows to register formally with the Ministry of Economy and Finance ahead of a planned 22 percent crypto capital-gains tax in 2027, while in the United States Senator Elizabeth Warren wrote to Meta CEO Mark Zuckerberg demanding disclosure on the company’s reported plans to integrate a third-party stablecoin across its 3.5-billion-user network in the second half of 2026, citing privacy, systemic-risk, and illicit-finance concerns and seeking a response by 20 May.

Market Signals
Bitcoin Continues To Hold Strong
Bitcoin concluded its strongest monthly performance in a year with a significant rally, registering a nearly 12 percent gain in April and closing above the $76,000 mark. This upward trajectory was mirrored across the wider market, as the total crypto market capitalisation experienced a substantial injection of $198 billion, an 8.53 percent increase for the month.
Following a decisive breach of the $80,000 threshold on Monday, 4 May, Bitcoin achieved its first sustained acceptance above this key level since 31 January. Crucially, this move cleared the dense overhead supply wall situated between $78,000 and $79,000. The momentum intensified by Wednesday, 6 May, with the price surging to a multi-month approach of $83,000, a rise predominantly fuelled by aggressive spot buying.
Despite a brief post-peak pullback from these new local highs, relentless buying pressure ensured the defence of the weekly open, reasserting control following the US market close on 8 May.

While price has continued to climb higher in a structured manner, in line with our expectations from the past few weeks, the majority of the buying has come from ETFs and open-market participants rather than structured yield-bearing products such as STRC, which has not traded at or above its $100 par value, the threshold required for MSTR to purchase bitcoin supply. The cumulative volume spot delta (CVD) has moved materially higher especially post May 8, reflecting strong demand-side flows on the taker side, as price has approached a premium relative to the average cost basis across multiple cohorts following BTC’s move past the True Market Mean, currently at $79,800.

Conviction buyers, entities that accumulate BTC and rarely transact regardless of price, are currently holding nearly 4 million BTC, the largest surge in this cohort since the COVID-19 crash in 2020. Prior peaks in this metric have historically preceded major price recoveries, as reduced sell-side pressure from long-term holders tightens available supply.
The $80,000 break on 4 May was defined by a significant short-side liquidation event, totalling $370 million in 24-hour liquidations. A substantial $301.93 million of this figure was attributable to short positions, stopping out 97,235 traders. This represented the most concentrated short-side liquidation since the local high recorded in January.
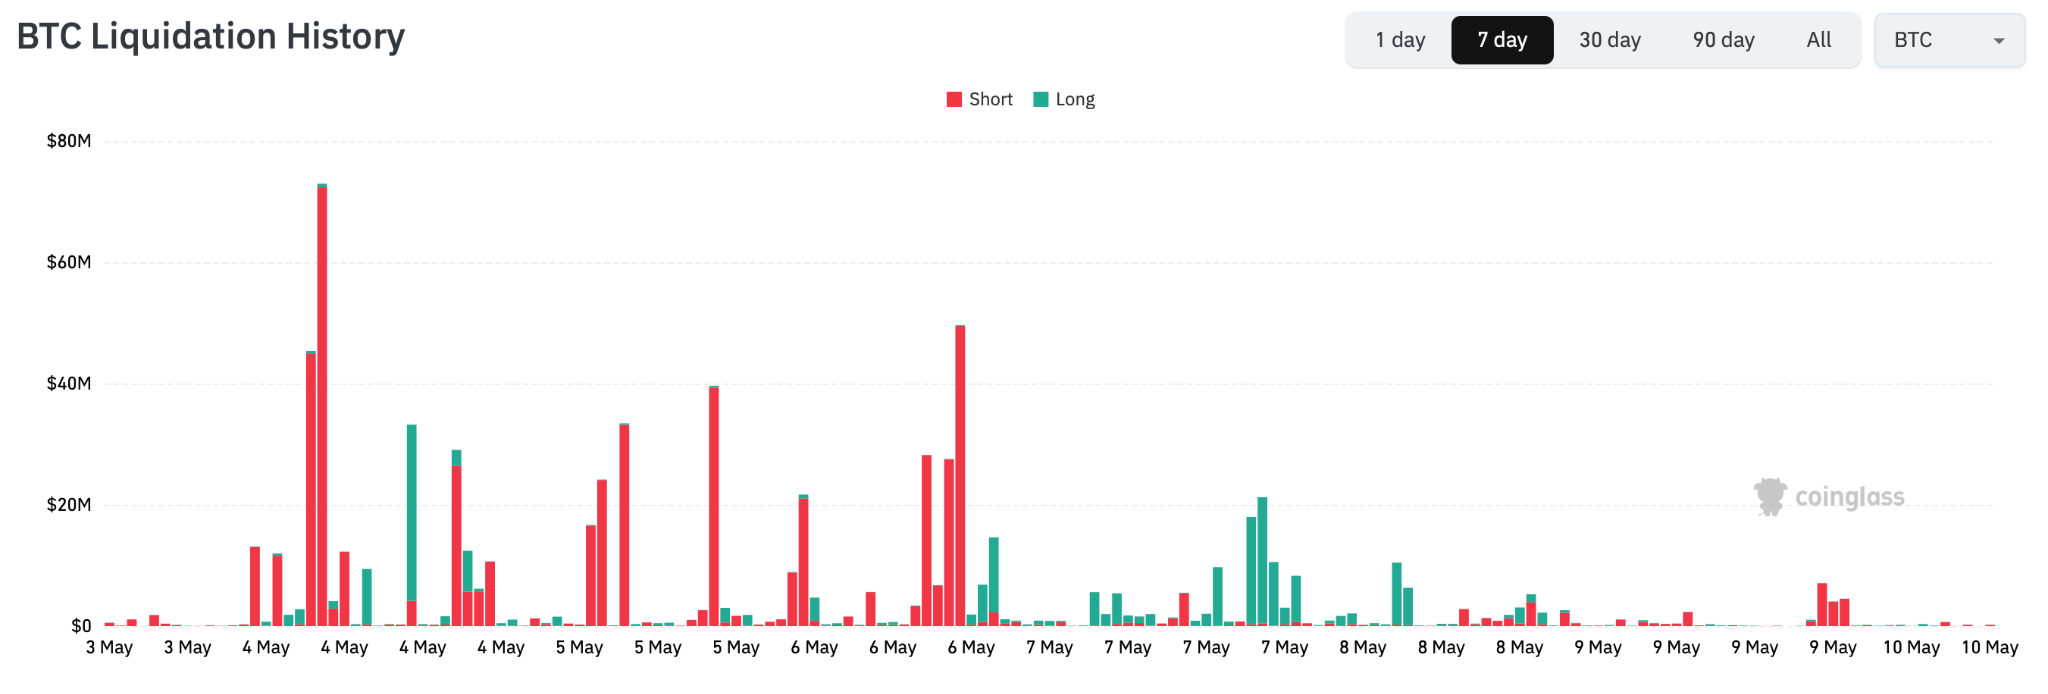
Throughout the week, aggregate Bitcoin futures open interest fluctuated between $58.5 billion and $60.84 billion, according to CoinGlass data. Crucially, the 30-day average funding rate had persisted in negative territory for 46 consecutive days through late April, a regime generally interpreted as structural institutional basis-trade hedging rather than directional sentiment. Following the breach of $80,000, it flipped to a neutral stance and has since maintained that position. Consequently, the funding rate is no longer the primary derivatives signal, necessitating a shift in analytical focus toward the options market this week.

General Macro Update
US Labour Market Holds Steady Despite Slowing Hiring Momentum
The April employment data released by theUS Bureau of Labor Statistics (BLS)shows a labour market that remains stable on the surface but is signalling clear deceleration underneath.Nonfarm payrolls added 115,000 jobs, the unemployment rateheld at 4.3 percent, andinitial jobless claims printed at 200,000 for the week ending 2 May, with the four-week moving average falling 4,500 to 203,250, the cycle low for this expansion. The headline reading conceals a softer hiring trend, a smaller marginal pool of available workers, and a Federal Reserve (Fed) reaction function that is, for now, anchored to realised inflation rather than to consumer expectations. Together, these elements describe a “low-hire, low-fire” regime that is statistically resilient but structurally narrow, and they set up the broader hard-versus-soft data divergence treated in the companion macro piece in this issue.
The April Print, Headline Beat With Soft Underlying Trend

The April Employment Situation report published by the BLS on 8 May showed nonfarm payrolls rising by 115,000, comfortably above the 55,000 consensus and broadly in line with the trailing twelve-month average. Job gains were concentrated in services: health care contributed 37,000 positions, transportation and warehousing 30,000, and retail trade 22,000, while federal government payrolls fell by 9,000 and information and manufacturing each contracted modestly. The unemployment rate held at 4.3 percent for the third consecutive month, and average hourly earnings rose 0.2 percent on the month and 3.6 percent year-on-year, slightly cooler than the 3.8 percent consensus.
The headline beat masks a softer underlying pace. February payrolls were revised down by 23,000 to negative 156,000, while March was revised up by 7,000 to 185,000. Stripping out the volatility, the trend pace of hiring runs closer to 50,000 jobs per month than to the 115,000 April headline, a meaningful deceleration from the 175,000–200,000 pace that prevailed through the first three quarters of 2025. The Department of Laborinitial claims report on 7 May confirms that the firing side has not yet lifted: the four-week moving average at 203,250 is the lowest of the cycle. Hiring has slowed materially; layoffs have not.
The “Low-Hire, Low-Fire” Regime
The configuration is what the labour-economics literature calls a “low-hire, low-fire” regime: subdued hiring offset by subdued firing, producing a stable unemployment rate without acceleration on either side. The income leg of the macro picture continues to function. Workers who have jobs keep them, nominal wage gains print near 3.6 percent, and the steady JOLTS job-openings count sits in a corridor consistent with a tight but not overheated market. The fragility of the regime lies in its dependence on a single pillar. If the firing side begins to lift, even modestly, the offsetting buffer that has masked weaker hiring disappears quickly, and the unemployment rate would move higher within one to two payroll prints rather than along a gradual glide path.

A second factor is structurally suppressing the unemployment rate: the labour force itself is no longer growing at the pace required to produce conventional measured slack. The civilian labour force participation rate sits at 61.8 percent in April, having drifted lower over the last twelve months, and the BLS Employment Projections programme continues to show participation declining toward 61.1 percent by 2034 on demographic trend alone.
The more decisive variable is what the Federal Reserve Bank of Kansas City describes as breakeven employment growth: the number of new jobs required each month to keep the unemployment rate steady. Kansas City Fed analysis published in late 2025 estimated the 2026 range at 15,000 to 87,000 jobs per month, down sharply from the 75,000–125,000 range that prevailed in 2023–2024. The drivers are an ageing population and a sharp slowing in net immigration. The working-age population is no longer expanding fast enough to require historical-trend payrolls growth simply to absorb labour-force entrants. A complementary Federal Reserve Board FEDS Note reaches the same conclusion using a different methodology.
The implication is that an April payrolls print of 115,000, and an underlying trend pace closer to 50,000, both sit well within the range that would, on this calculation, leave unemployment broadly unchanged. The 4.3 percent unemployment reading is therefore as much a statement about labour supply as about labour demand. This distinction matters for forward analysis: a true demand-led labour weakening would show up first in initial claims breaking out of the 195,000–215,000 range, not in payrolls disappointing relative to consensus.
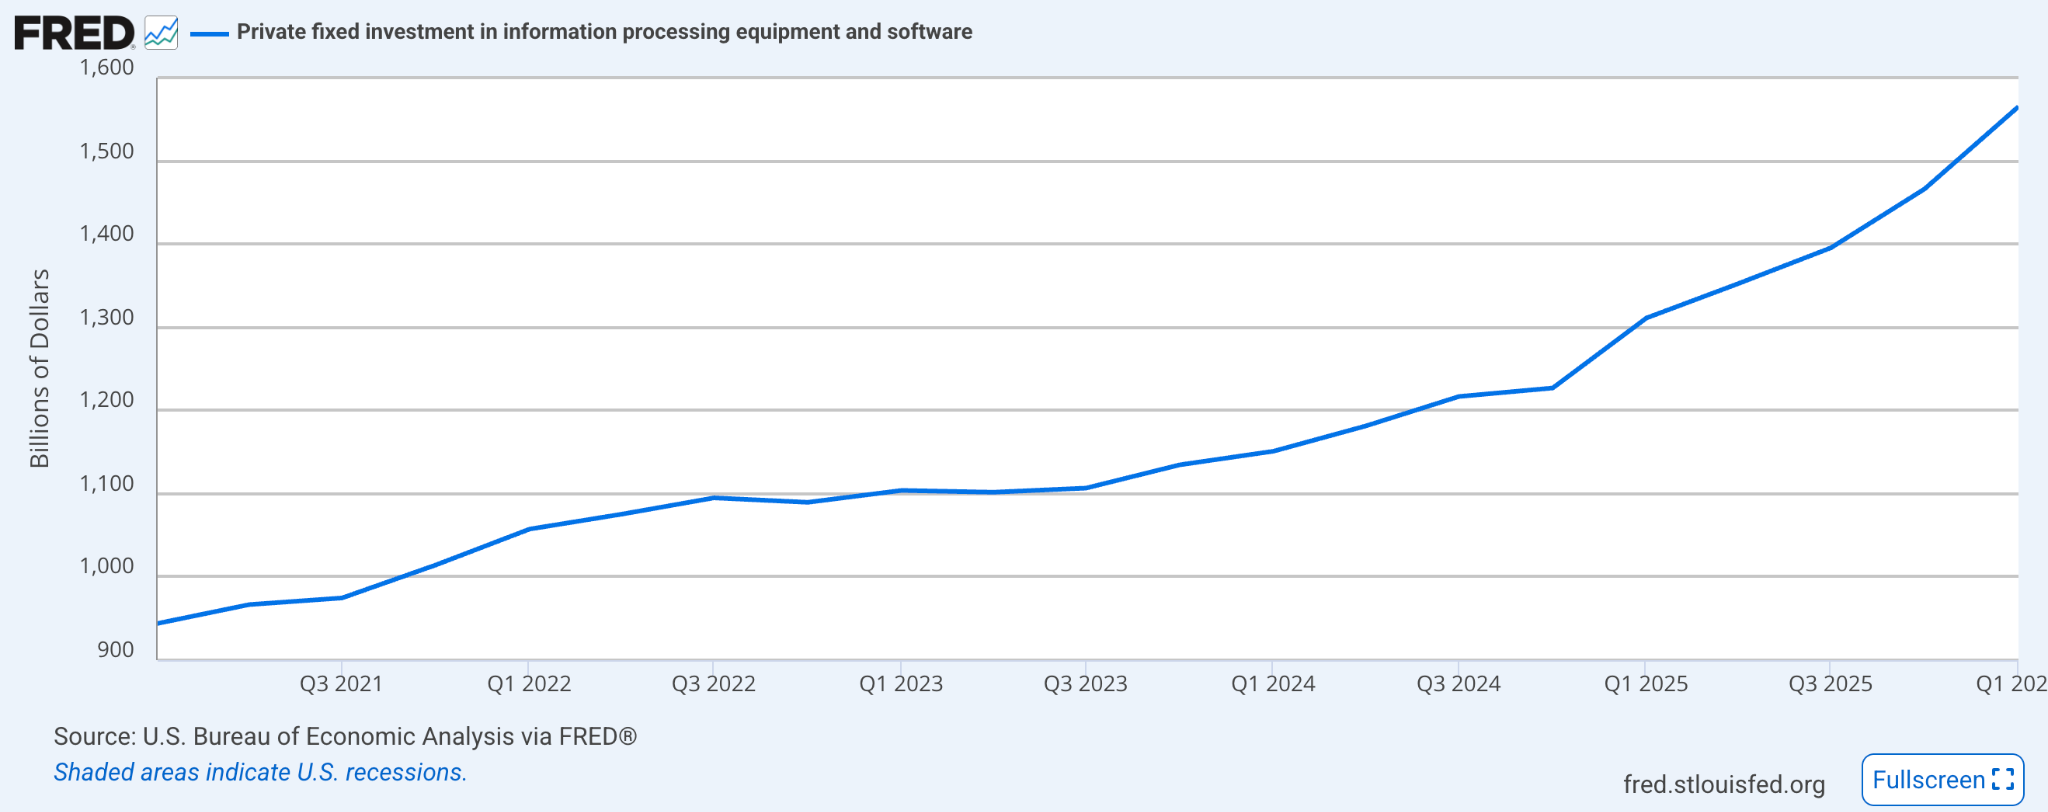
A third structural factor in the labour data is the artificial intelligence (AI) capital-expenditure cycle. Real private fixed investment in information processing equipment and software has been the single largest contributor to fixed-investment momentum since the second half of 2024, and the latest Atlanta Fed GDPNow decomposition shows the investment leg lifting Q2 2026 real growth meaningfully. The April employment data does not yet show large-scale labour displacement attributable to AI. Information-sector payrolls fell by 13,000 on the month, but the level remains close to its early-2025 average and is not consistent with a step-change in technological substitution.
The picture from the demand-side surveys is consistent with augmentation, not displacement. The Federal Reserve’s Beige Book commentary across the past three reporting periods describes firms deploying AI tooling to raise output per worker in software development, customer service, and back-office functions, with productivity gains concentrated in those areas and net headcount effects reported as small or positive. Where firms are expanding AI capability, they are typically also expanding the operations the tooling supports rather than reducing existing roles.
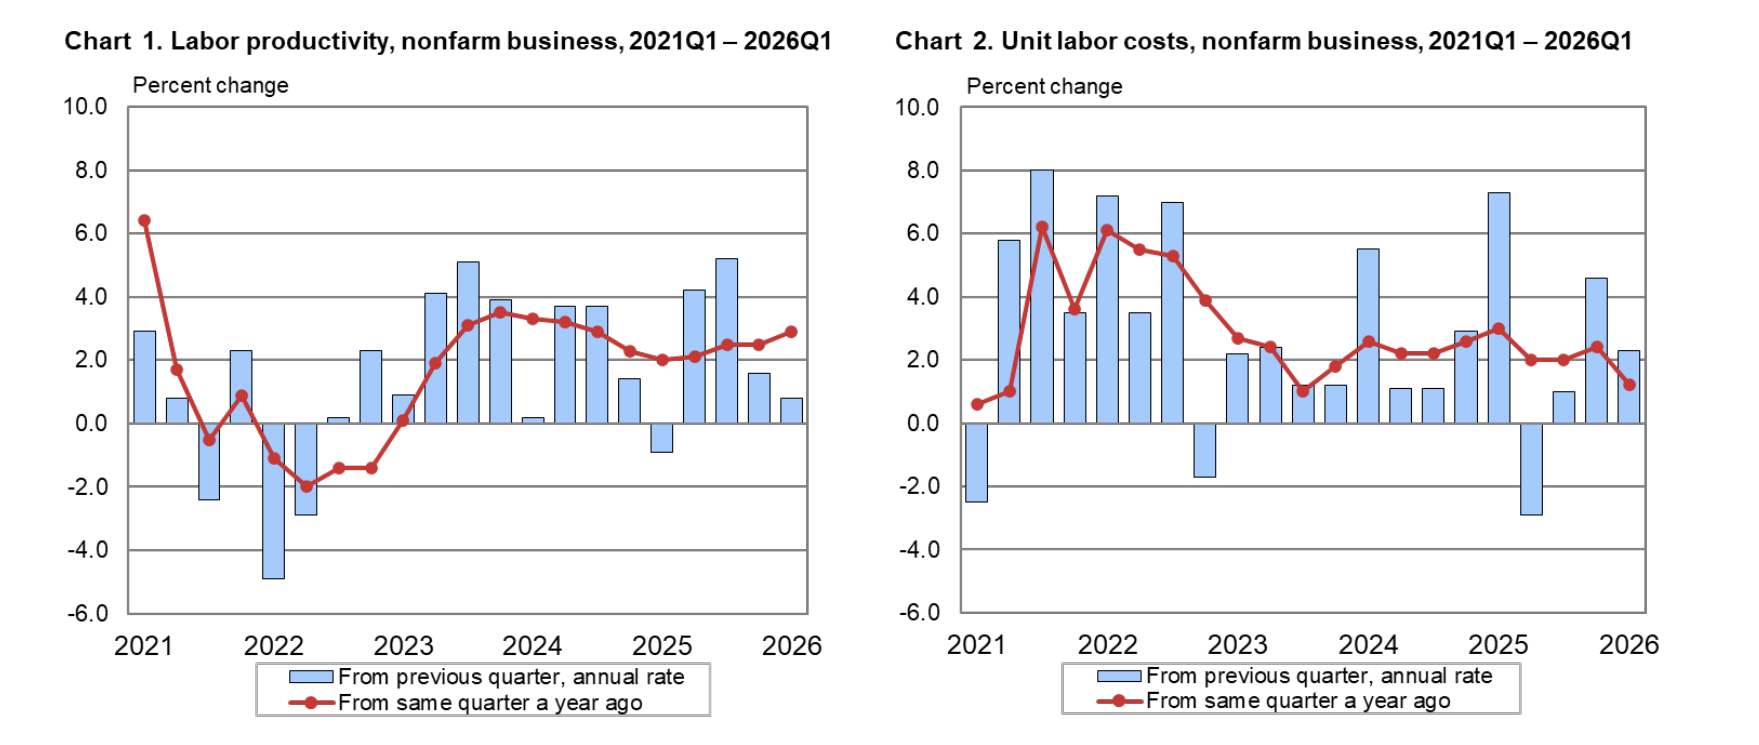
The signal to watch is the BLS Productivity and Costs release. Sustained gains in nonfarm business productivity above the 1.5 percent post-2007 average would corroborate the augmentation read; a stall in productivity growth alongside accelerating information-sector job losses would be the earliest evidence of displacement.
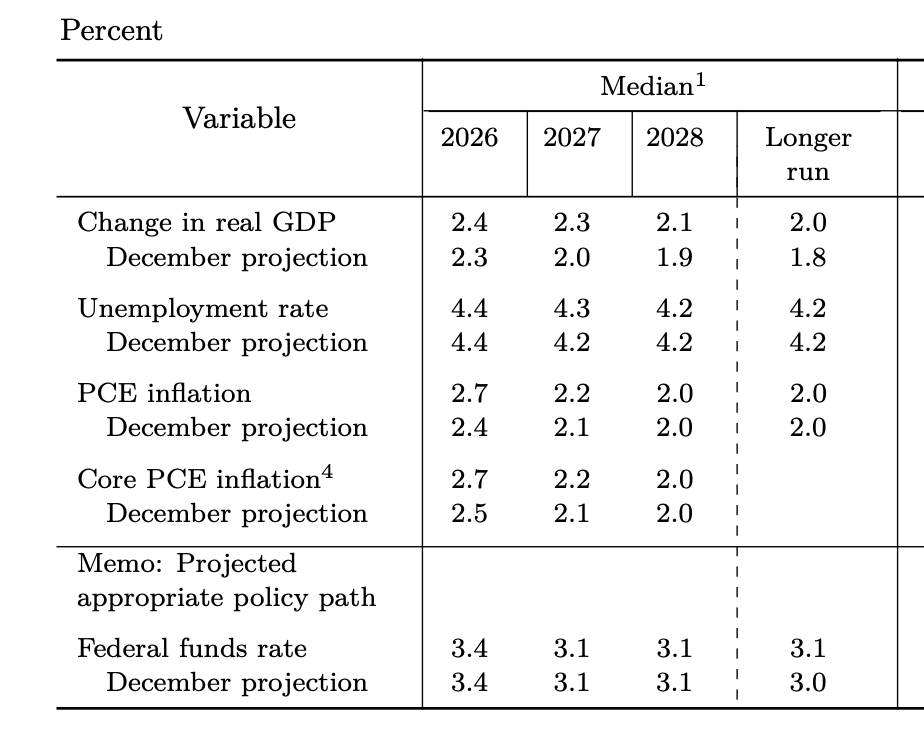
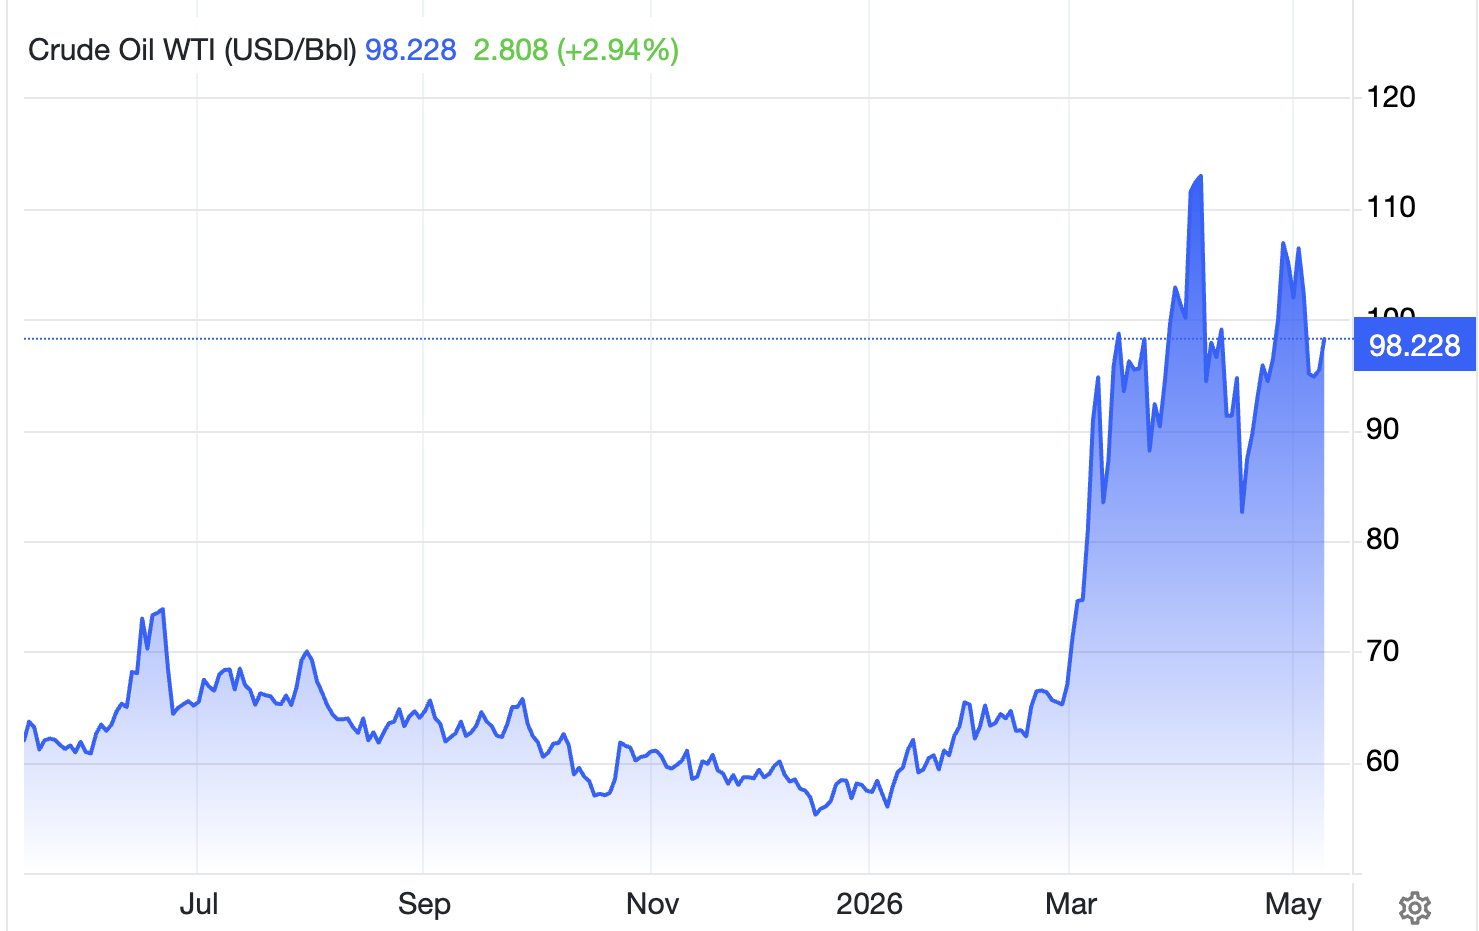
The labour configuration leaves theFed with a narrow path. TheMarch 2026 Summary of Economic Projections (SEP) released after the 17–18 March FOMC raised the median 2026PCE inflation projection to 2.7 percent from 2.4 percent, and held the median 2026 real GDP projection at 2.4 percent. TheMarch CPI release printed headline inflation at 3.3 percent year-on-year, the highest reading since May 2024, driven by a 12.5 percent rise in theenergy index, with retail gasoline up 18.9 percent and fuel oil up 44.2 percent on the back of US–Iran-related disruptions in the Strait of Hormuz.
A separate read on inflation comes from the demand side. University of Michigan year-ahead inflation expectations eased to 4.5 percent in the May preliminary survey from 4.7 percent in April, while long-term (5–10 year) expectations softened to 3.4 percent from 3.5 percent. These figures are survey-based measures of consumer expectations of future inflation, not professional-forecaster estimates of realised inflation. They sit roughly two percentage points above the Fed SEP path and well above the 2.3–3.0 percent five-year corridor that prevailed through the two years before the pandemic.
The distinction governs the policy stance. Realised core PCE at 3.2 percent year-on-year and headline at 3.5 percent, with long-term expectations drifted higher, and with employment near maximum sustainable levels on the Committee’s own definition, the case for pre-emptive easing is thin.CME FedWatch implied probabilities show approximately 94 percent odds of a hold at the16–17 June FOMC meeting, with thefederal funds target range at 3.50–3.75 percent. The Committee’s posture is symmetric, neither tilted toward cuts nor toward hikes, but the reaction-function asymmetry is real. Cutting on consumer-sentiment weakness alone, without realised inflation cooling, would risk re-igniting the very expectations the Fed has spent the last six months working to contain.
The single binding variable for the consumer is the real-wage gap, the difference between nominal wage growth and realised inflation. April’s average hourly earnings print of 3.6 percent year-on-year sits roughly 30 basis points above the March headline CPI of 3.3 percent, leaving a thin positive margin in real terms. The BLS real average hourly earnings release confirms that the gain has compressed materially over the last six months. If headline CPI tracks higher in Q2, driven by the same energy pass-through that lifted the March print, real wages would turn flat or negative. The most recent University of Michigan survey reports that real income expectations continued a decline among respondents, with about one third spontaneously volunteering gasoline prices and tariff concerns.
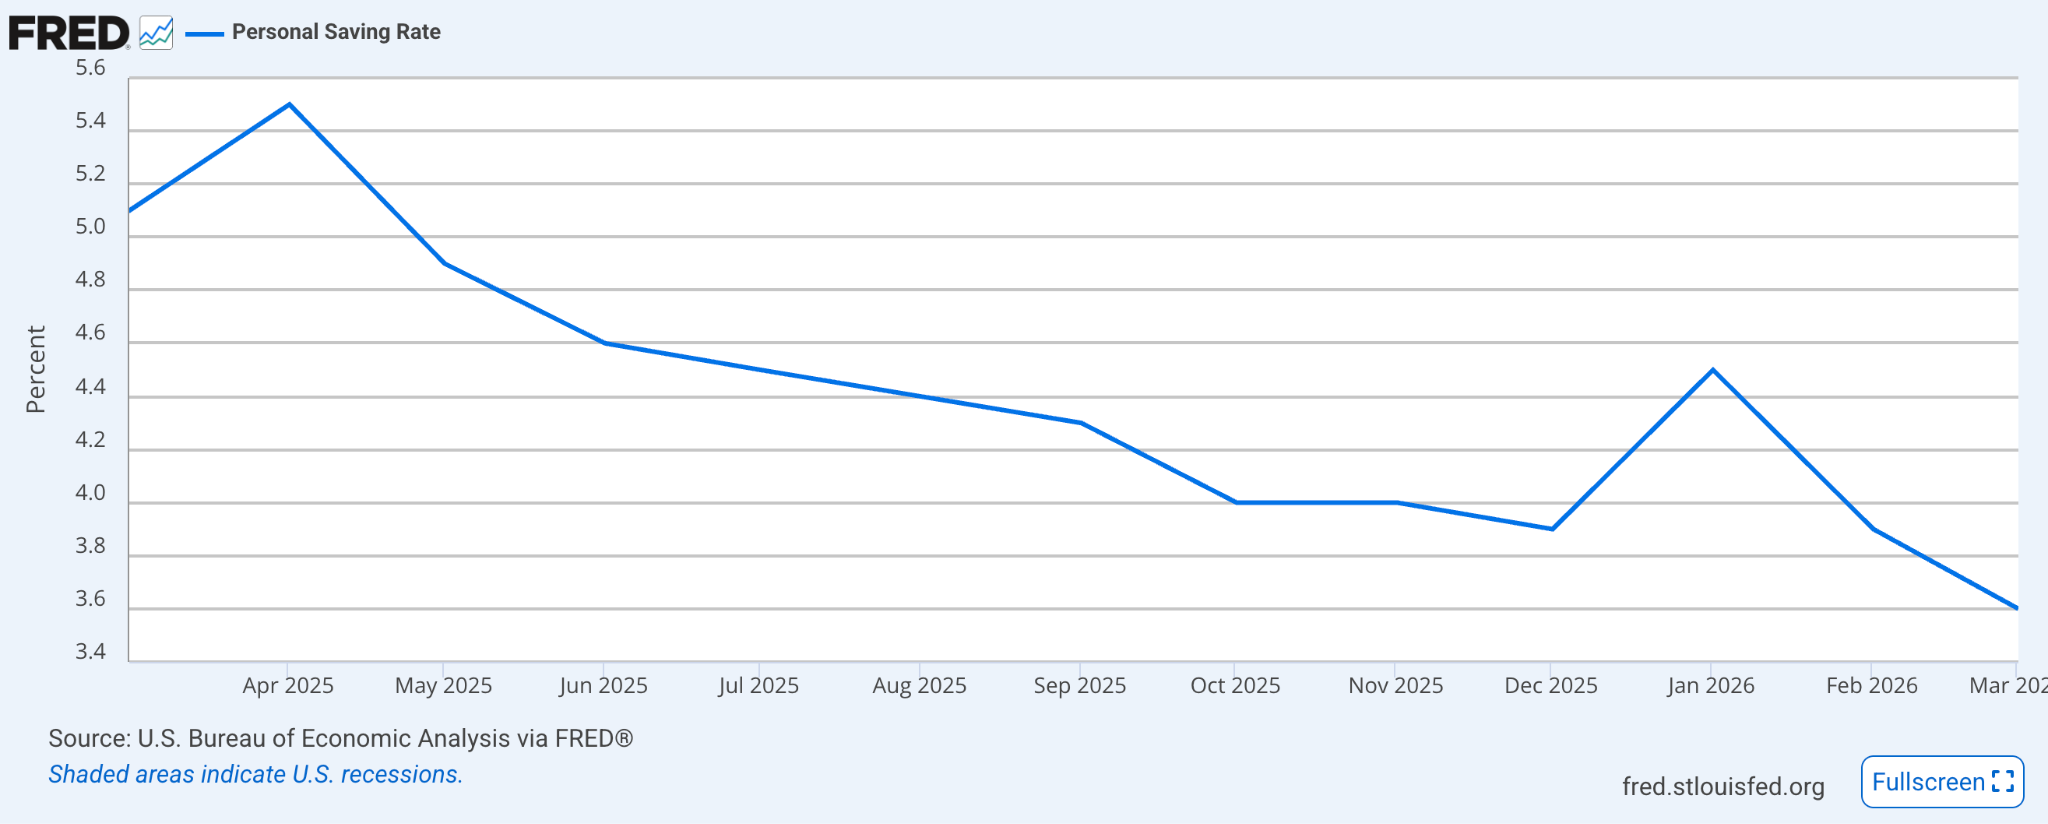
The pass-through to consumption is not yet visible in the spending data, and that is the central tension. Thepersonal savings rate released by the US Bureau of Economic Analysis (BEA) has trended below 4.5 percent since the start of the year, and the Federal Reserve’s G.19 Consumer Credit release of 7 May showed revolving credit growing at a 9.1 percent annualised pace in March alongside an average credit-card APR of 21.00 percent. Households are funding the marginal dollar of consumption from credit-card balances rather than from real income gains. The companion macro piece in this issue treats this configuration in detail; the labour-market read is the upstream cause.
What We Are Watching
Four labour-side indicators carry the signal for the next two prints:
Initial jobless claims, currently 200,000 with a four-week moving average at 203,250. A sustained move above 220,000 would be the first concrete sign that the firing side is lifting.
The civilian labour force participation rate, currently 61.8 percent. A further decline would compress breakeven employment growth and continue to suppress measured slack; a rebound would lift the unemployment rate mechanically and accelerate the Fed’s policy clock.
Average hourly earnings, currently 3.6 percent year-on-year. A move below the 3.3 percent headline CPI rate would shift the consumer onto fully negative real-wage territory and test the credit-funded consumption configuration.
The information sector, currently at minus 13,000 on the month. A widening contraction in this sector would be the cleanest early signal of AI-related labour displacement that the Beige Book commentary has not yet captured.
Conclusion
The April labour data describes a market that is statistically firm, structurally narrow, and increasingly contingent on a single pillar, steady employment offsetting compressed real-wage margins. The headline 4.3 percent unemployment rate reflects both a steady demand for labour and a tighter supply of workers, with Kansas City Fed estimates of 2026 breakeven employment growth running between 15,000 and 87,000 jobs per month, a range inside which an April print of 115,000 leaves the unemployment rate broadly unchanged. The Fed’s March SEP and the CME FedWatch implied path are consistent: a hold posture extending through the June FOMC and a reaction function keyed to realised inflation rather than consumer-survey expectations.
The risk is that real wages compress further, the consumer’s credit-funded buffer thins. The broader hard-versus-soft data divergence, the subject of the companion piece in this issue, would then resolve through deterioration in activity rather than through an inflection in sentiment.

Markets And Main Street Disagree: Hard Data Holds, Soft Data Breaks
The defining feature of the May data tape is the widening gap between the series that economists and markets watch and the series that consumers report. The University of Michigan preliminary May reading printed at 48.2, the lowest level since the survey began in 1952, even as Atlanta Fed GDPNow tracked Q2 real growth at 3.7 percent on 8 May, ISM Services recorded a twenty-second consecutive month of expansion, initial jobless claims held near a cycle low at 200,000 for the week ending 2 May, and the steady April labour data treated in the companion piece in this issue showed nonfarm payrolls holding at 115,000 with the unemployment rate at 4.3 percent. The hard data, in other words, is not corroborating the consumer’s read. The market is pricing through it: CME FedWatch shows roughly a 94 percent probability of a hold at the 16–17 June FOMC meeting. The divergence is itself the story, because the reconciliation path between the two, through either a deterioration in activity or an improvement in sentiment, is the variable that defines the asset-pricing regime over the next two quarters.
The Hard Data Is Still Solid
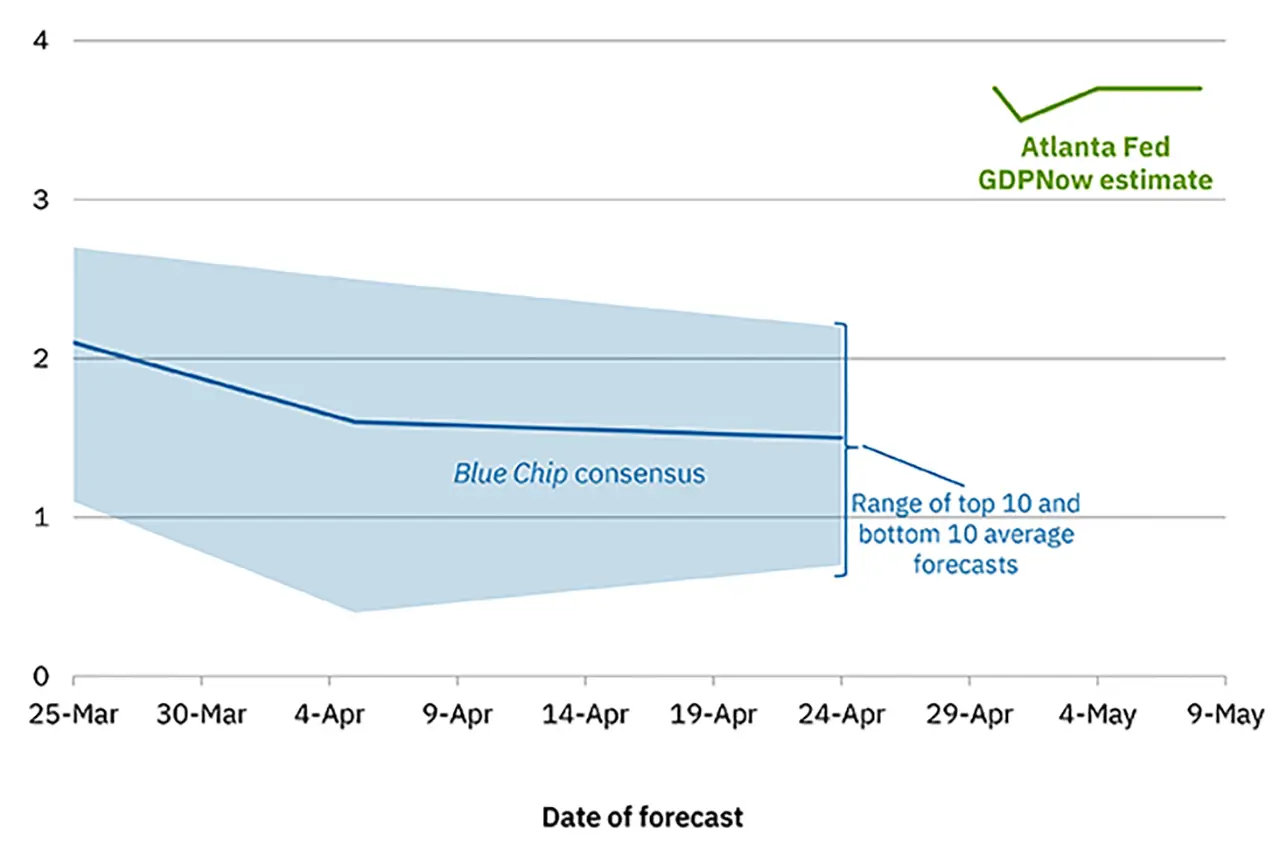
The Atlanta Fed GDPNow estimate for Q2 2026 stood at 3.7 percent on 8 May, unchanged from the prior session and up from 3.5 percent on 1 May. The latest update reflected an upward revision to real gross private domestic investment growth, from 8.6 percent to 9.2 percent, partly offset by a softening in personal consumption from 2.7 percent to 2.6 percent. The investment leg is consistent with the AI-capex thesis that has carried much of the economists’ optimism through Q1, with spending on information processing equipment and software, the single largest contributor to fixed-investment momentum.
A 3.7 percent Q2 nowcast is not, however, a regime-shift signal. The March 2026 FOMC Summary of Economic Projections places the median 2026 real GDP forecast at 2.4 percent, the International Monetary Fund April World Economic Outlook projects 2.4 percent, and private-sector forecasts cluster between 1.7 and 2.0 percent. The implied path is a strong Q2 followed by a deceleration through the second half, consistent with consumption funded increasingly from depleting balance-sheet buffers, an investment cycle whose AI-capex contribution is concentrated in a narrow set of firms, and a Fed posture that is unlikely to ease pre-emptively. Q2 is the high-water mark on this read, not a baseline.
The activity surveys are corroborating. The Institute for Supply Management’s Services PMI printed at 53.6 for April, down only 0.4 points from March’s 54.0, and inside the index, the Business Activity sub-component rose 2.0 points to 55.9. April was the twenty-second consecutive month of expansion in the services sector, the part of the economy that accounts for roughly seventy percent of US output. The ISM Manufacturing PMI registered 52.7, also in expansion. Neither index is signalling a contraction.
The labour data tells the same story. As the companion piece in this issue treats in detail, the April Employment Situation report showed nonfarm payrolls rising 115,000 against a 55,000 consensus, the unemployment rate holding at 4.3 percent, and average hourly earnings rising 3.6 percent year-on-year. The “low-hire, low-fire” regime has not yet broken. The 4.3 percent unemployment reading also reflects a tighter labour supply than headline payrolls alone would imply: the Federal Reserve Bank of Kansas City places 2026 breakeven employment growth, the monthly pace required to keep unemployment steady, between 15,000 and 87,000 jobs, well below the trailing-twelve-month payroll trend.
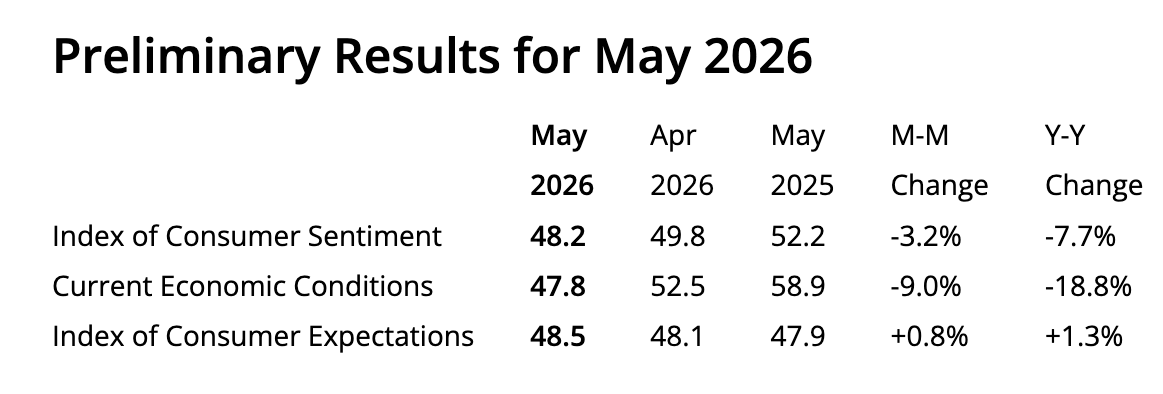
The contrast on the soft side is sharp. The University of Michigan Index of Consumer Sentiment preliminary reading for May fell to 48.2 from 49.8 in April, the lowest level on a series that runs back to 1952. The Surveys of Consumers detail is more revealing than the headline. The Current Conditions Index fell roughly 9 percent on the month, while the Expectations Index ticked higher for the first time in four months. The deterioration is therefore concentrated in the assessment of present-day living conditions, buying conditions for major purchases, perceptions of personal finances, rather than in forward-looking variables.
Joanne Hsu, Director of the Surveys of Consumers, attributed the move to “a surge in concerns about high prices both for personal finances as well as buying conditions for major purchases,” noting that approximately one third of respondents spontaneously volunteered gasoline prices and tariff-related concerns. With retail gasoline holding above $4 per gallon for most of April and tariff pass-through visible in goods categories tracked in the BLS CPI, the consumer is responding to a price level that has not normalised even as the rate of change moderates.
The Conference Board’s Consumer Confidence Index reported a similar pattern in April. Both surveys now sit materially below their long-run averages and are tracking trajectories more typical of recession periods than of an economy printing 3.7 percent nowcast growth.
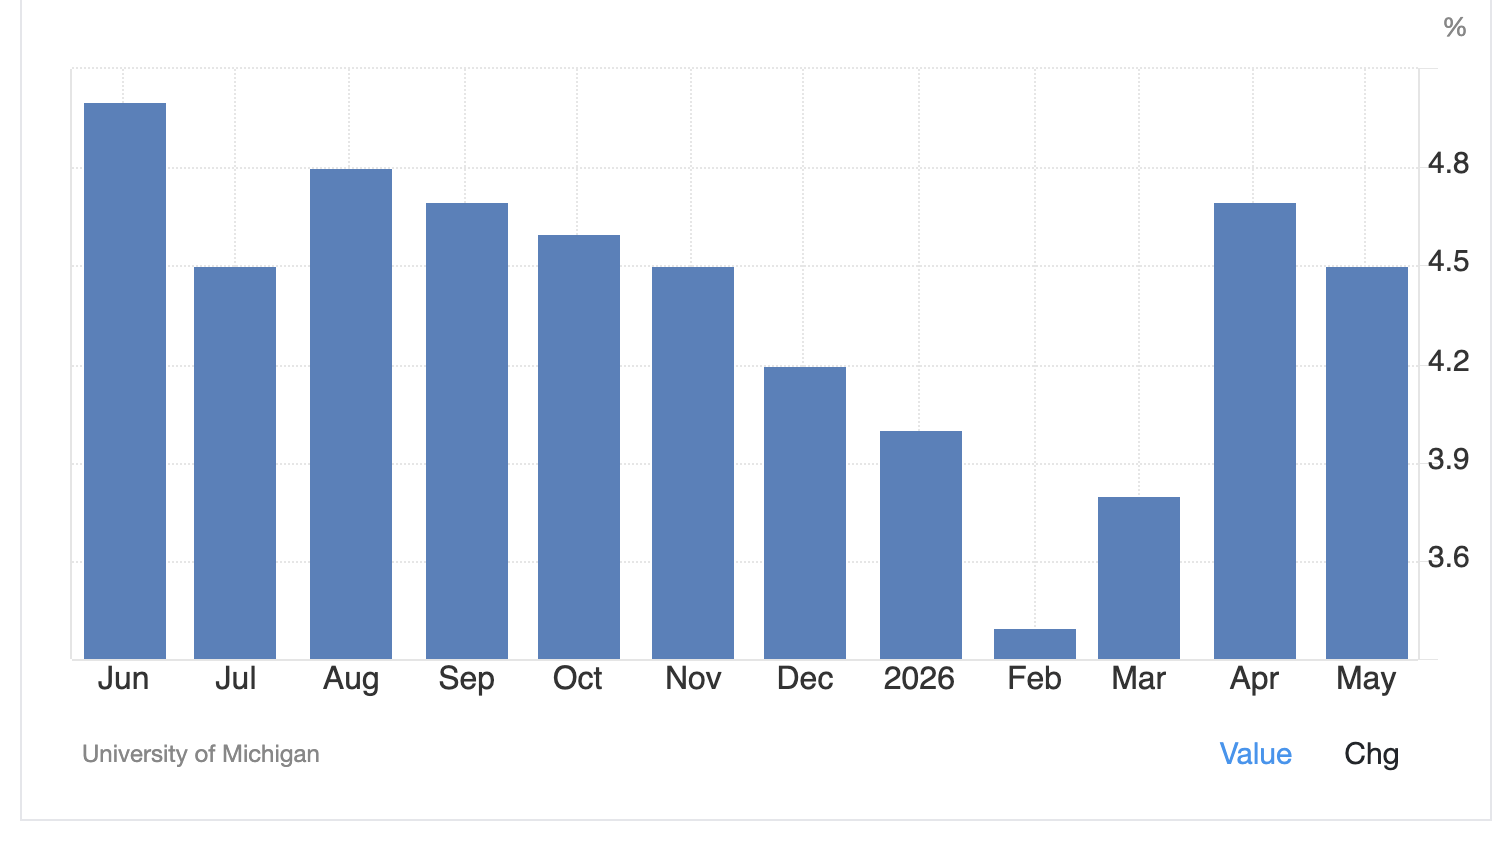
Year-ahead inflation expectations in the same University of Michigan survey eased to 4.5 percent in May from 4.7 percent in April, while long-term (5–10 year) inflation expectations softened to 3.4 percent from 3.5 percent. These figures are survey-based measures of consumer expectations of future inflation, not professional-forecaster estimates of realised inflation. The March 2026 FOMC Summary of Economic Projections places the Fed’s median 2026 PCE inflation forecast at 2.7 percent, against a March CPI print of 3.3 percent year-on-year. The U-Mich survey number sits roughly two percentage points above that path, reflecting the gasoline and tariff price signal that consumers are responding to in real time. The directional improvement in the May U-Mich print is welcome from a Fed perspective, but the absolute level remains the binding constraint. The pre-pandemic five-year reading sat in a 2.3–3.0 percent range; the current 3.4 percent is well above it and well above the 2 percent PCE target that anchors the Fed’s framework.
The variable that constrains policy is the level of expected inflation rather than the level of inflation itself. Federal Reserve Chair Jerome Powell has consistently described the long-term reading as the line he will not let move, and while May’s print represents a one-month directional softening, four consecutive months of long-term expectations above 3.3 percent constitute a drift higher relative to the 2.9–3.1 percent range that prevailed through 2024. The reanchoring of expectations is the precondition for any sustained easing cycle. One softer print is not sufficient to claim it.
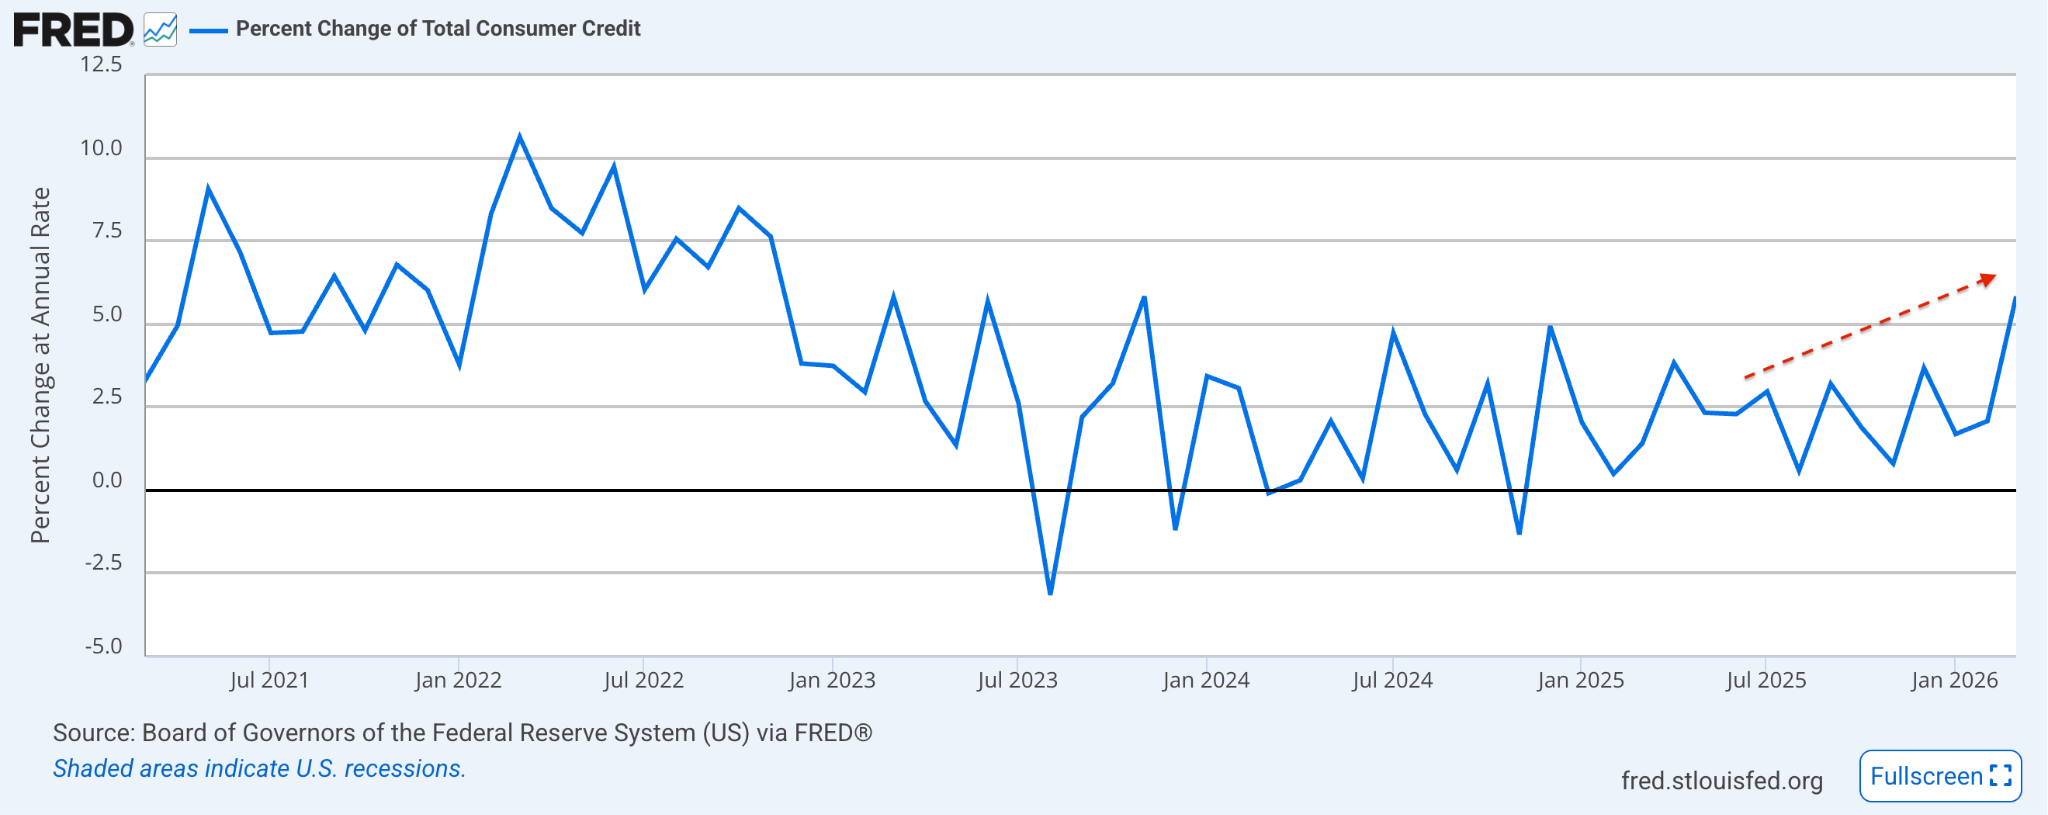
The Federal Reserve’s G.19 Consumer Credit release on 7 May provides the mechanical link between the two narratives. Total consumer credit rose at a seasonally adjusted annual rate of 5.8 percent in March, the strongest monthly print of the year and a sharp re-acceleration from 2.1 percent in February and 1.7 percent in January. Revolving credit, the credit card balances most sensitive to month-to-month shifts in household finances, expanded at a 9.1 percent annualised rate, up from a near-flat 0.3 percent in February. Nonrevolving credit grew 4.7 percent, lifted by federal student loan flows and motor vehicle financing.
The level data confirms the trajectory. Total consumer credit outstanding reached $5.14 trillion in March, with revolving balances at $1.337 trillion. The average APR on credit card accounts assessed interest sat at 21.52 percent in Q1, close to the cycle high, and the all-accounts APR held at 21.00 percent.
Households are funding marginal consumption at near-record real and nominal rates, as the personal savings rate released by the Bureau of Economic Analysis holds below 4.5 percent, steady since the start of the year.
The G.19 reconciles the two narratives. Hard-data consumption can hold while soft-data sentiment collapses precisely because the marginal funding source has shifted from real income growth to revolving credit drawdown. This works for a meaningful period, but the configuration is mathematically self-limiting: revolving balance growth at a 21 percent average rate compounds quickly relative to nominal wages rising at 3.6 percent. The question here is how long the buffer holds.
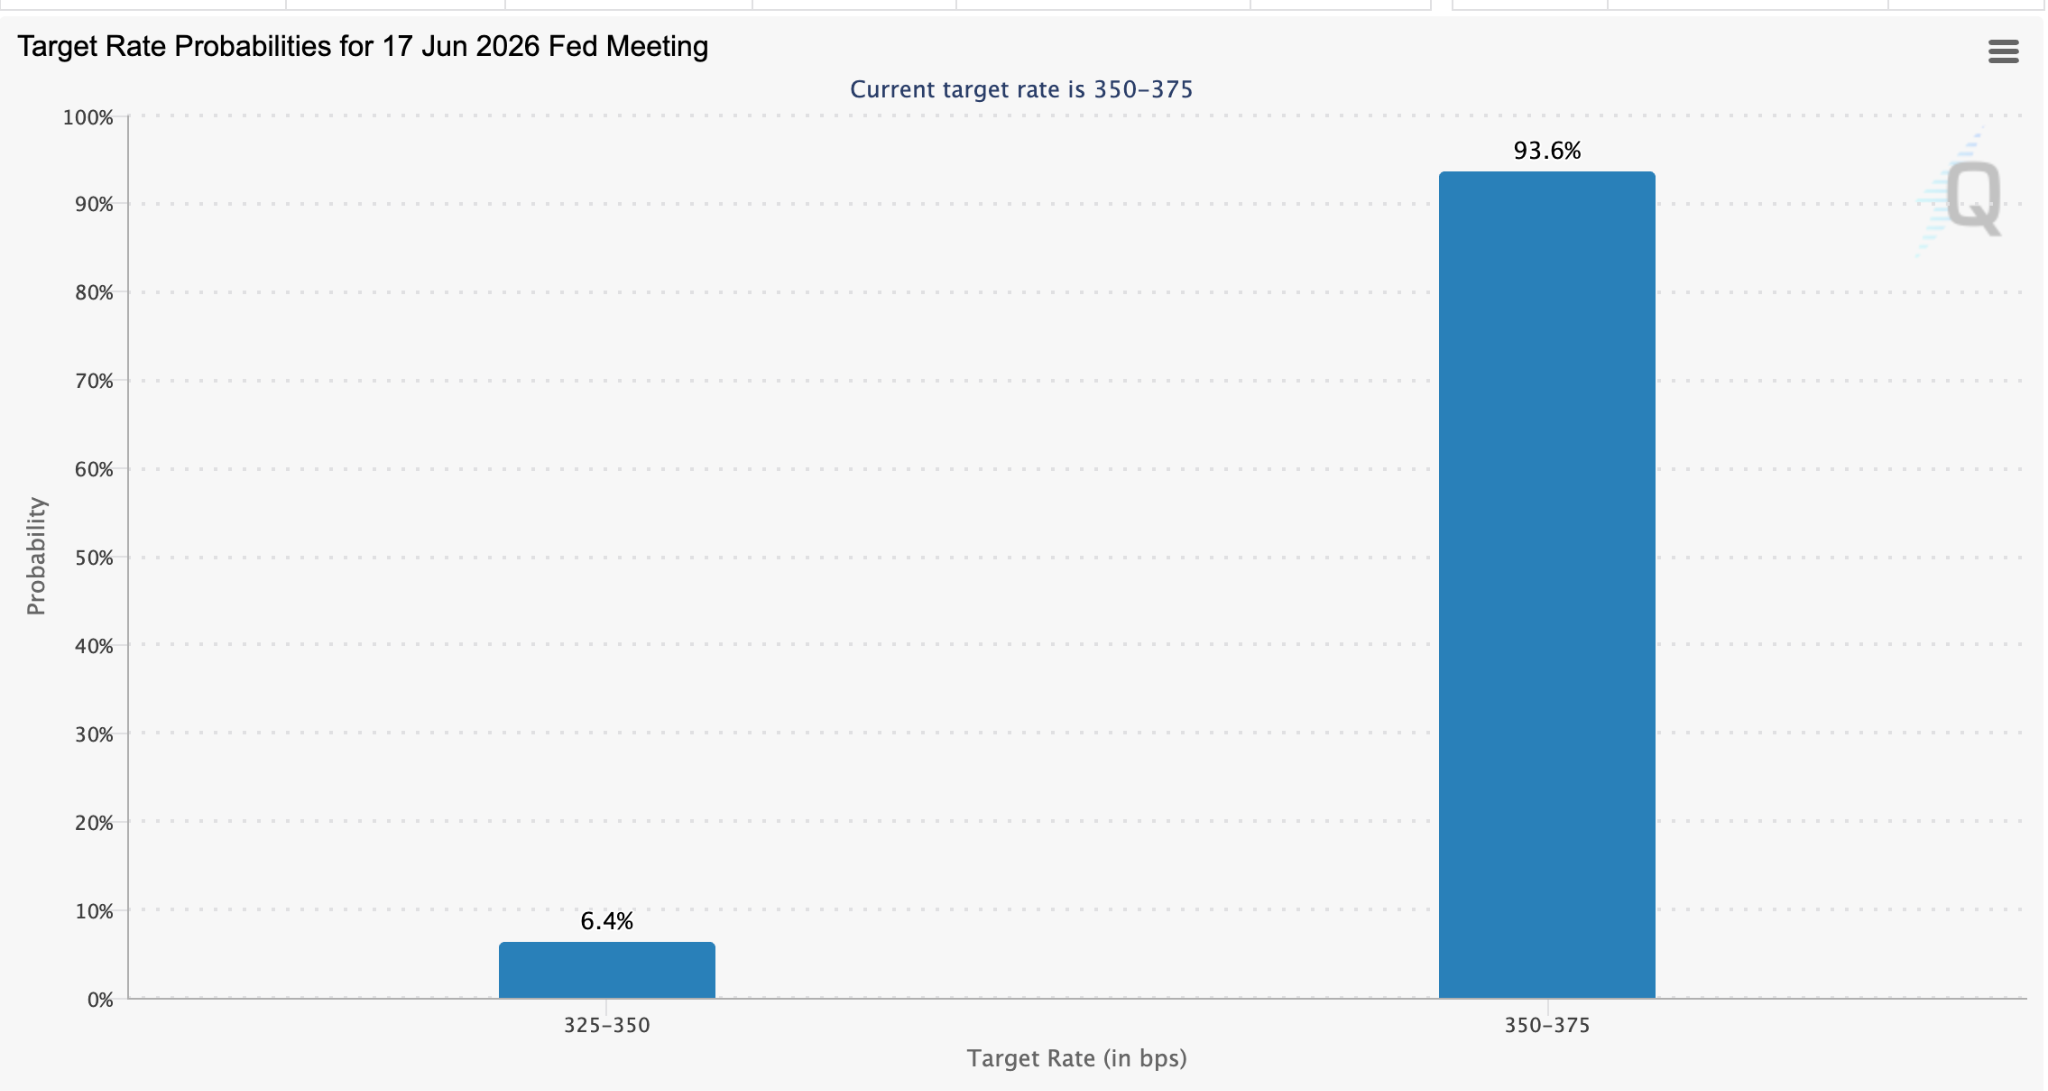
CME FedWatch implied probabilities show approximately 94 percent odds of a hold at the 16–17 June FOMC meeting, with the federal funds target range remaining at 3.50–3.75 percent. The strip out through year-end shows a near-symmetric distribution between modest cuts and modest holds. Markets are pricing through the soft-data weakness rather than reading it as a forward signal.
The reasoning is internally consistent. The labour data has not deteriorated, the activity nowcasts are firm, and long-term inflation expectations remain above the level the Fed would view as anchored. Cutting on the basis of consumer sentiment alone, with core PCE at 3.2 percent and headline PCE at 3.5 percent year-on-year on the most recent print, would risk re-igniting the inflation expectations the Fed has spent the last six months working to contain.
The Fed’s reaction function is keyed to realised inflation and labour-market slack, neither of which has yet provided the trigger.
The conditions that would shift the Committee’s stance are clearer than at any point this cycle. A meaningful uptick in the firing side of the labour market, initial claims breaking out of the 195,000–215,000 range and sustaining higher for two to three weeks, would shift the calculus, particularly if accompanied by a payrolls print below 75,000. A simultaneous easing in the crude oil complex back below $100 per barrel, removing the energy pass-through pressure on headline inflation, would ease the calculus further. Absent both, the policy stance described by the May data is a hold extending well into the second half.
The reconciliation between the hard-data and soft-data narratives is the central variable for the next two quarters. Beyond the labour-side variables tracked in the companion piece, initial jobless claims, the labour force participation rate, average hourly earnings, and the information sector, three macro indicators carry the signal:
Revolving credit growth, currently running at a 9.1 percent annualised pace. A continuation at this rate alongside flat or falling real wages would compress the household balance sheet within two-to-three quarters.
University of Michigan 5–10 year inflation expectations, now at 3.4 percent. A move back into the 3.0–3.2 percent corridor would unlock policy-easing space; a move above 3.6 percent would close it further.
Retail gasoline, currently above $4 per gallon. The price level, not the rate of change, is the variable driving the consumer-sentiment series. A sustained move below $3.75 would be the cleanest catalyst for a soft-data inflection.
Movement in the same direction across both lists would resolve the divergence. On the latest data, none of the variables in either set is doing so.
Conclusion
The macro picture entering mid-May is firm at the headline level, fragile underneath, and increasingly bifurcated between the data series economists watch and the data series consumers report. Growth is tracking 3.7 percent on the Atlanta Fed nowcast, the services sector is in its twenty-second consecutive month of expansion, and the labour market continues to print near trend with claims at a cycle low.
At the same time, the University of Michigan headline at 48.2 is the lowest reading in the seventy-three-year history of the series.
Revolving consumer credit is expanding at a 9.1 percent annualised pace as households fund the marginal dollar of consumption from credit-card balances rather than savings or real wage gains. The Federal Reserve has chosen to weight the hard data, and CME FedWatch is pricing that posture through the year-end. The reconciliation will arrive eventually. Either through a hard-data deterioration that brings activity data in line with what the consumer is already experiencing, or through an inflection in energy and trade-policy variables that pulls the consumer back toward the data the Fed sees.
The asset-pricing regime that emerges between now and the September meeting depends almost entirely on which path resolves the gap.

News From the Cryptosphere
CME Launches Regulated Avalanche and Sui Futures

CME Group has officially launched regulated futures contracts tied to the cryptocurrencies Avalanche (AVAX) and Sui (SUI), marking another major step in the institutional expansion of the digital asset derivatives market. The first trades were executed as block transactions between institutional trading firms FalconX and G-20 Group, signalling immediate participation from professional market makers and liquidity providers.
The new contracts are being offered in both micro-sized and standard formats, allowing traders to choose different levels of exposure and capital efficiency. CME said the products were designed to help institutional investors hedge price volatility and gain regulated exposure to a broader set of crypto assets beyond bitcoin and ether. Giovanni Vicioso, CME Group’s Global Head of Cryptocurrency Products, stated that demand for diversified crypto risk-management tools has been growing rapidly as more institutions enter the market.
The launch is particularly significant because Avalanche and Sui are among the first newer-generation Layer-1 blockchain tokens to receive dedicated futures products on a major US-regulated derivatives exchange. Analysts view this as a sign that institutional investors are increasingly treating selected altcoins as long-term investable assets rather than speculative retail-only tokens. FalconX also pointed to the rise of “digital asset treasury” strategies, where companies and investment vehicles accumulate assets like AVAX and SUI for shareholder exposure.
CME further announced that its cryptocurrency futures and options markets will begin operating 24 hours a day, seven days a week starting 29 May, bringing crypto derivatives trading closer to the nonstop structure of global spot crypto markets. The move follows CME’s broader push into digital assets, which recently included plans for Bitcoin Volatility futures and expanded institutional crypto products.

South Korea Expands Crypto Controls With Tougher Oversight on Overseas Transfers

South Korea is moving to tighten regulation of cross-border cryptocurrency activity after lawmakers approved amendments to the country’s Foreign Exchange Transactions Act. The new framework will require businesses involved in transferring digital assets overseas, including crypto exchanges, custody providers, and other virtual asset service firms, to formally register with the Ministry of Economy and Finance.
Authorities say the goal is to strengthen monitoring of overseas crypto flows, improve anti-money laundering enforcement, and bring digital asset transactions under the same oversight structure used for traditional foreign-exchange activity.
The legislation reflects South Korea’s broader push toward stricter crypto supervision following rising concerns over illicit capital movement, market manipulation, and regulatory gaps tied to offshore trading platforms. Regulators are also discussing expanded Travel Rule requirements that could force exchanges to verify a wider range of crypto transfers, potentially including transactions below the current threshold of 1 million won. Industry groups have warned these measures may create operational burdens, transaction delays, and increased compliance costs for exchanges and users alike.
The policy shift comes as South Korea prepares additional digital asset reforms, including a planned 22 percent tax on crypto gains beginning in 2027. Officials are coordinating with major domestic exchanges such as Upbit, Bithumb, Coinone, Korbit, and Gopax to establish reporting standards ahead of implementation. Analysts view the latest bill as another sign that South Korea intends to become one of the world’s most tightly regulated crypto markets while still allowing the industry to operate within a more formal legal structure.

Elizabeth Warren Demands Answers From Meta Over Stablecoin Plans

US Senator Elizabeth Warren has called on Meta to disclose details about its reported plans to integrate a third-party stablecoin into its platforms by the second half of 2026.
In a letter addressed to CEO Mark Zuckerberg, Warren raised concerns over the potential risks to financial stability and customer privacy across Meta’s network of 3.5 billion customers. The Senator cited reports that Meta is conducting a limited trial involving a third-party stablecoin ahead of a broader rollout next year.
Warren described the initiative as Meta’s second attempt to enter the stablecoin sector following the failed Libra project in 2019, which faced strong opposition from regulators and lawmakers. She warned that deeper involvement in digital payments could allow Meta to expand its access to financial transaction data while increasing systemic risks.
The Senator also questioned whether Meta plans to update its MetaPay wallet to support stablecoin balances and requested details on the stablecoins being considered for integration. Additional concerns included risk management measures, profit-sharing arrangements with issuers, privacy protections, and controls against illicit finance.
Warren has asked Meta to respond to seven questions by 20 May regarding the structure of the trial, launch timeline, and whether the company still intends to avoid issuing its own stablecoin or private digital currency.
