

Issue #203:
BTC Stuck Between Bulls and Bears
Fragile Breakout, Divided Macro
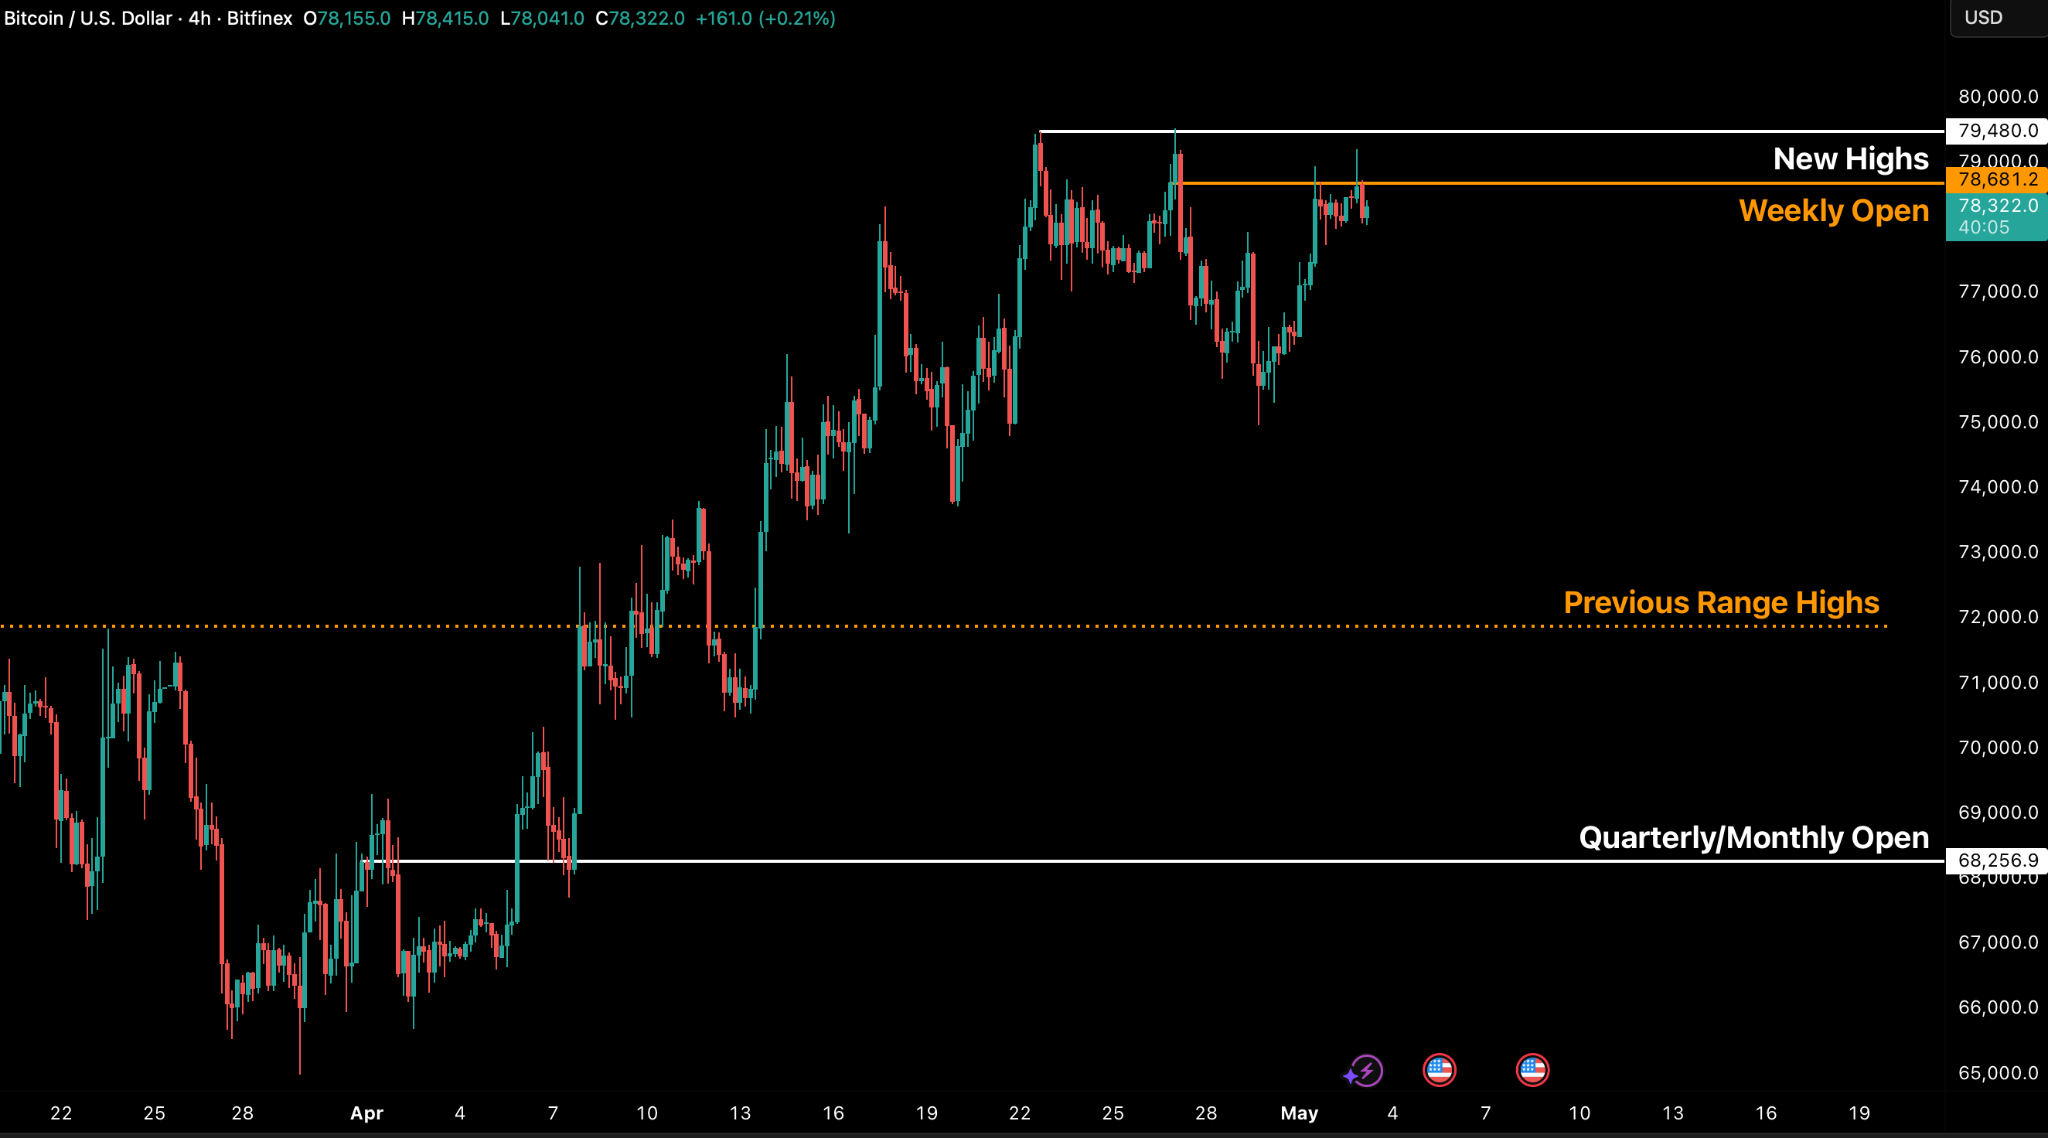
Bitcoin’s latest breakout attempt stalled at the dense $78–$79,000 resistance zone defined by the True Market Mean, the Short-Term Holder Realised Price, and the weekly open. The pullback was not driven by aggressive spot selling, but instead passive profit-taking from short-term holders exiting near breakeven. This keeps BTC in a fragile but constructive range: buyers are still active, but the market has not yet generated enough demand to absorb overhead supply and confirm a sustained structural breakout.
The macro backdrop has become slightly less hostile, even if not outright supportive, removing some pressure from risk assets, but with no clear liquidity tailwind and persistent geopolitical risk in the Middle East, Bitcoin still requires strong spot-led demand to move decisively higher. That demand is improving, but it remains uneven. US spot Bitcoin ETFs recorded $2.44 billion in April inflows, the strongest month since October 2025. At the same time, Strategy continues to dominate institutional absorption, with year-to-date accumulation far exceeding ETF demand. This creates a meaningful structural bid beneath the market, but the immediate technical challenge remains unchanged: BTC must reclaim and hold above $78,400–$78,900 to shift momentum higher. Failure to do so keeps the low-$70,000s as the next key support zone, though continued ETF inflows and demand from STRC, the preferred equity instrument issued by MSTR, could still force a brief upside breakout before the next pullback.

US macro conditions are increasingly defined by a divergence between stable headline growth and weakening underlying fundamentals. First-quarter GDP output held at around trend, supported by consumption and investment, but the composition points to a slowing trajectory as housing contracts and net exports drags.
At the same time, inflation has re-accelerated, driven largely by energy price rises, pushing headline measures higher and eroding real income gains. The labour market remains the key pillar of resilience, with low layoffs offsetting slower hiring, but consumption is increasingly being financed through savings drawdowns and credit expansion rather than wage growth. Inflation expectations have also moved higher across both short- and long-term horizons, tightening the Federal Reserve’s policy constraints and raising the risk of a stagflationary backdrop if growth continues to soften while price pressures persist.
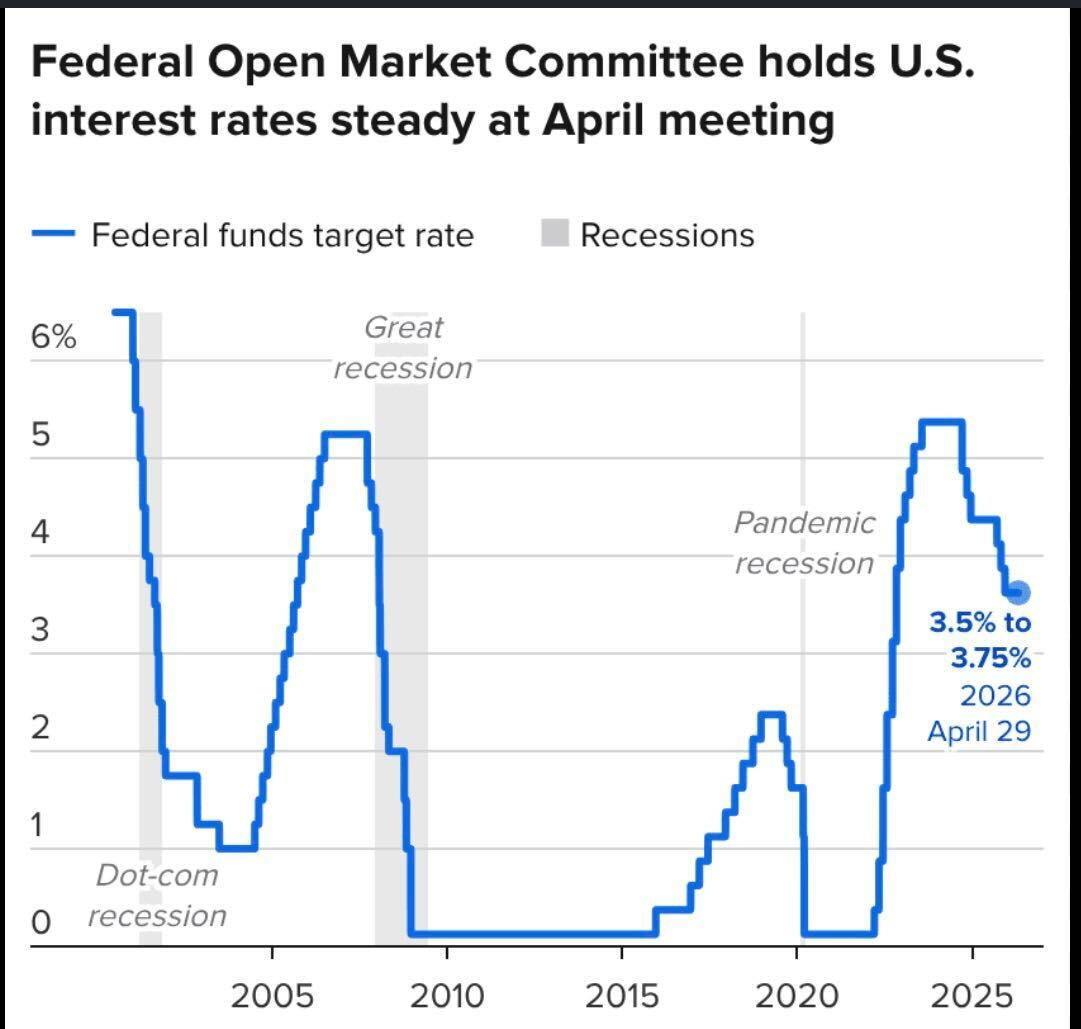
This tension is reflected directly in monetary policy. The Federal Reserve held rates steady, but internal divisions within the FOMC have become more pronounced, with disagreement shifting from the level of rates to the direction of the next move. While the official stance still leans toward eventual easing, policymakers signalled a growing openness to a more neutral or even restrictive path if inflation fails to stabilise.
Markets interpreted the outcome as a hawkish hold, repricing yields higher across the curve and reinforcing a “higher-for-longer” narrative. The combination of firmer inflation, rising expectations, and a divided policy outlook suggests that the bar for rate cuts has moved materially higher, leaving financial conditions tighter and risk assets more sensitive to incoming macro data
Against this backdrop, developments in crypto reflect a parallel trend toward institutionalisation and state involvement. At the sovereign level, the US government is moving closer to operationalising a Strategic Bitcoin Reserve, signalling a shift in how Bitcoin is viewed, from seized asset to potential reserve instrument, with implications for broader institutional adoption. Meanwhile, Brazil’s central bank has tightened its regulatory perimeter by excluding cryptocurrencies from its official cross-border payments framework, underscoring a policy direction that permits crypto activity but confines it outside regulated foreign exchange channels.

Market Signals
Bitcoin Attempts Breakout, But Fails
Bitcoin attempted to move higher early last week but has yet to break through the highs established in mid-April. Pullbacks are attributed to passive profit-taking at premium prices (in the context of aggregate breakeven prices) by Short-Term Holders, rather than any aggressive selling pressure.
After a peak-to-trough decline of 5.75 percent, price has recovered gradually over the course of the week, bottoming post-FOMC and is again testing the zone of resistance around the $78-79,000 band. There are now a multitude of levels and on-chain signals to watch, including the Weekly Open, the Short-Term Holder Realised Price and the True Market Mean as support/resistance levels.
Following the 29 April 2026, Federal Open Market Committee (FOMC) meeting, which saw the most internally fragmented vote since October 1992, the market’s reaction was relatively subdued.
From the perspective of risk assets, the rate hold was entirely anticipated, with the crucial takeaways residing in the statement’s text, specifically the persistence of an easing bias among some members, despite some hawkish objections.
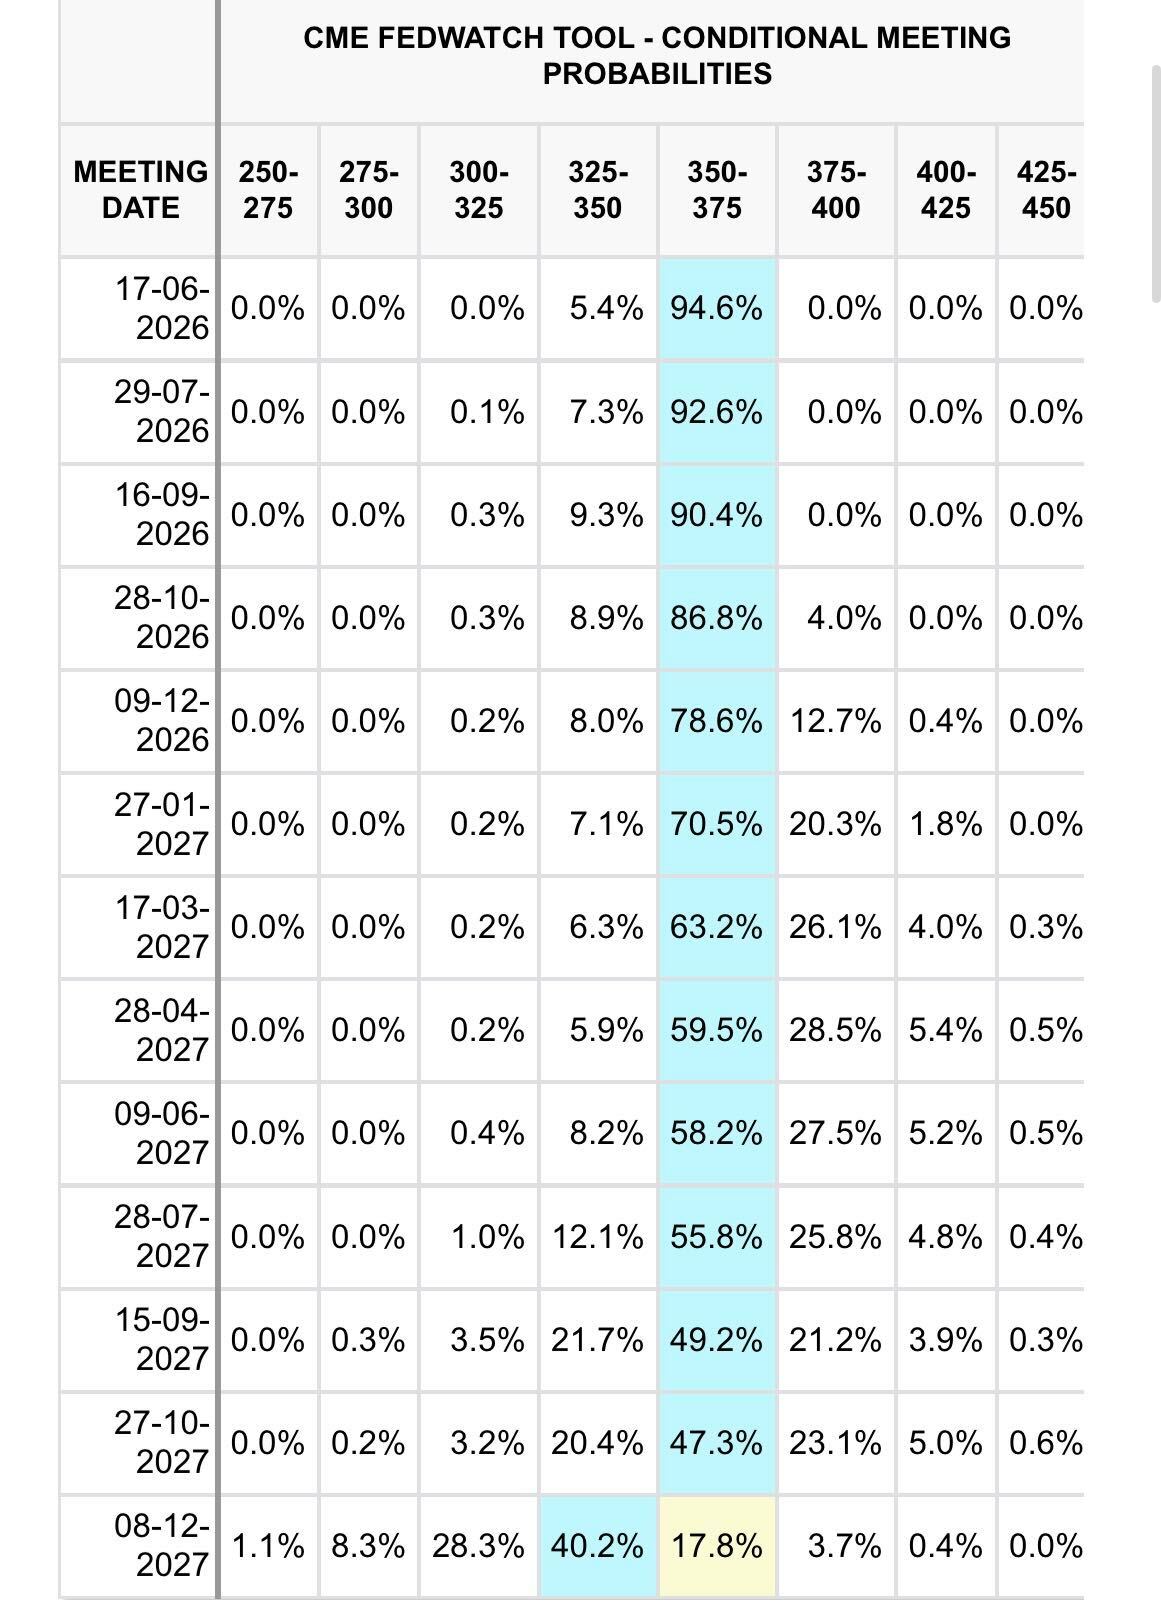
Futures pricing for Fed Funds continues to project the next rate cut occurring in the latter half of 2026. Markets reacted accordingly, with the US 10-year Treasury yield declining to 4.35 percent on 2 May, a 10 basis point retracement from the nine-month high of 4.45 percent recorded the previous week.
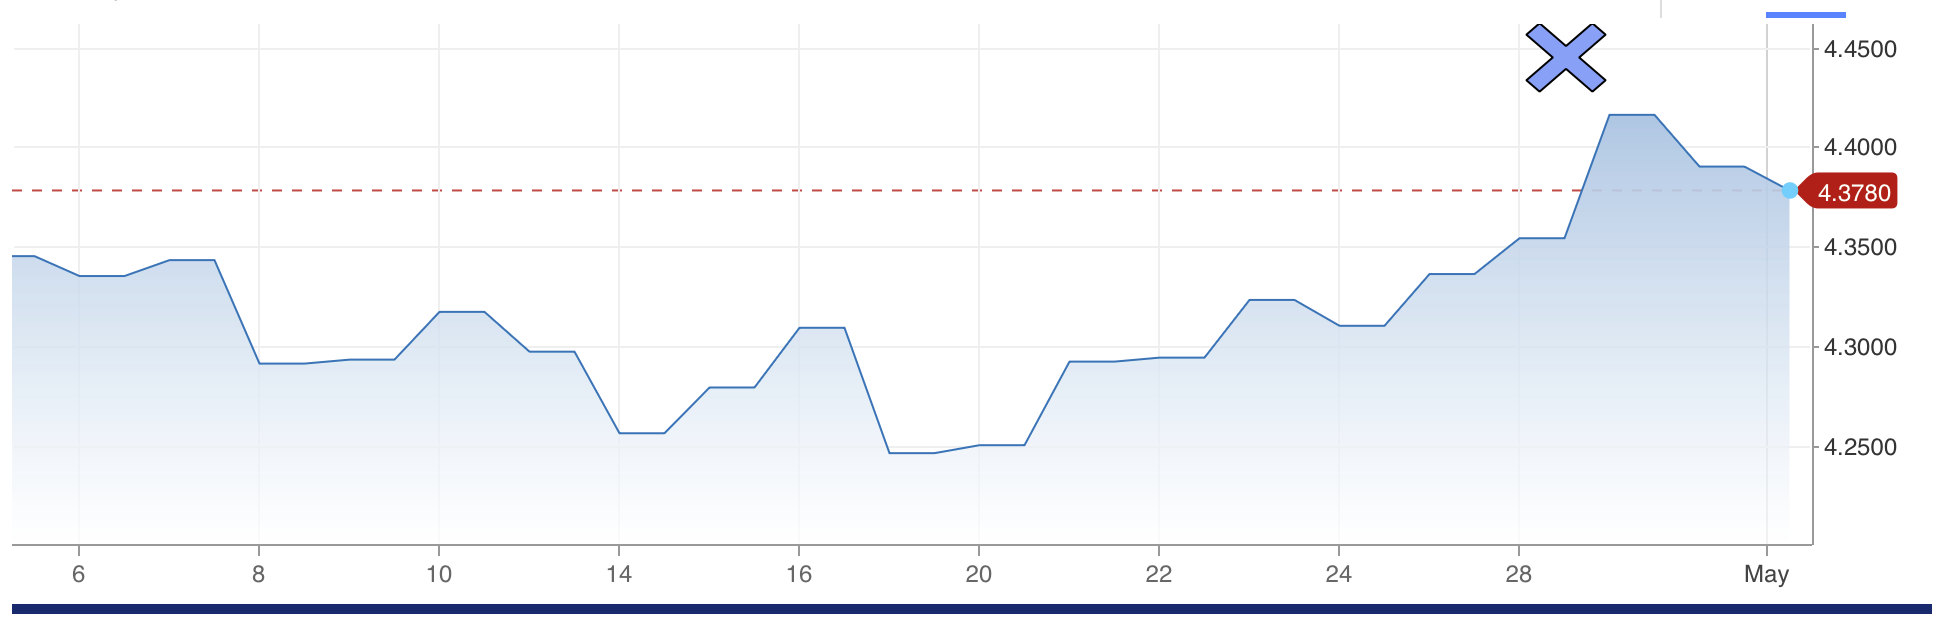
The directional move matters more than the absolute level: yields falling removes one headwind. In terms of real yields, the 10-year TIPS rate remains elevated, but the macro ceiling is not tightening. It is holding. Risk assets declined leading up to the event and BTC front-ran it but following the decision the market re-approached weekly highs. Given we are in a market which lacks any liquidity tailwinds, but has deteriorating macro headwinds from the ongoing tension in the Middle East, this is encouraging.
While BTC has stalled at resistance, the aggressive buying we continue to see in the market, and attempts to break out from the current resistance level, is very positive for bulls.
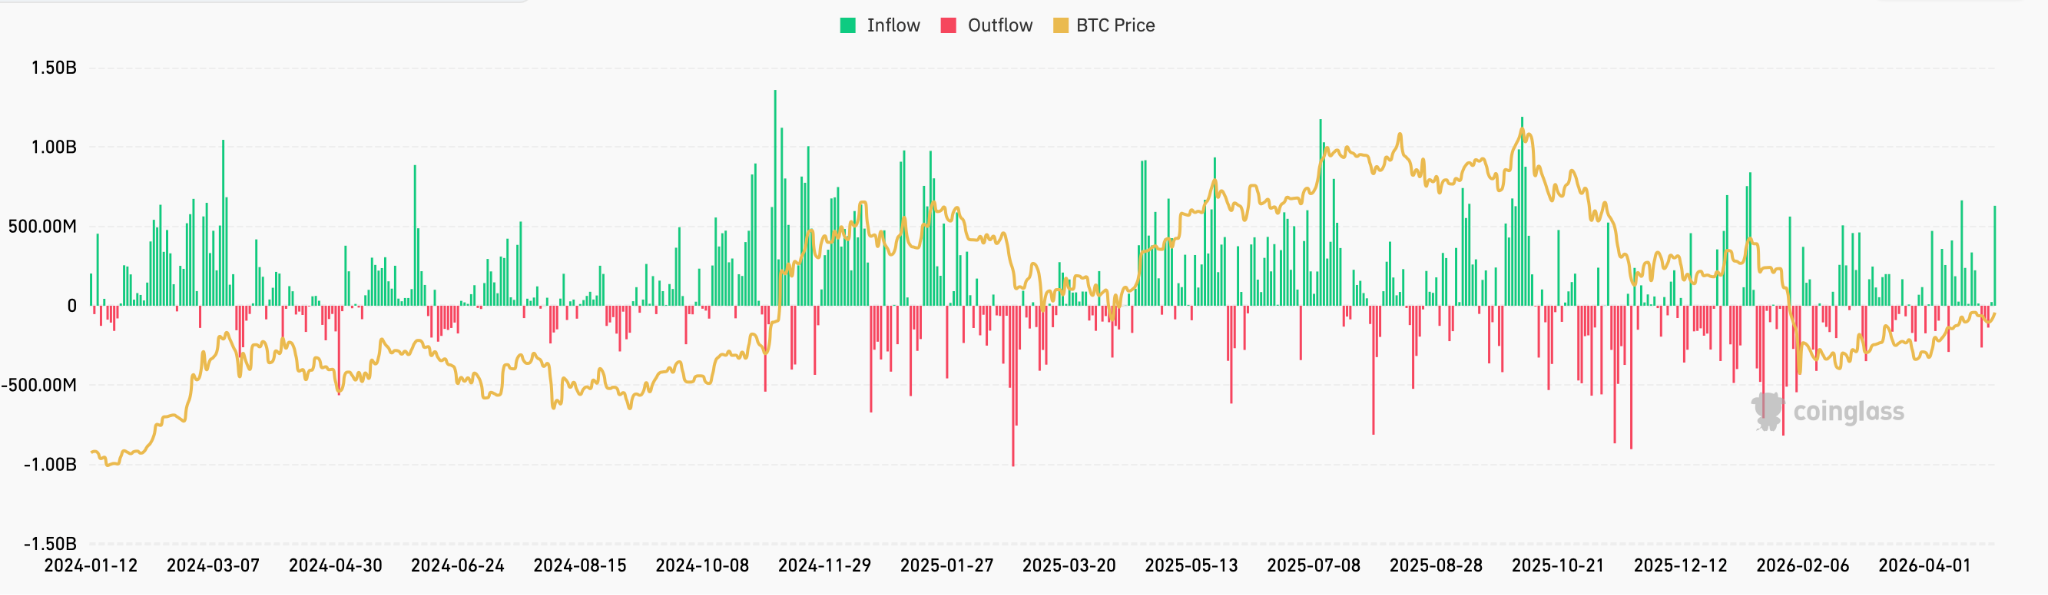
The first trading day of May added $630 million, extending an unbroken nine-day positive streak. BlackRock’s IBIT now holds approximately 812,000 Bitcoin, representing roughly 62 percent of total spot ETF market share. Cumulative net inflows since the launch of the ETFs in January 2024, now stand at $58.5 billion.
ETF flow data, however, has not been the dominant institutional demand channel this year.
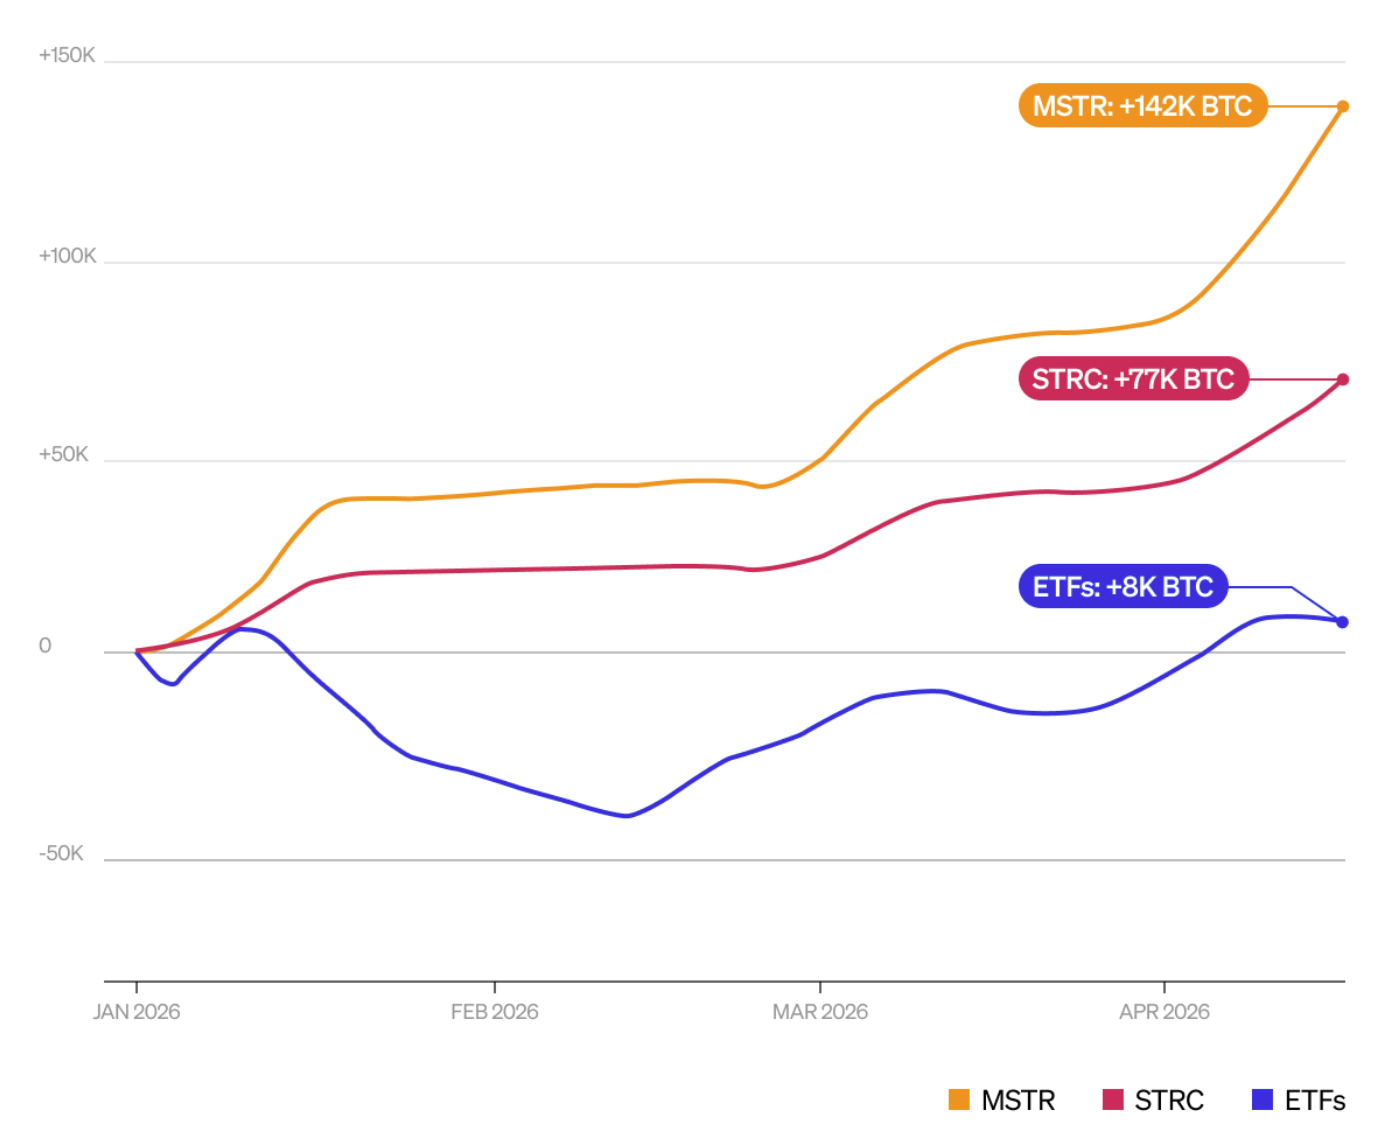
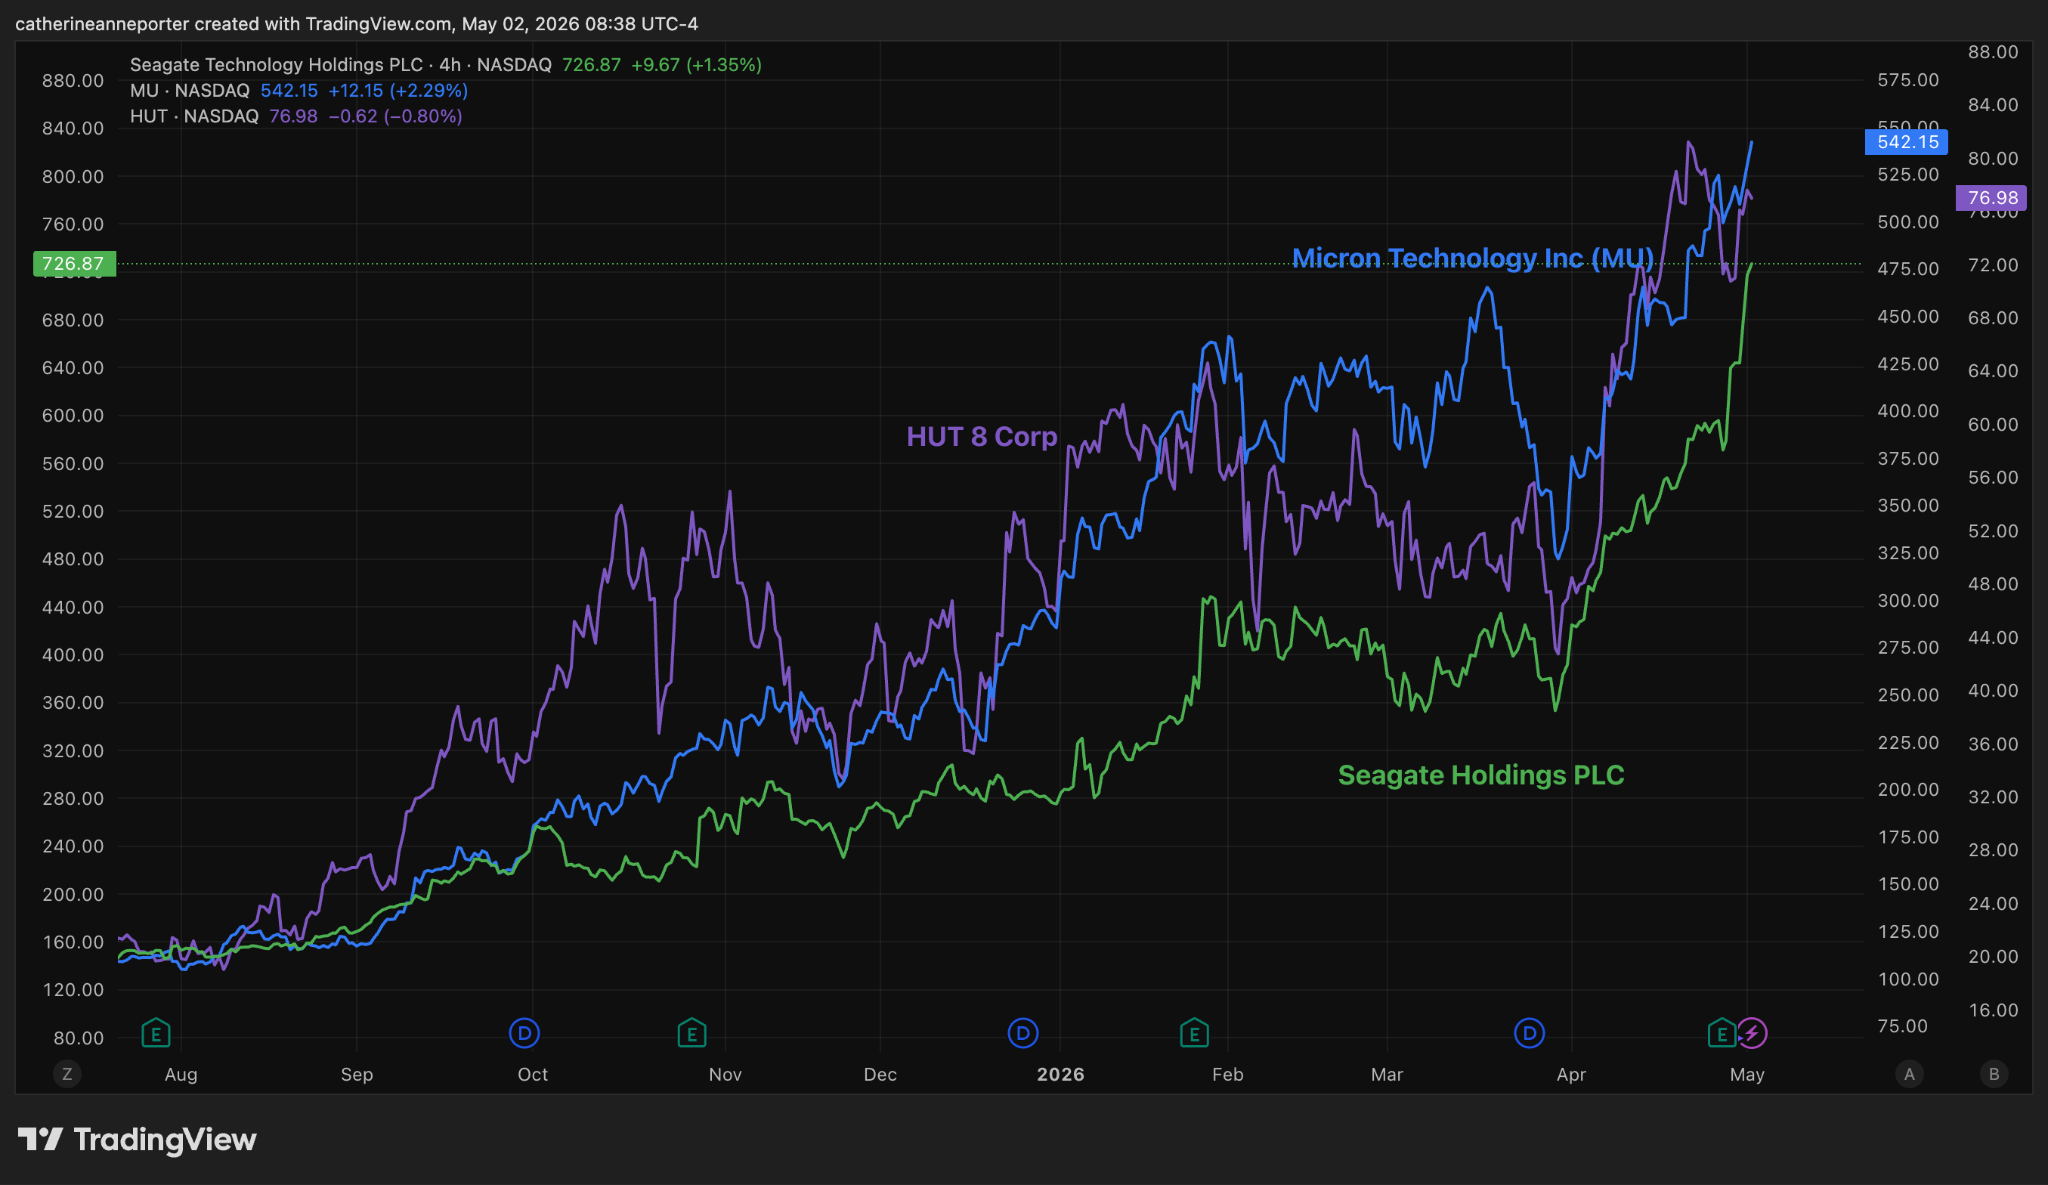
BTC accumulation by Strategy (MSTR) has dramatically outpaced bitcoin ETF inflows year-to-date, by nearly 18x, underscoring the intensified institutional preference for direct balance sheet exposure. The company’s perpetual preferred share offering, STRC, launched in July 2025, accounts for more than 50 percent of the BTC bought in the market this year, reflecting the substantial market appetite for high-yield, bitcoin-backed securities designed to mitigate price volatility. (See Figure 4 above)
In the last week, price has met resistance in the $78-79,000 band, failing to maintain much momentum above the True Market Mean at $78,400 and the Short-Term Holder Realised Price at $78,900.
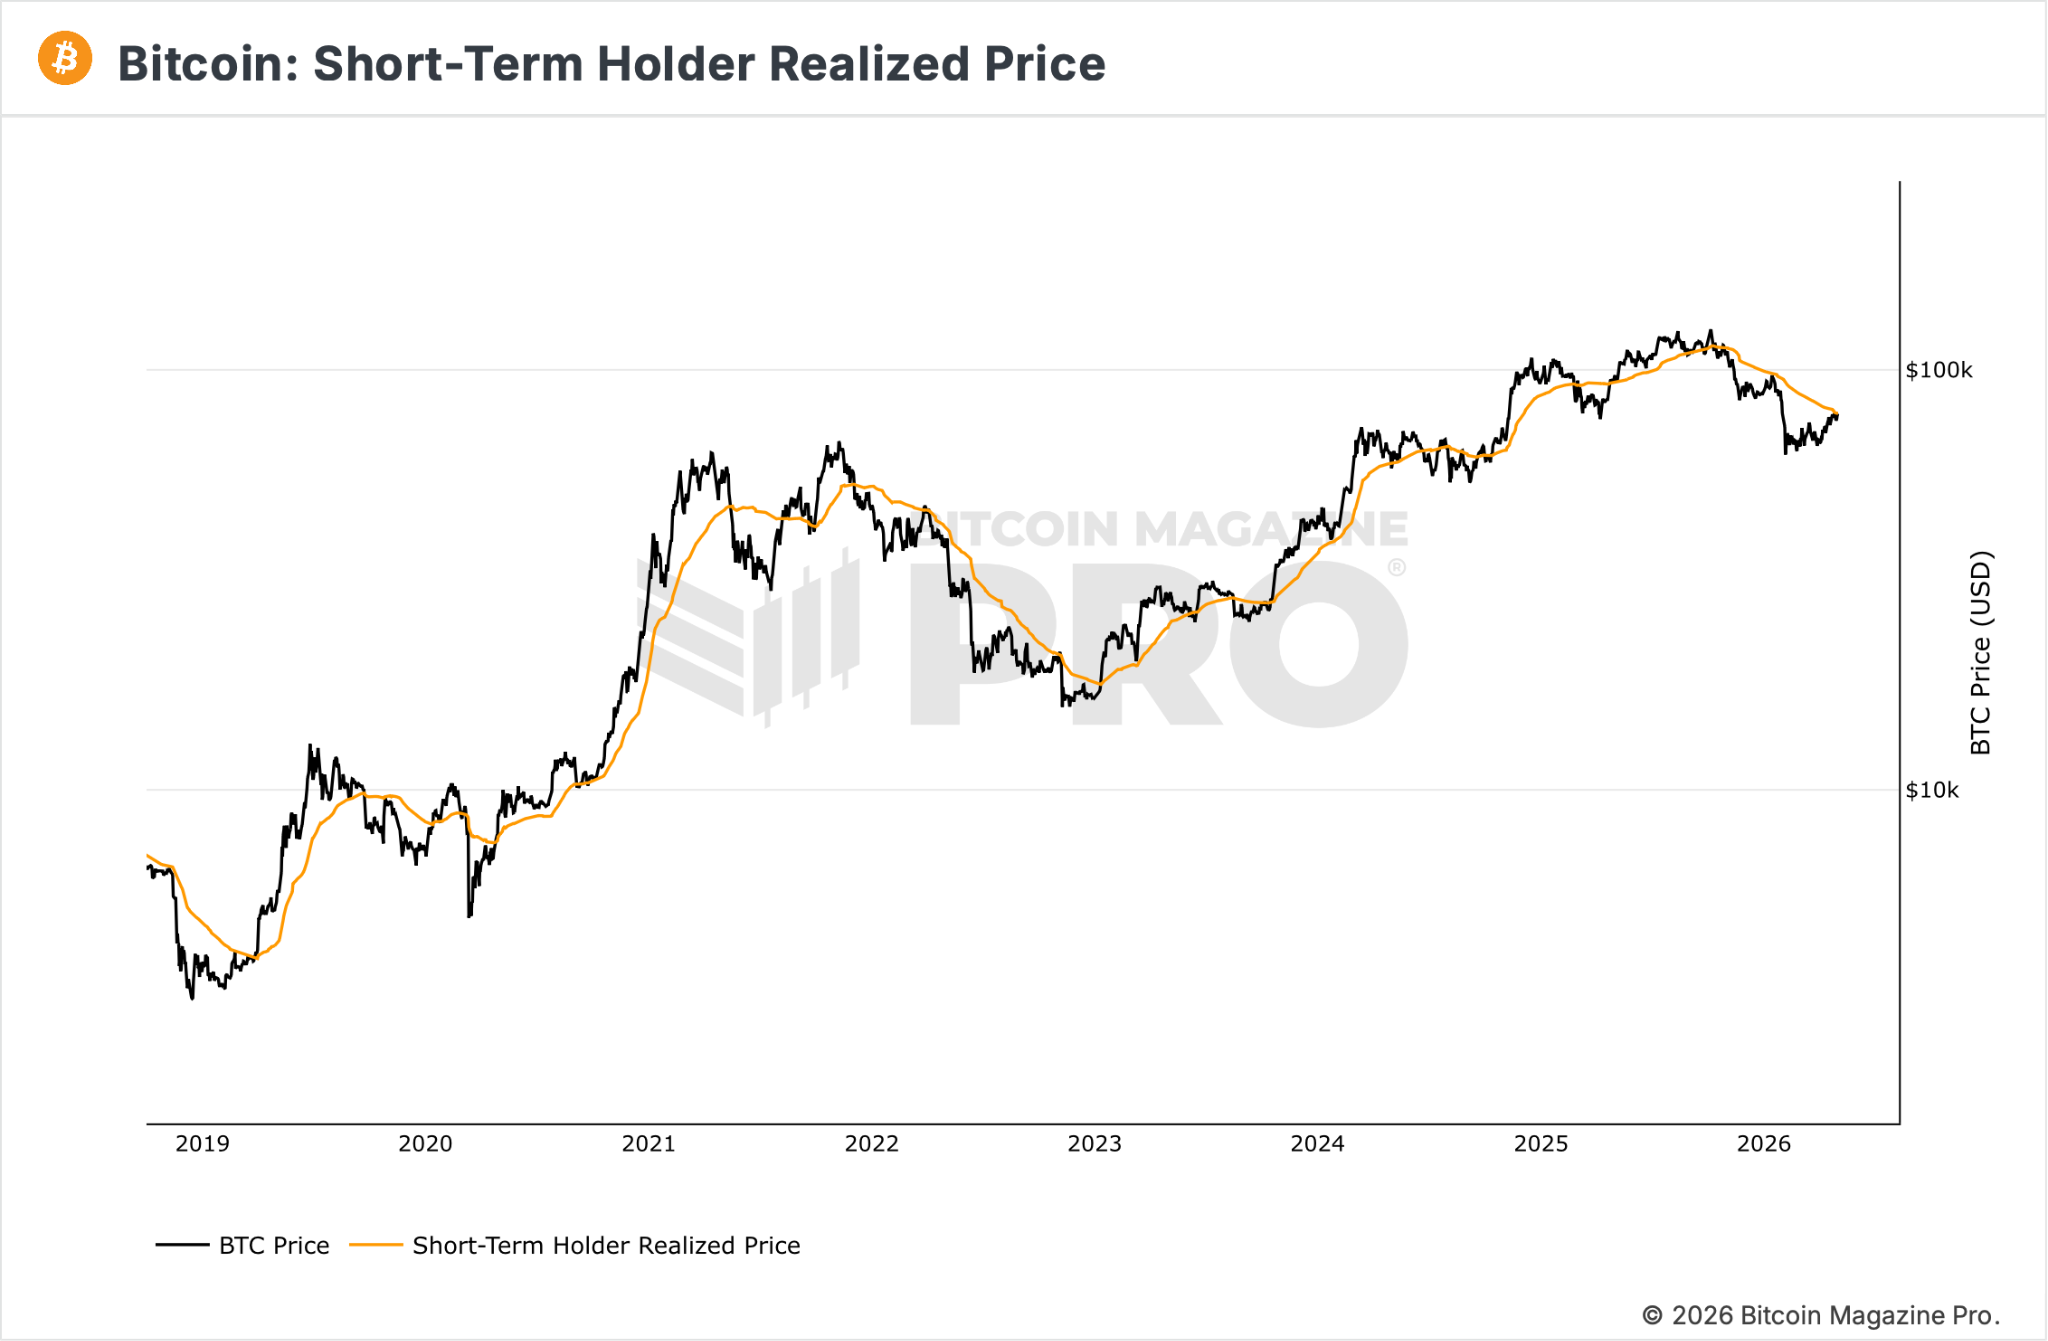
This behaviour is a textbook pattern in bear markets: whenever the price approaches the breakeven level of the most price-sensitive cohort, the incentive to exit positions overwhelms incoming demand, exhausting upside momentum. With this rejection confirming overhead resistance, the mid-term bias tilts toward further downward pressure, and attention now shifts to the -1 standard deviation band near the low $70,000s as the most immediate structural support level to monitor. However, with the ex-dividend date for STRC approaching on May 15th and potential continuation of strong ETF inflows, we believe there are odds of price breaking out from the current resistance levels at least momentarily before the next pullback occurs.

General Macro Update
Q1 Growth Held But Inflation Re-Accelerated
The US economy expanded at an annualised 2 percent in the first quarter of 2026, and the Personal Consumption Expenditures (PCE) price index re-accelerated to 3.5 percent year-on-year in March, with core PCE at 3.2 percent. Both prints landed on 30 April, the morning after the Federal Open Market Committee (FOMC) decided to keep rates on hold (covered separately here). The labour market remains resilient, inflation expectations have re-anchored higher, and the consumer is increasingly funding spending from depleting buffers rather than from real income growth. As a result, last week’s data tilts more hawkish than the policy stance currently implies, and narrows the case for the cut that markets had been pricing for June.
Q1 GDP Held At Trend
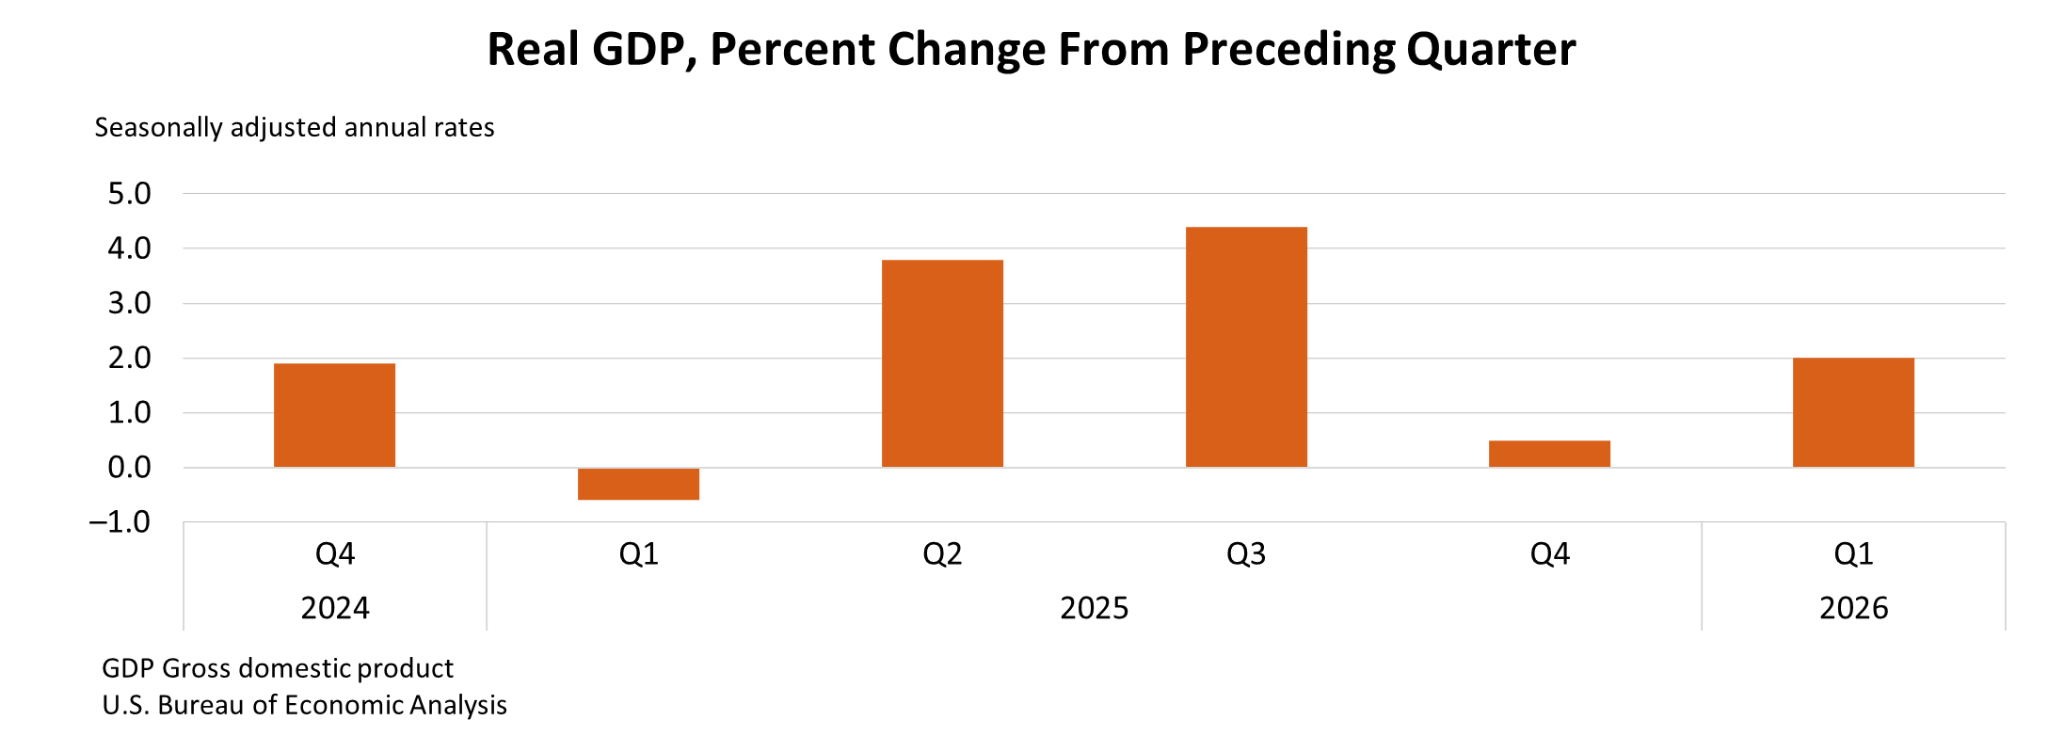
The Q1 advance estimate released by the US Bureau of Economic Analysis (BEA) showed that growth was supported mainly by household consumption and business investment, particularly in technology linked to artificial intelligence. Net Export,however reduced overall output, and housing activity weakened.
A clearer measure of underlying demand, final sales to private domestic purchasers, rose 2.5 percent, indicating that domestic activity remained stable.
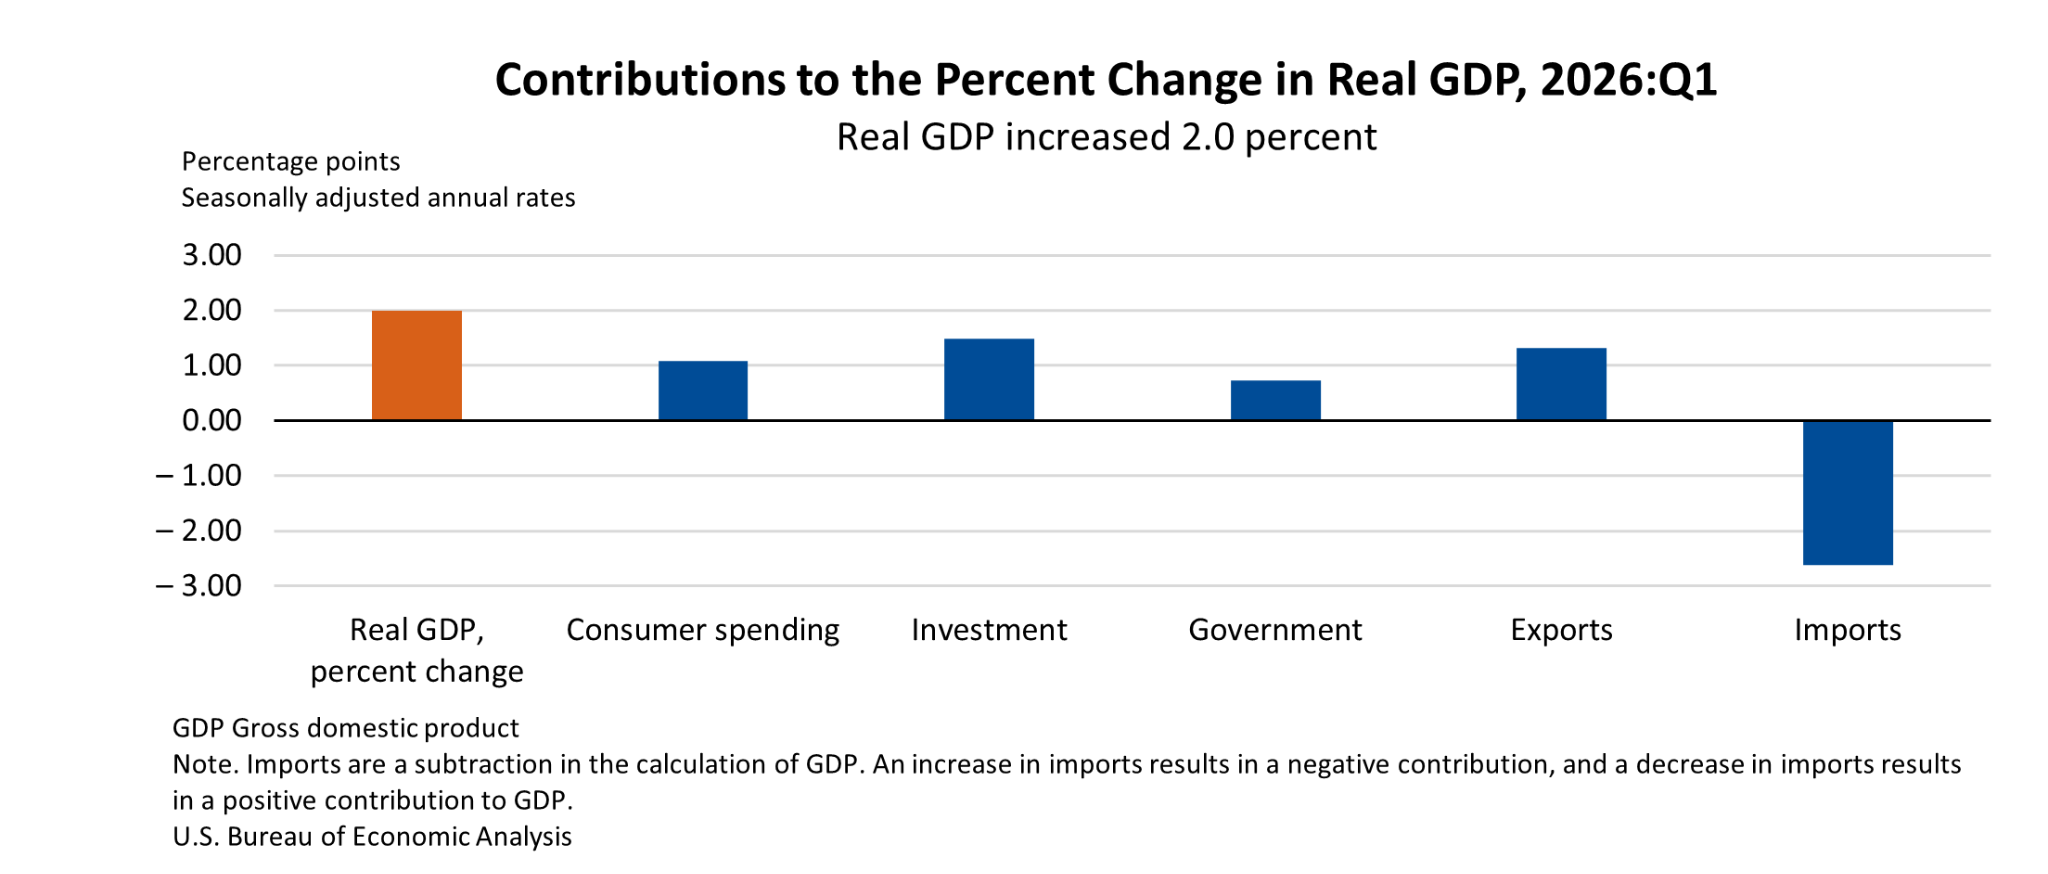

This uneven composition of Q1 growth, suggests that even though there was overall expansions, it should be interpreted more as a coincident reading of a slowing trajectory, rather than a stable one. Strength is concentrated in business investment and a narrow consumption base, while housing has now contracted for two consecutive quarters. The Atlanta Fed GDPNow tracker for Q2 has drifted lower as rising energy pass-through costs, caused by the conflict in Iran, has begun to weigh on real disposable income.
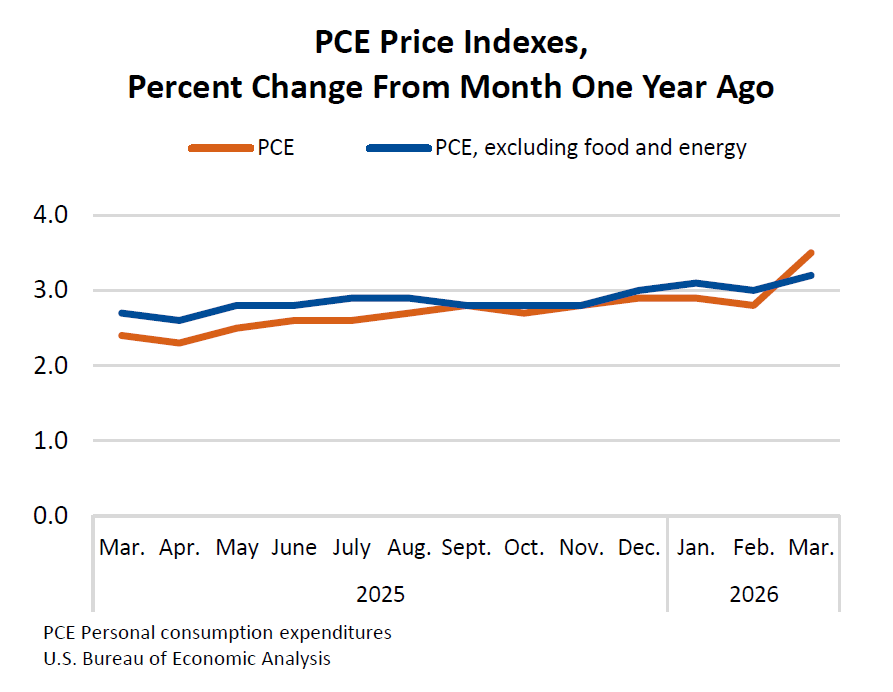
The March PCE print landed at 0.7 percent on the month and 3.5 percent year-on-year, with core PCE at 3.2 percent. The headline-core gap widened materially, a pattern consistent with a supply-driven energy shock rather than broad-based demand inflation. The proximate cause is the retail price of gasoline, which has held above $4 per gallon for most of April, with diesel above $5, against a backdrop of US-Iran-related disruptions and intermittent restrictions in the Strait of Hormuz. Crude oil has traded near $115 per barrel for much of the month.
A 3.5 percent year-on-year headline PCE reading and core at 3.2 percent is not the configuration in which the Federal Reserve should be cutting rates pre-emptively. Inflation reduces purchasing power, meaning that even when nominal incomes rise, households can afford less in real terms. This is already visible in real average hourly earnings, which rose only 0.3 percent year-on-year in March, the narrowest gain since late 2024.
The conditions raise the risk of stagflation, in which growth slows while inflation remains high. Higher oil and transport costs are expected to push inflation further, while weaker real wages reduce demand. The Fed faces a difficult policy trade-off, with the federal funds rate currently at a target range of 3.50–3.75 percent.
The Labour Market: The ‘Pillar Of The Resilience’ Thesis
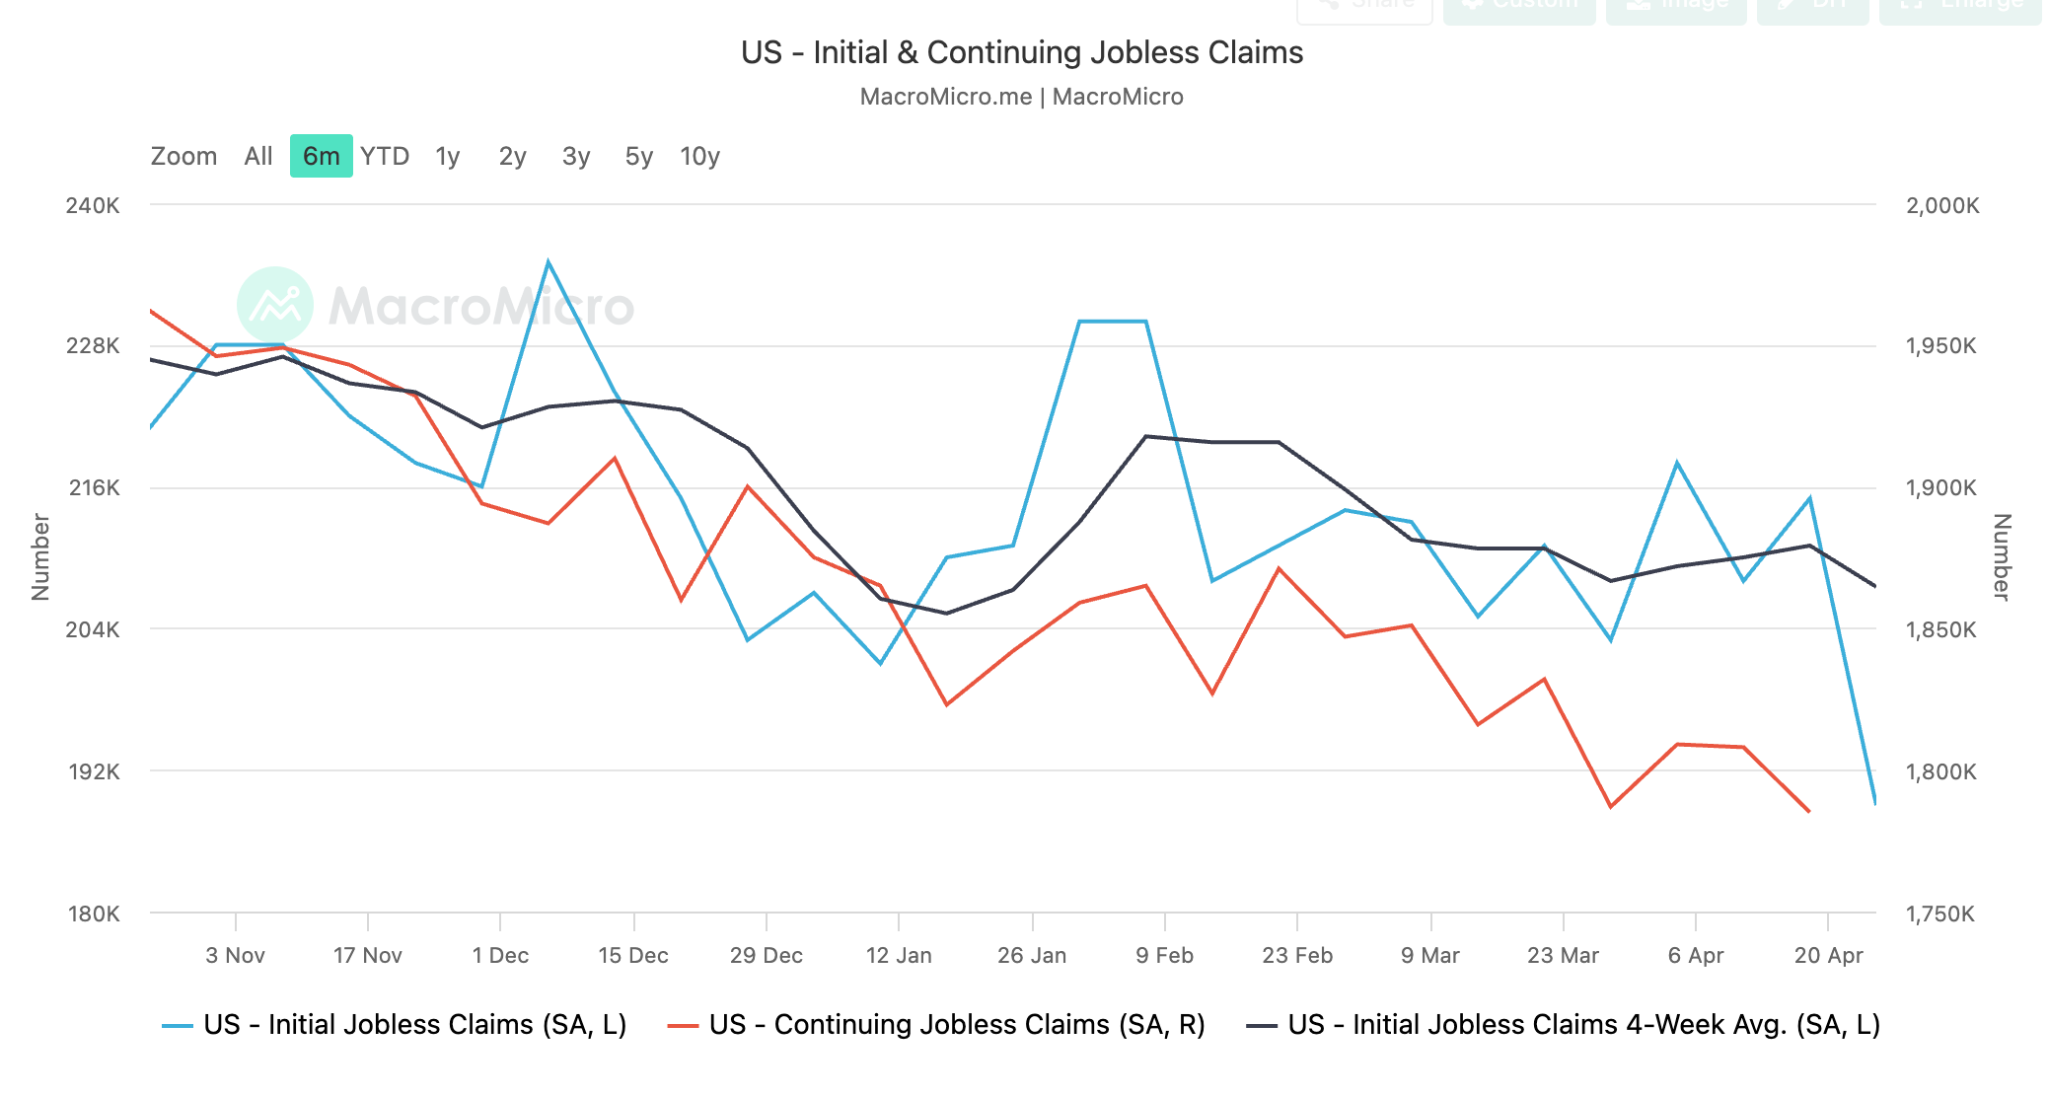
The labour market remains the single most important variable holding the resilience thesis together. The 13-week moving average of initial jobless claims tracked by the US Department of Labor sits near 214,000, indicating steady employment conditions and very low layoff activity. Nonfarm payrolls released by the US Bureau of Labor Statistics (BLS) continue to print near trend, while the Atlanta Fed Wage Growth Tracker rose to 3.9 percent in March from 3.7 percent the prior month.
Hiring has slowed materially, but firings have slowed in parallel. This “low-fire, low-hire” regime preserves income stability without acceleration: job security is intact, nominal wage gains are firm, and the income leg supports continued spending. The fragility of the regime lies in its dependence on a single pillar: labour. If the firing side begins to lift, even modestly, the offsetting buffer that has masked weaker hiring disappears quickly.
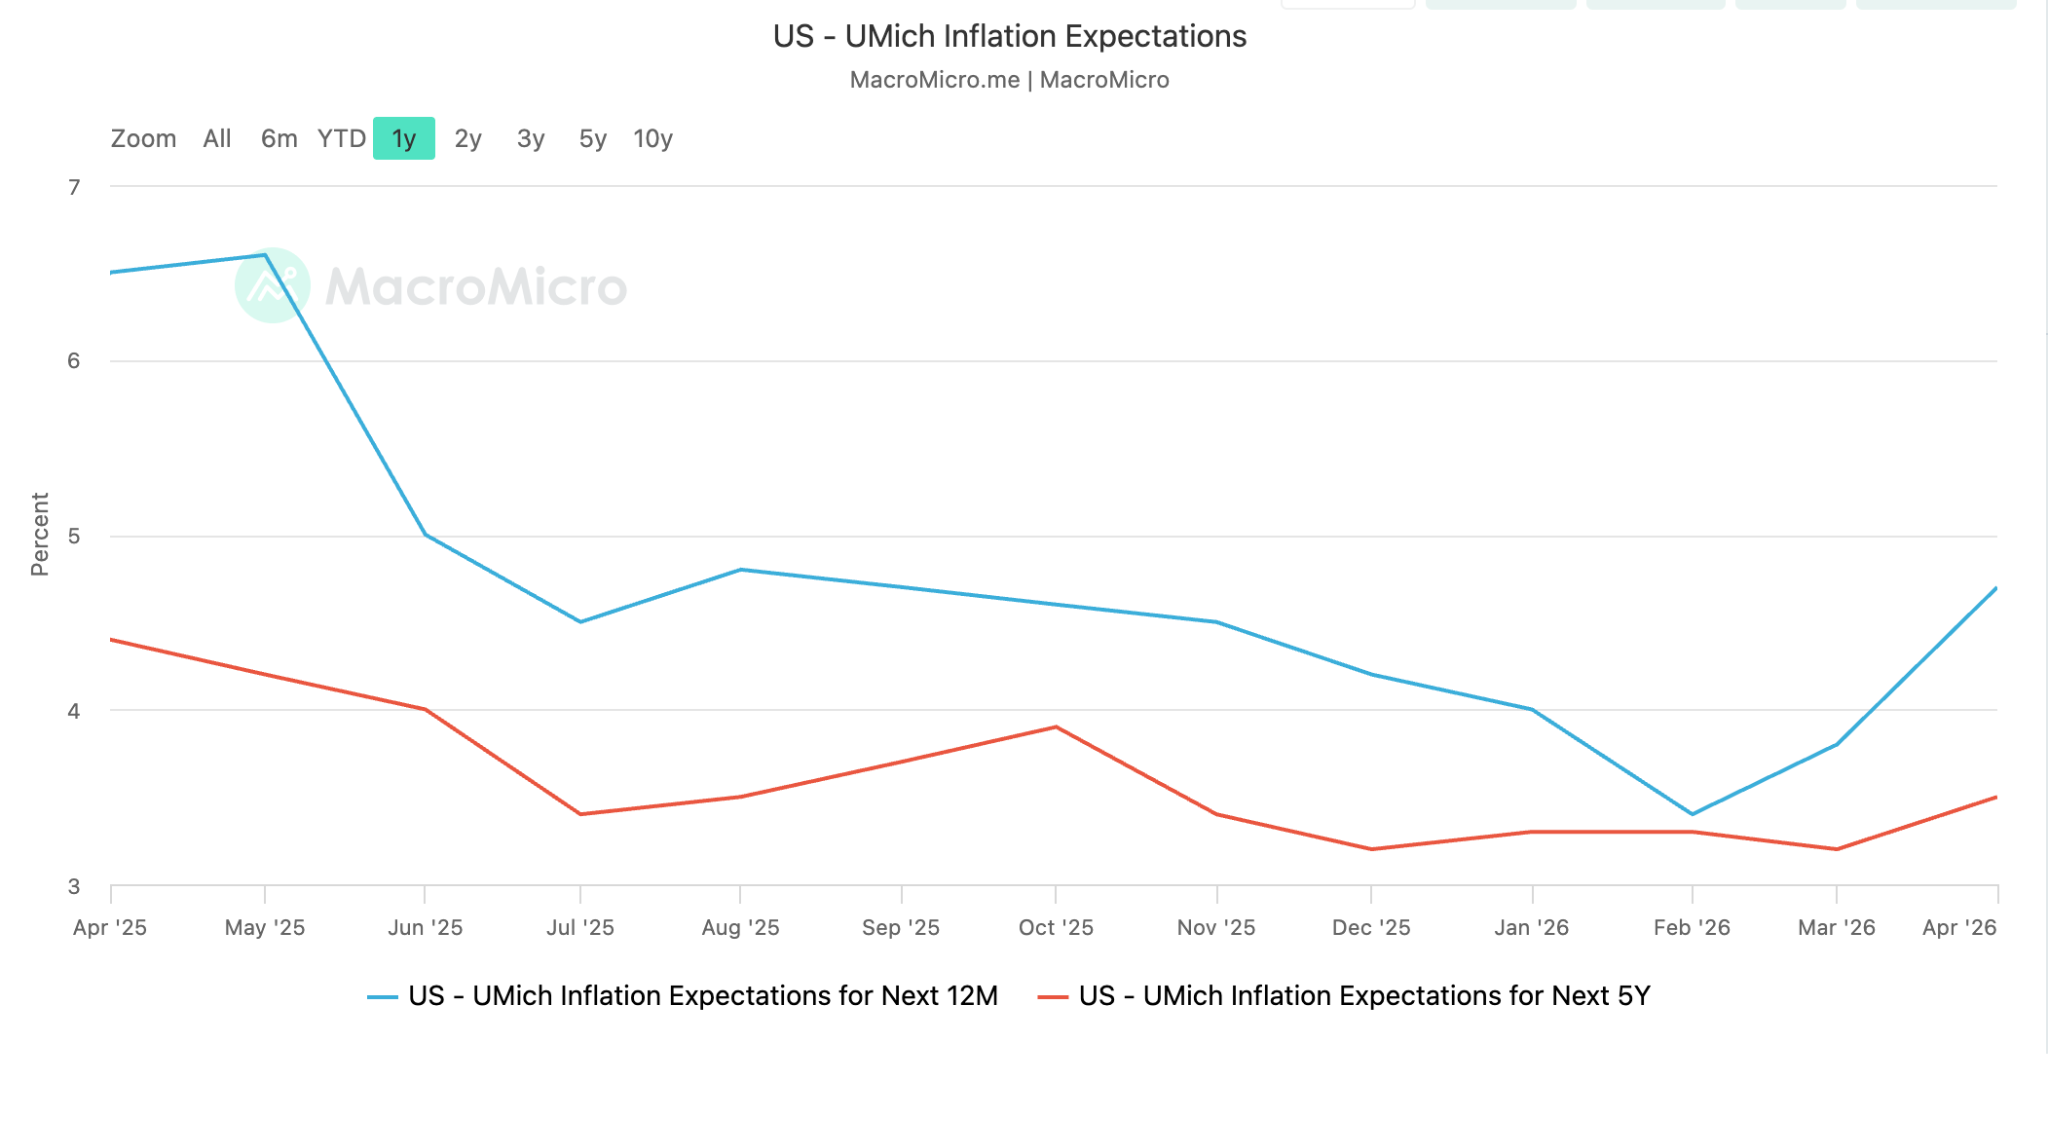
The variable that most tightly constrains Fed policy is not the level of inflation but the level of expected inflation. The University of Michigan Surveys of Consumers reported year-ahead inflation expectations at 4.8 percent in April, up from 3.8 percent in March, the largest one-month move since April 2025. More importantly, long-term (5–10 year) expectations rose to 3.5 percent, the highest reading since October 2025 after holding in a 3.2–3.3 percent range for four consecutive months.
The long-term reading is the variable current Fed Chair Jerome Powell has consistently described as the line he will not let move. A reanchoring of long-term expectations is the precondition for any sustained easing cycle; conversely, a further drift higher would compel a more hawkish stance regardless of the activity data.
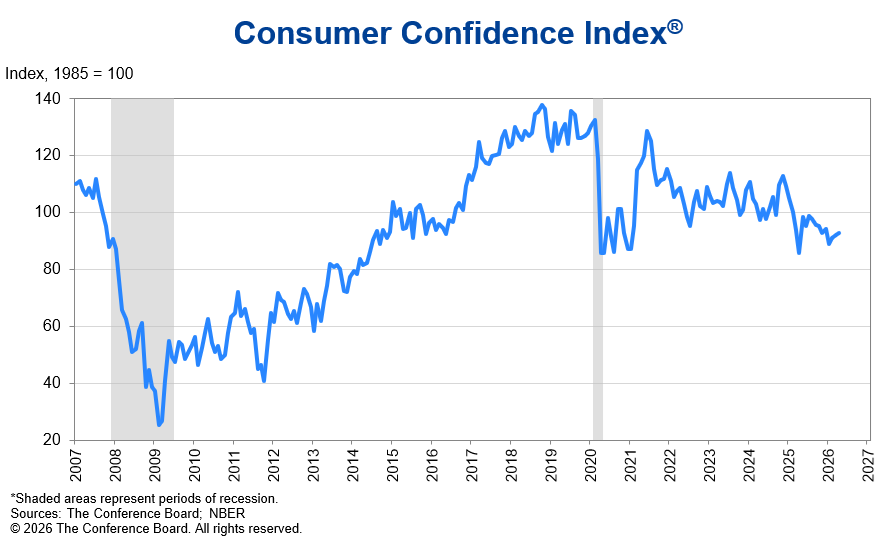
The Consumer Confidence Survey released by the Conference Board rose by 0.6 points to 92.8 in April. The improvement was supported by a temporary rise in equity markets and stable perceptions of the labour market. However, the increase appears fragile, as confidence remains below earlier levels, and the Conference Board’s accompanying 12-month inflation expectations reading sits at 5.1 percent, well above the long-run average and consistent with the findings of University of Michigan survey.
Consumer behaviour is already exhibiting signs of caution. Households are cutting back on discretionary spending such as travel, while maintaining essential purchases. Although tax refunds and a still-resilient labour market have provided short-term support, those effects are expected to fade.
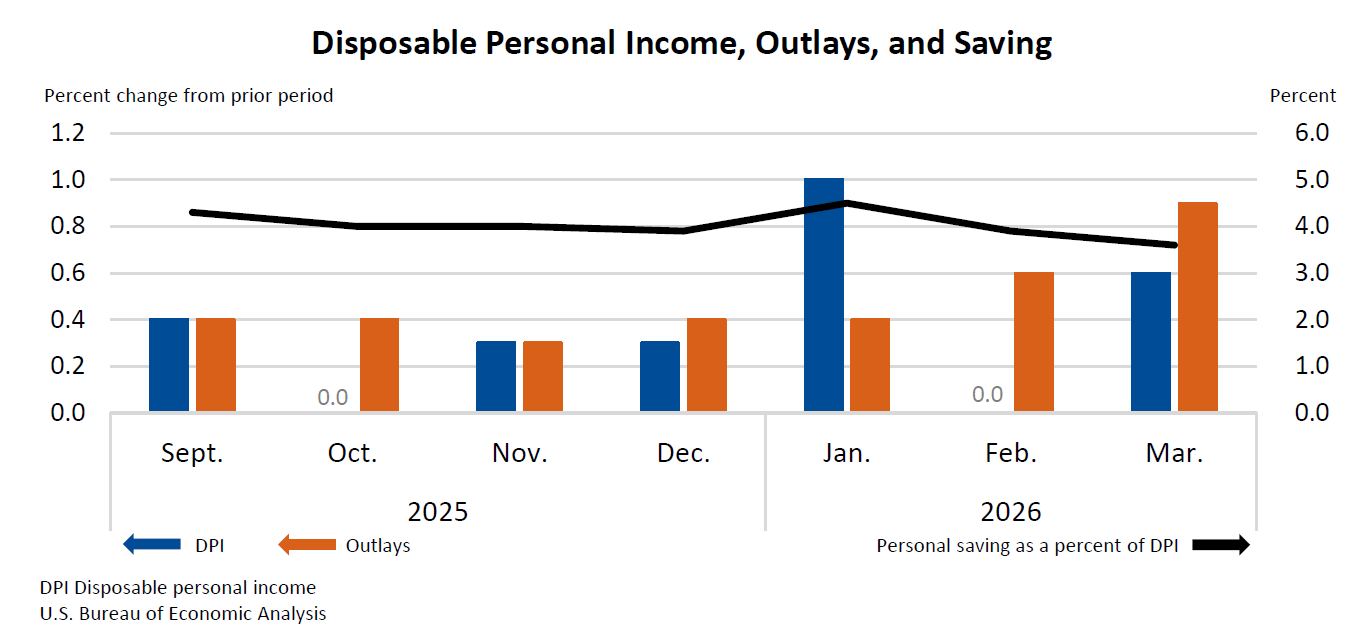
The most important shift since the start of the year is in how stable consumption is being funded. The personal savings rate released by the BEA fell to 4 percent in February from 4.5 percent in January. At the same time, total US credit card balances tracked in the New York Fed’s Household Debt and Credit Report have crossed $1.3 trillion, and the share of cardholders carrying a balance for at least a year has risen to 61 percent, up from 53 percent in late 2024.
The buffers underwriting the resilience thesis are now being actively drawn down rather than maintained. Consumption can hold under this configuration for a meaningful period, but the marginal source of spending power has shifted from a renewable resource (real income) to a depleting one (savings drawdown and revolving credit).
What We Are Watching
The leading indicators of a regime change are four second-order drivers:
The real-wage growth gap, the difference between expected price increases (4.8 percent at the University of Michigan one-year horizon) and realised nominal wage gains (3.9 percent at the Atlanta Fed Wage Growth Tracker).
The personal savings rate, currently 4 percent and trending lower.
The share of credit card balances financing essentials rather than discretionary purchases, currently estimated at over 50 percent.
Long-term inflation expectations, currently at 3.5 percent on the University of Michigan 5–10 year horizon, which is the variable the Fed treats as the anchor.
A meaningful deterioration in any one of them would not, on its own, end the resilience phase. A simultaneous move in two or more would.
Conclusion
The macro picture heading into May is firm at the headline level and fragile underneath. Growth has held, but the composition is narrowing. Inflation has re-accelerated on an energy pass-through that is structural for as long as gasoline holds above $4 per gallon. Long-term inflation expectations have drifted higher, and the consumer is increasingly funding consumption from depleting buffers rather than earned income. Taken together, the data tilts more hawkish than the policy stance currently implies, and the bar for any near-term easing is higher than markets had been pricing.

A Divided Fed Holds, And Market Reads It As Hawkish

The 29 April meeting of the Federal Open Market Committee (FOMC) delivered the policy outcome that virtually every participant had priced in: a fourth consecutive hold of the federal funds rate target range at 3.5–3.75 percent. The reaction across rates, equities, the dollar and crypto, however, was anything but neutral. The vote was the most divided of Jerome Powell’s chairmanship, the statement language was contested by three of the dissenters, and Powell used the final press conference of his term to widen the door to a more neutral policy stance later in the year. Markets priced the meeting as a hawkish hold, repricing the 2-year and 10-year Treasury curve to one-month highs and pulling Bitcoin off its highs.
The Decision: A Fourth Consecutive Hold, And A Vote That Says More Than The Rate
The Federal Reserve held the federal funds rate target range at 3.5–3.75 percent, a level it has now maintained since December 2025. The headline outcome was unanimous in direction, no member voted for a hike, but the committee fractured 8–4 on whether the policy stance the statement implied was the right one. According to the Press Release, four members dissented, the largest number of “no” votes since October 1992.
The composition of the dissent matters more than the count. Governor Stephen Miran dissented in favour of an immediate 25 basis point cut, arguing that the slowdown in real wage growth and the deterioration in consumer expectations justify a more pre-emptive easing. The other three dissents, from Cleveland Fed President Beth Hammack, Minneapolis Fed President Neel Kashkari, and Dallas Fed President Lorie Logan, came from the opposite direction. All three supported holding rates steady but objected to the statement retaining an easing bias. In effect, three of the four “no” votes came from regional presidents who did not want the document to imply that the next move was more likely to be a cut than a hike.
A 3-1 split among dissenters is rare and strategically informative. It tells the market that the disagreement is no longer about the level of rates, it is about the direction of the next move, and that the Fed’s hawks have grown numerous enough to challenge the document itself rather than just the policy decision.
The 30 April data prints that landed the morning after the meeting, tightened both sides of this disagreement: GDP growth holding at 2 percent supports keeping rates on hold, but March PCE re-accelerating supports taking a more hawkish view.
The Statement Versus The Press Conference: An Easing Bias That Powell Has Already Diluted
The statement, taken in isolation, is mildly dovish in posture. It retained the easing bias and acknowledged that “developments in the Middle East are contributing to a high level of uncertainty about the economic outlook,” language that connects directly to the energy pass-through caused by higher oil prices. On its own, that wording would have been read as the committee preparing the ground for a cut at the June meeting.
Powell, however, used the press conference to dilute the statement’s signal. He confirmed that the number of committee members who could support shifting the language toward a more neutral stance, where a hike is as likely as a cut, has increased over the inter-meeting period. He framed the risks as “two-sided” rather than tilted toward easing, and declined to provide forward guidance on what the outcome of the June FOMC could be. Crucially, this is also Powell’s final meeting as Chair, and his term will end on 15 May, after which his nominated successor, Kevin Warsh will become chairman. However, Powell confirmed he intends to remain on the Board of Governors for a period to be determined.
These combined signals are therefore narrower than the statement alone suggests. The official document says the next move is more likely down than up. The departing Chair says, in plain language, that the committee is closer to neutral than the statement implies. The market took the second reading. It is worth noting what was not in the meeting. April is not a Summary of Economic Projections (SEP) meeting, so there was no fresh dot plot. The relevant reference therefore remains the March 18 SEP, in which the median view is for one 25 basis point cut by year-end 2026, with the 2026 PCE inflation projection at 2.7 percent and real GDP growth at 2.4 percent. The dispersion around that median has tightened upward between December and March, as a “meaningful” number of officials move toward fewer cuts before the April vote. The April dissents are best read as a continuation of that drift rather than an isolated event.
The Rates Reaction: A Curve That Repriced Higher At Both Ends
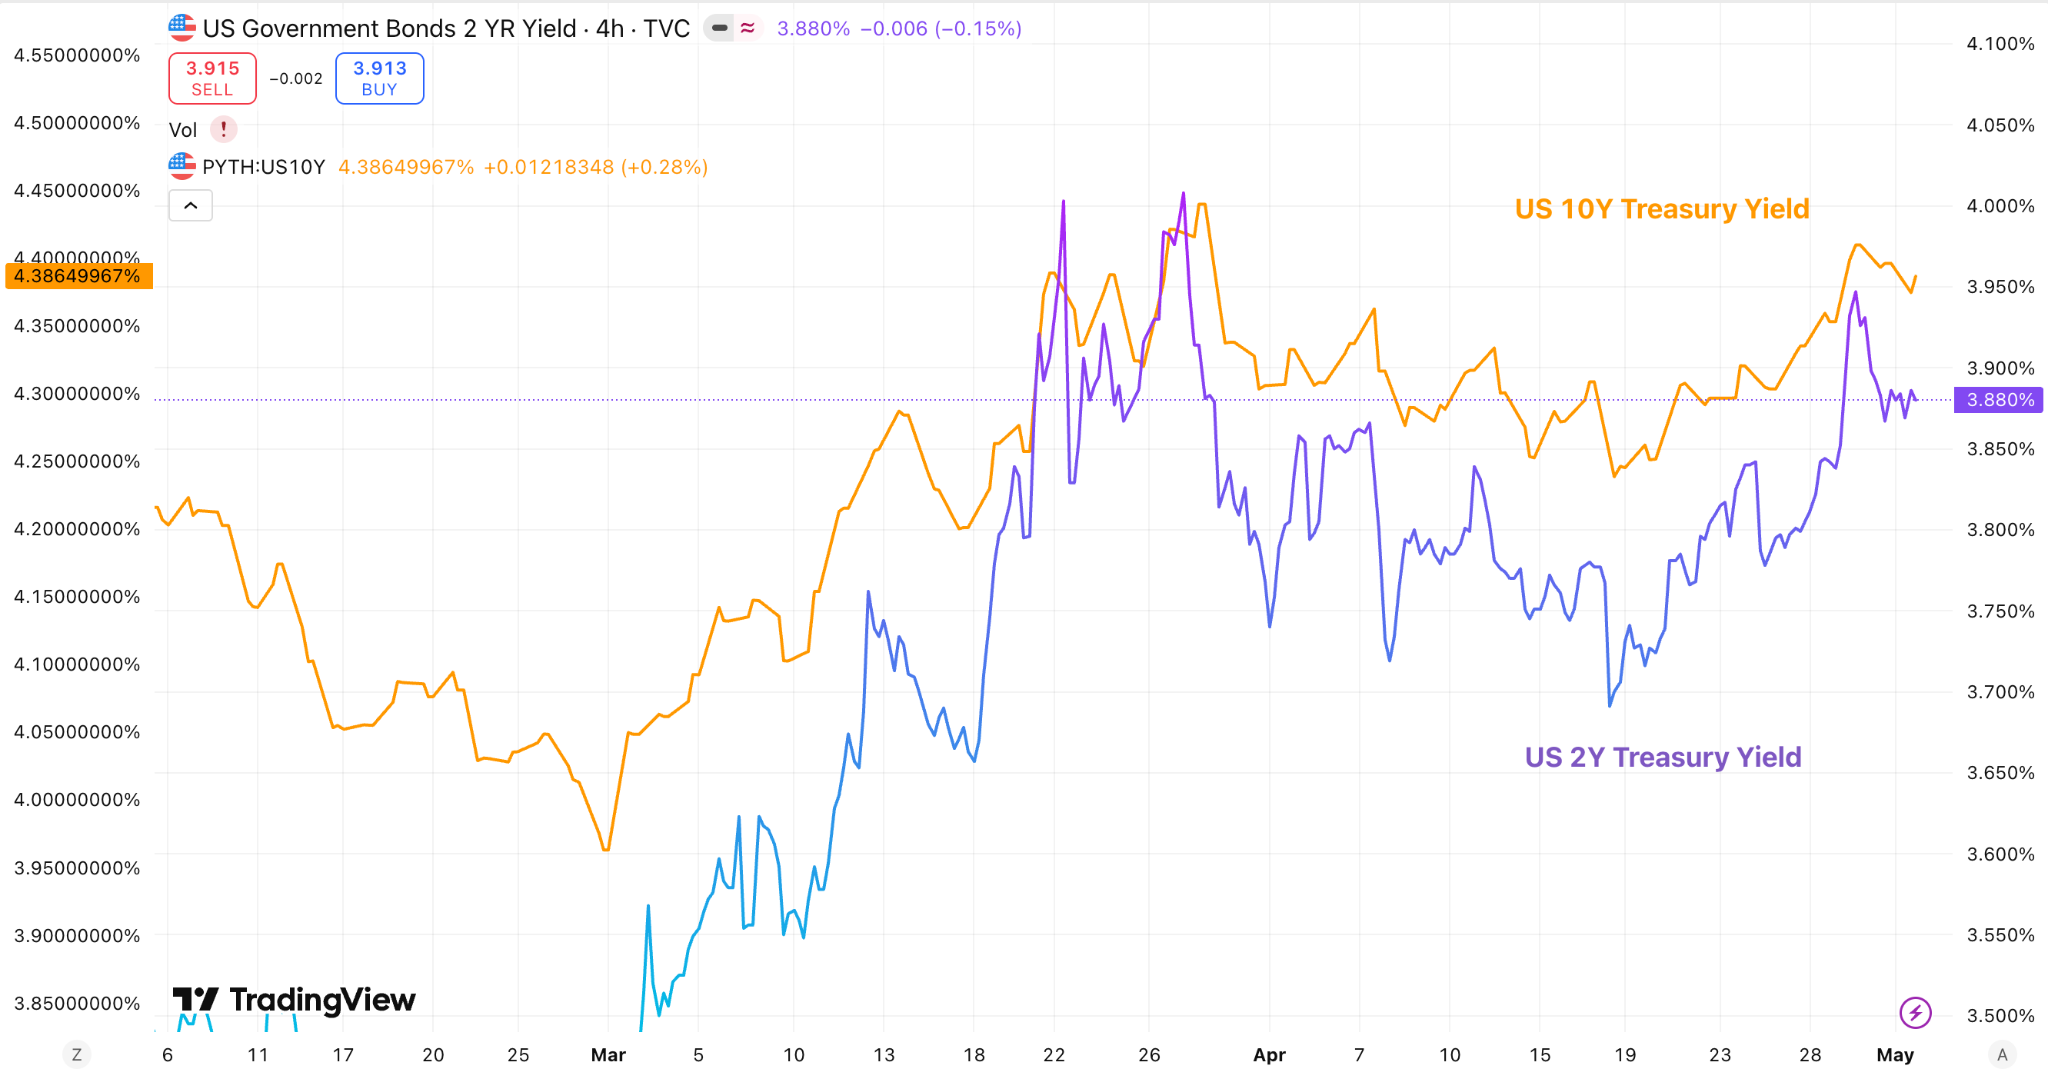
The 2-year Treasury yield closed at 3.94 percent, a one-month high, after entering the day below 3.85 percent. The 10-year Treasury yield similarly pushed up to 4.42 percent, also a one-month high. A bear flattener (which is the phenomenon when short-term rates rise faster than long-term rates, causing a narrowing of the spread) of this magnitude on a “no change” decision is unusual, and is precisely the curve shape that the dissent composition predicts. Front-end yields rose because three of the four dissenters wanted the easing bias removed, lifting the implied policy floor. Long-end yields rose because the inflation-expectations channel as seen in the University of Michigan and Conference Board surveys, reinforced rather than offset the dovish statement.
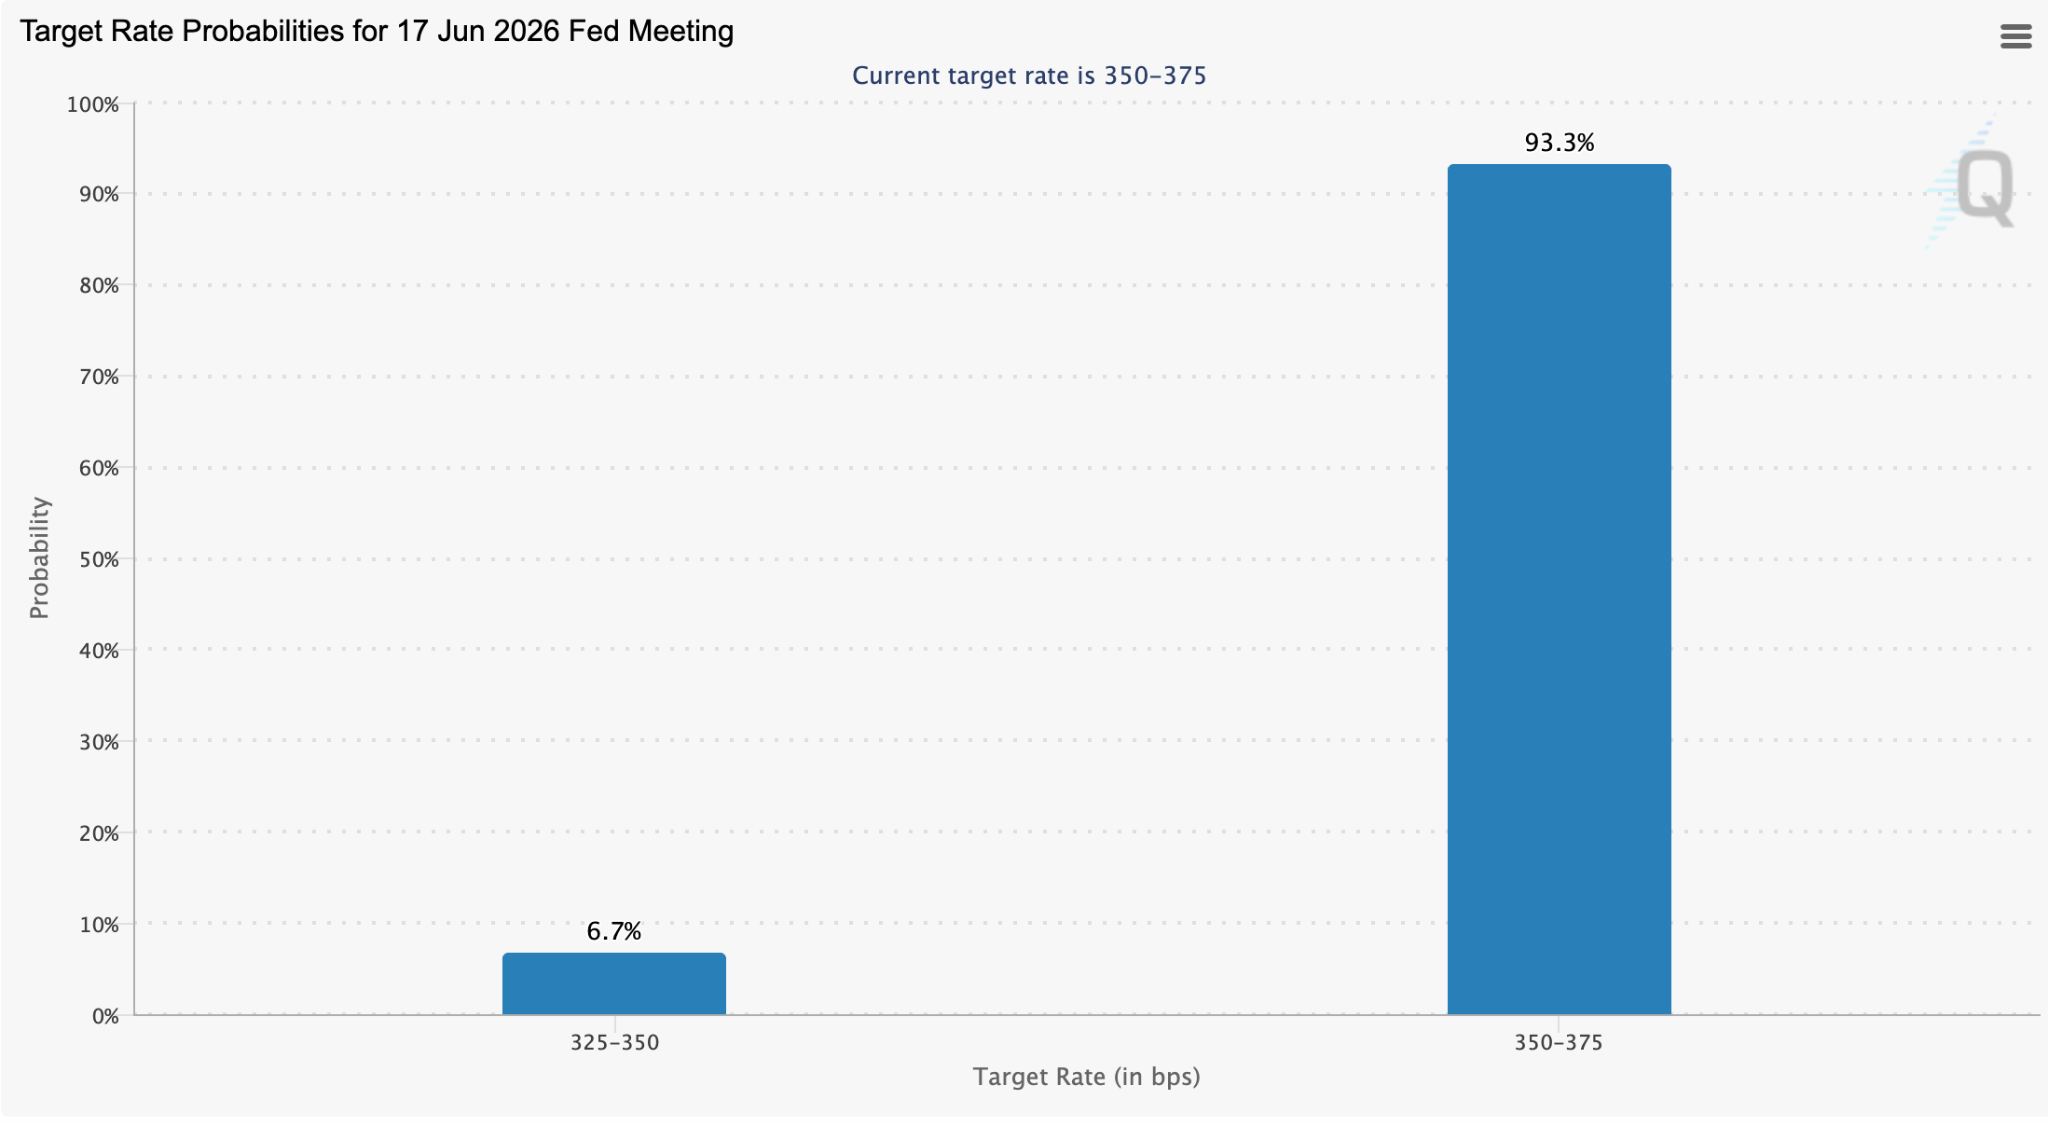
Fed funds futures repriced in the same direction. According to the CME FedWatch tool, the implied probability of a 25 basis point cut at the June meeting compressed materially over the session, while the implied path for the year-end 2026 fed funds rate moved higher across the strip. Traders did not abandon the cut path entirely, but they pushed the timing further out and raised the bar for the size of the eventual move. The 30 April PCE re-acceleration extended the move higher in front-end yields, confirming the bear-flattening read.
The signal from rates, then, is unambiguous: the market has read an 8–4 vote, with three dissenters pushing back against the easing language, as a stronger hawkish revision than a hold at 3.50–3.75 percent on its own would have produced.
Equities: A Mixed Tape That Hides A Defensive Rotation
The headline equity reaction was modest and mixed. The Dow Jones Industrial Average closed lower by 280 points, or 0.57 percent and the S&P 500 fell 0.04 percent last Wednesday. Beneath the index level, the more informative move was the rotation: rate-sensitive sectors (utilities, real estate investment trusts, regional banks) underperformed materially, while large-cap technology held the tape in the green. This is the textbook equity response to a hawkish surprise on the rates side combined with continued earnings strength concentrated in the megacap, AI-linked cohort that has driven the index for most of 2026.
The implication is consistent with the broader thesis: equity beta is increasingly held up by a narrow set of names whose cash flows are insulated from a higher-for-longer rate path, while the rate-sensitive segments of the market re-priced down on the meeting. A 0.04 percent move on the S&P obscures more dispersion than it reveals. The Dollar And Gold: Confirmation Of The Hawkish Hold
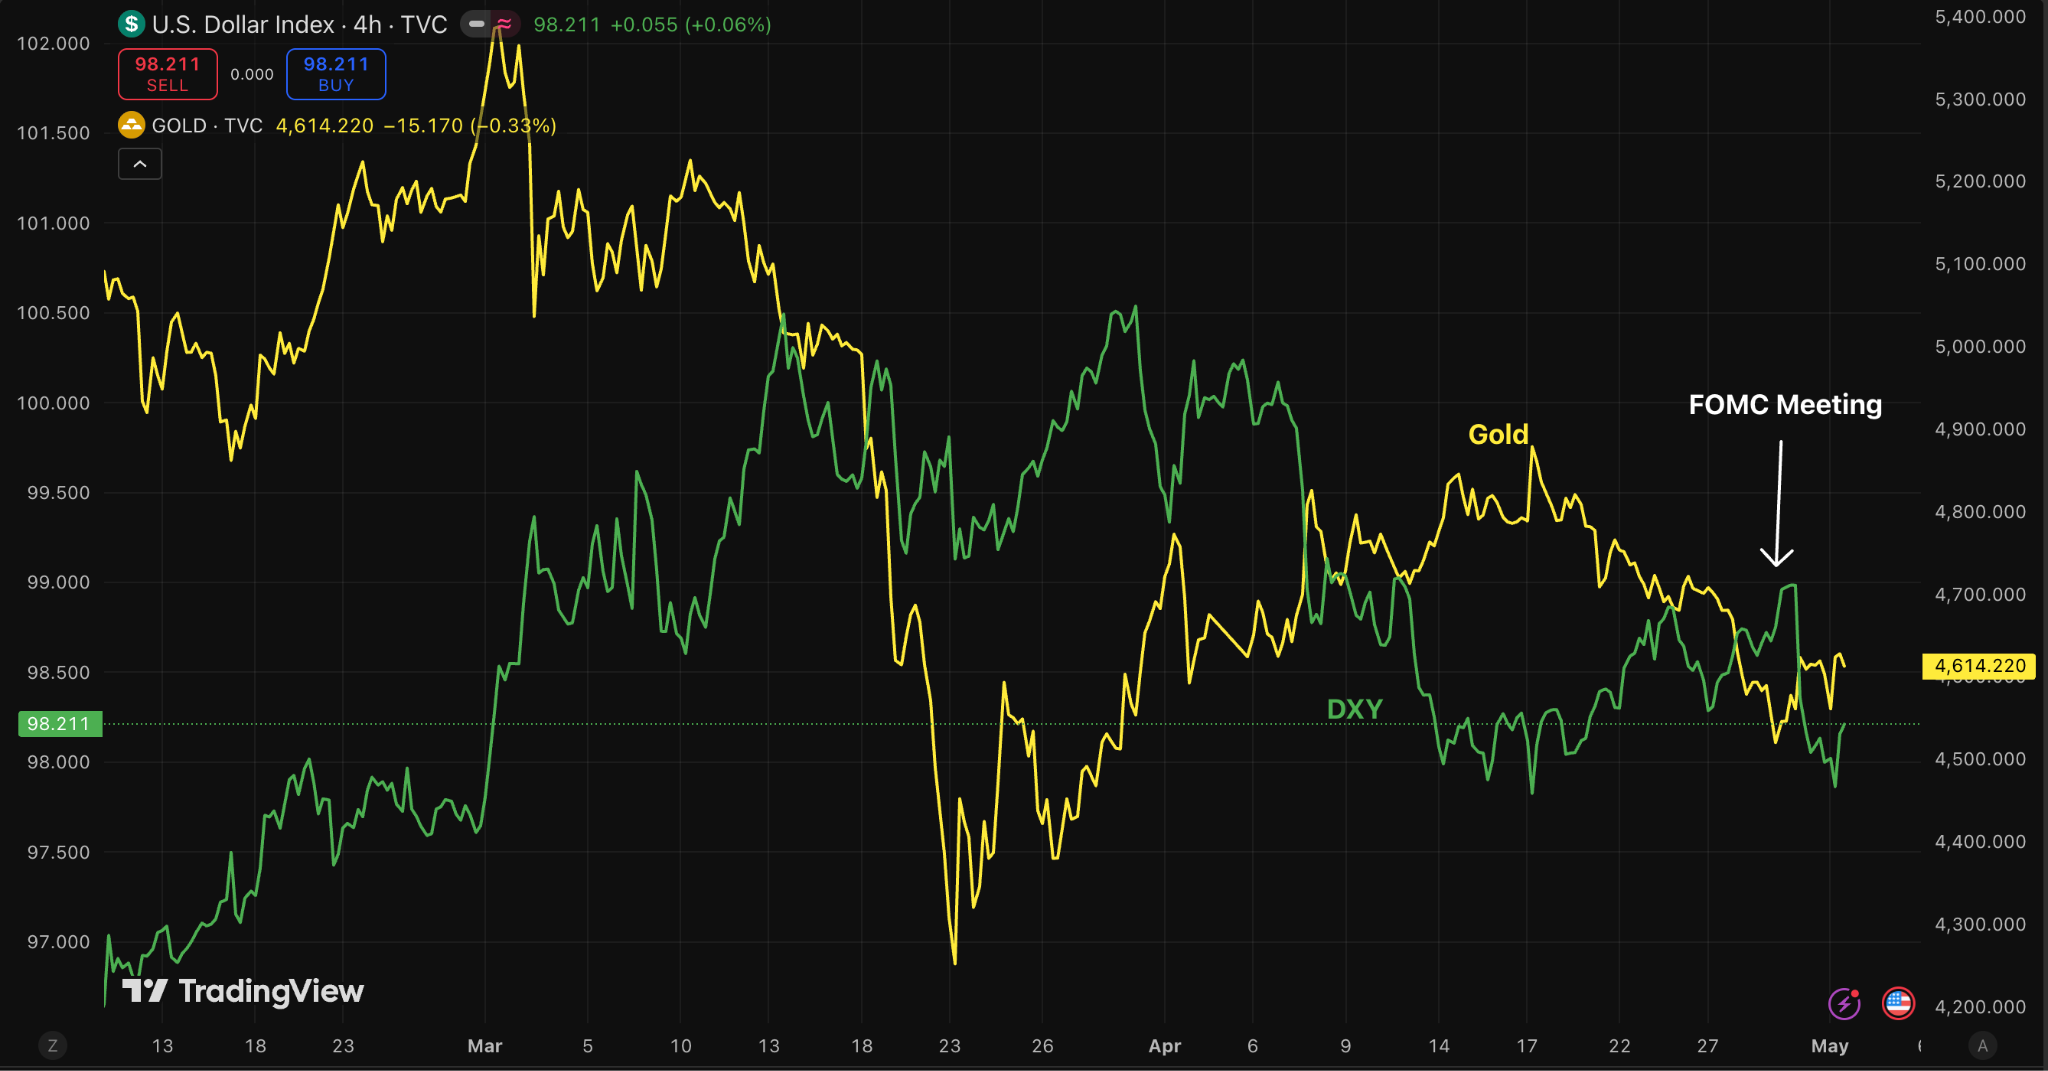
The US Dollar Index rose 0.3 percent on the day of the FOMC announcement, consistent with a higher-for-longer rates outlook and a widening rate differential against the euro and yen. Gold, as proxied by the SPDR Gold Shares (GLD) exchange-traded fund, traded down 0.6 percent in early Wednesday action to $419.34, with the underlying LBMA AM gold price fix also softening.
The combination of a stronger dollar and weaker gold on a Fed day is the cleanest market-based test of whether the meeting was read as hawkish or dovish: both moves point in the same direction: hawkish.
The gold move is particularly informative given the macro setup. With energy still feeding into headline inflation and geopolitical risk in the Middle East unresolved, gold should have absorbed bid on the day. Instead, the rate-channel and dollar-channel effects dominated, indicating that the hawkish reading of the meeting was strong enough to override the inflation hedge bid that has supported gold for most of the cycle.
The committee is no longer drifting quietly toward a June cut. It is actively divided, with the median position closer to neutral than the statement language suggests, and a hawkish bloc that has grown numerous enough to push back against the document itself.
The departing Chair has confirmed in plain language that this drift is real, the incoming Chair, Kevin Warsh, is widely viewed as more open to a hike than a cut if inflation expectations fail to reanchor, and the next SEP at the June meeting will land in front of a market that has now repriced the front end of the curve to its highest level in a month.
The market response, higher front-end yields, a stronger dollar, weaker gold, weaker bitcoin, lower rate-sensitive equities, is consistent across asset classes and points to a single conclusion: the meeting is being read as a hawkish hold, not a dovish pause. For risk assets, the implication is that the bar for the next leg higher is no longer set by inflation surprising to the downside, it is set by the committee surprising to the dovish side. After 29 April, that is a higher bar than the market entered the day with.
Conclusion
The 29 April FOMC meeting was, in form, a non-event: rates were held, the statement was largely unchanged, and no SEP was released. In substance, it was the most consequential meeting of Powell’s chairmanship. A four-member dissent, the largest in more than three decades, combined with a press conference that explicitly diluted the statement’s easing bias, has shifted the implied policy path to the hawkish side at exactly the moment the macro data is asking for accommodation. Markets agreed in real time.
The next test is the June meeting, which will deliver a fresh dot plot, a new set of staff projections, and a chair-elect waiting to take over on 15 May. Between now and then, the question is no longer whether the Fed cuts in June. It is whether the macro crosscurrents can converge fast enough to give the committee a reason to do so. On 29 April, eight of twelve voting members made clear that they are not yet convinced.
News From the Cryptosphere
White House Signals Strategic Bitcoin Reserve Update

A senior White House crypto adviser said the Trump administration is preparing a “big announcement” within the next few weeks regarding the US Strategic Bitcoin Reserve, suggesting the initiative may soon move from symbolic policy to operational execution. The comments came from Patrick Witt, executive director of the President’s Council of Advisors for Digital Assets, during the Bitcoin 2026 conference in Las Vegas.
According to Witt, the administration has spent recent months working through the legal and technical framework required to properly consolidate and safeguard Bitcoin already held on the US government balance sheet. He said officials believe they have achieved “a bit of a breakthrough,” implying internal barriers around custody, authority, or interagency transfer mechanics may have been resolved.
The Strategic Bitcoin Reserve was originally established through executive action in March 2025 and was expected to be funded primarily by Bitcoin obtained through criminal and civil asset forfeitures. Estimates place US government holdings at hundreds of thousands of BTC, making it one of the world’s largest sovereign Bitcoin holders. The upcoming announcement could clarify how those holdings will be centralized, managed, audited, or potentially expanded.
Witt also emphasised that executive action alone is not enough, and long-term durability would require legislation. That aligns with ongoing efforts in Congress to codify the reserve into law through updated Bitcoin reserve bills.
For markets, this matters because a formalised US Bitcoin reserve would represent a historic shift: Bitcoin moving from seized contraband asset to recognized sovereign reserve instrument. Even if no immediate purchases are announced, clearer custody structures or statutory backing could strengthen the narrative of Bitcoin as geopolitical money.
If the administration eventually authorises active accumulation rather than passive holding, the signal effect could be even larger, potentially influencing other nation-states, pension systems, and treasury managers to reassess Bitcoin’s role in strategic reserves.

Brazil Tightens Control on Cross-Border Payments, But Excludes Crypto

Brazil’s central bank, Banco Central do Brasil, has moved to exclude cryptocurrencies from regulated cross-border payment channels, reinforcing its push to consolidate international transfers within the formal foreign exchange (FX) system.
Under Resolution No. 561, cross-border transactions must now be processed either through traditional FX mechanisms or via Brazilian real-denominated accounts held by authorised foreign counterparties. Digital assets, including stablecoins, are no longer permitted within this regulated structure.
The decision does not prohibit crypto usage outright. Instead, it removes digital assets from the official payments framework, signalling a clear policy direction: cross-border flows should remain within monitored and regulated financial channels.
This development aligns with Brazil’s broader regulatory trajectory. As crypto adoption, particularly stablecoins, has expanded, authorities have introduced tighter oversight. In late 2025, virtual asset service providers were required to secure operating licences and comply with financial-sector standards covering governance, cybersecurity, and anti-money laundering. These rules formally came into effect in February, with a transition period for compliance.
Additional policy actions reinforce this stance. Authorities have recently halted discussions on crypto taxation reforms and restricted access to certain offshore prediction platforms, citing investor protection concerns. Despite increasing regulation, Brazil remains a key market in the global crypto landscape. It ranks among the top adopters worldwide, with usage heavily concentrated in stablecoins, which account for the majority of domestic crypto flows.