

Issue #202:
BTC Surges but Consolidation Likely
Bitcoin at a Crossroads: Recovery Meets Resistance Near $80K
Bitcoin is attempting a structural recovery, reclaiming last week the True Market Mean near $78,300 for the first time since mid-January, and signalling a shift from deep bearish conditions toward a more neutral regime. This move has been supported by one of the strongest institutional demand phases of the year, with $2.1 billion in spot ETF inflows over eight consecutive sessions and continued corporate accumulation, most notably through Strategy’s aggressive Bitcoin purchases. Bitcoin has also shown relative strength versus equities, reinforcing the presence of a sustained spot bid rather than purely derivatives-driven price action.
Despite this improvement in structure, the market is now approaching a critical inflection point. Price remains capped below the Short-Term Holder cost basis near $80,000, a level that has consistently acted as resistance so far this year. At the same time, on-chain dynamics show rising realised profits, with short-term holders aggressively taking gains as price approaches breakeven zones. This behaviour, combined with supply from investors who accumulated in the $60,000–$70,000 range, is creating significant overhead resistance and limiting the ability for price to transition into a sustained breakout.
Derivatives and volatility positioning further reinforce this cautious outlook. Implied volatility continues to compress across the curve, even as price trends higher, signalling a lack of urgency and limited conviction among market participants. The combination of strong institutional inflows, rising sell-side pressure, and muted volatility suggests that the current move is more consistent with absorption than expansion. As a result, the path of least resistance in the near term is likely consolidation or a pullback toward the $75,000 region, with a decisive break above $80,000 required to confirm a more durable bullish regime.

US consumer resilience remains intact at the surface level, with spending and employment continuing to support near-trend growth, but underlying conditions are becoming increasingly fragile as rising energy, food, and housing costs compress real incomes and erode discretionary capacity. Retail strength, partly driven by temporary factors such as tax refunds and potential demand pull-forward, masks a more structural imbalance in which stable employment is doing the majority of the work in sustaining consumption. This “low-fire, low-hire” labour market dynamic preserves income stability but leaves the system highly sensitive to any deterioration in employment conditions, particularly as housing costs remain a persistent and inflexible burden that continues to crowd out spending flexibility.
That fragility is now transitioning into a more defined ‘squeeze economy’ regime, where the issue is no longer whether consumers are spending, but how that spending is being financed. Inflation expectations have sharply repriced higher, with sentiment collapsing to historic lows, while real wage growth has failed to keep pace with anticipated price increases, widening the gap between income and cost of living. As a result, consumption is increasingly supported by credit expansion and savings drawdowns rather than organic income growth, a shift that is inherently unsustainable over longer horizons. The macro implication is a constrained policy environment in which the Federal Reserve must balance weakening real demand against rising inflation expectations, limiting its ability to ease and reinforcing a stagflationary backdrop that favours hard assets while increasing downside sensitivity to further shocks.
Against this macro backdrop, regulatory developments in digital assets reflect a broader convergence between traditional finance and blockchain-based systems, beginning with the United Kingdom’s move to integrate stablecoins and tokenised deposits into a unified payments framework. By bringing these instruments within formal regulatory oversight and aligning them with existing financial infrastructure, UK authorities are effectively positioning digital assets as an extension of the current system rather than a parallel alternative. Expanded oversight from the Financial Conduct Authority and investment in tokenised market infrastructure signal a strategic intent to lead in programmable finance, while reducing regulatory fragmentation that has historically slowed institutional adoption.
At the same time, stablecoin infrastructure itself is evolving toward deeper integration with sovereign enforcement mechanisms, as demonstrated by Tether’s record $344 million USDt freeze in coordination with US authorities. The scale and coordination of the action underscore the extent to which centralised issuers can exert control over blockchain-based assets, embedding compliance directly into digital financial rails. This dynamic reinforces the hybrid nature of modern crypto markets, where transparency and decentralised settlement coexist with issuer-level intervention, effectively transforming stablecoins into programmable instruments that align closely with regulatory and enforcement frameworks.
Russia’s latest legislative developments further illustrate how states are selectively integrating crypto within controlled parameters, with a newly approved bill establishing a state-supervised framework that recognises digital assets as property while prohibiting their domestic use as payment. The strategic exception allowing cross-border crypto settlements highlights a targeted use of blockchain infrastructure to bypass external financial constraints, particularly in the context of sanctions and restricted access to global payment systems. Taken together, these developments reflect a broader global trend in which digital assets are not being adopted in a purely decentralised form, but are increasingly incorporated into existing economic and geopolitical structures, shaped by regulatory control, monetary sovereignty, and strategic necessity.

Market Signals
Bitcoin Attempts to Expand
Bitcoin reached a high last week of $79,480, staying below the Short-Term Holder Realised Price of $80,100, a barrier that has capped every single rally so far this year.
However, BTC again outperformed equities and saw $2.1 billion in net spot ETF inflows over eight consecutive sessions through April 23, the cleanest institutional bid since February.
Furthermore, the rise of BTC through the True Market Mean at $78,300, a first since mid-January, signals a structural mean reversion from prior distribution.
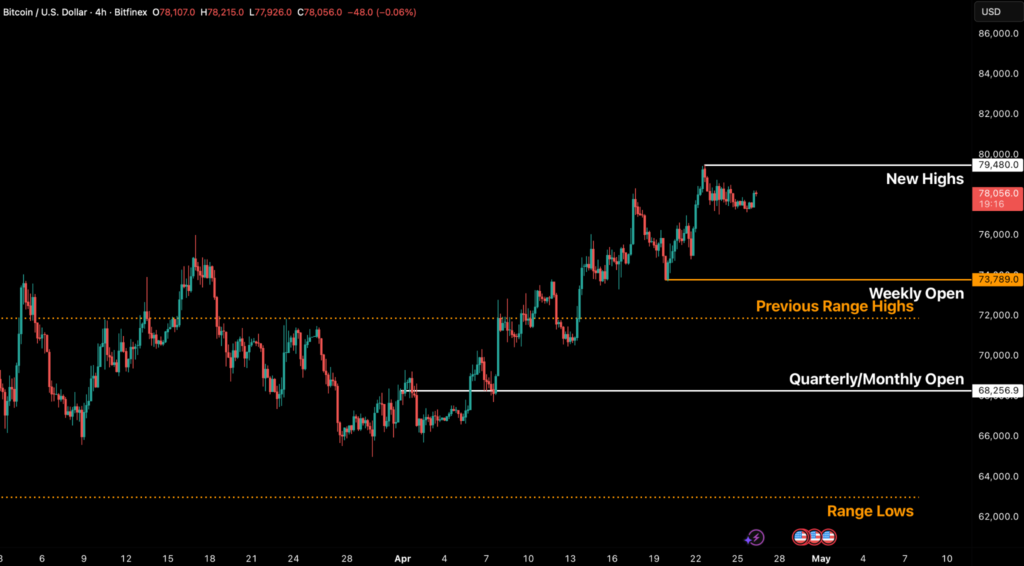
Figure 1: BTC/USD 4H Chart. (Source: Bitfinex)
The True Market Mean Price (TMMP), which reflects the average acquisition cost of digital assets over time, excluding profit realisation by miners, is a key metric for evaluating market positioning. The more specific Active Value to Investor Value (AVIV) Ratio, which isolates investor profit from miner activity, serves as a crucial gauge for market saturation. Its current proximity to “1” (the mean threshold) suggests the price is nearing a neutral, aggregate on-chain breakeven point. This level is poised to act as significant resistance should the current higher-timeframe downtrend persist.
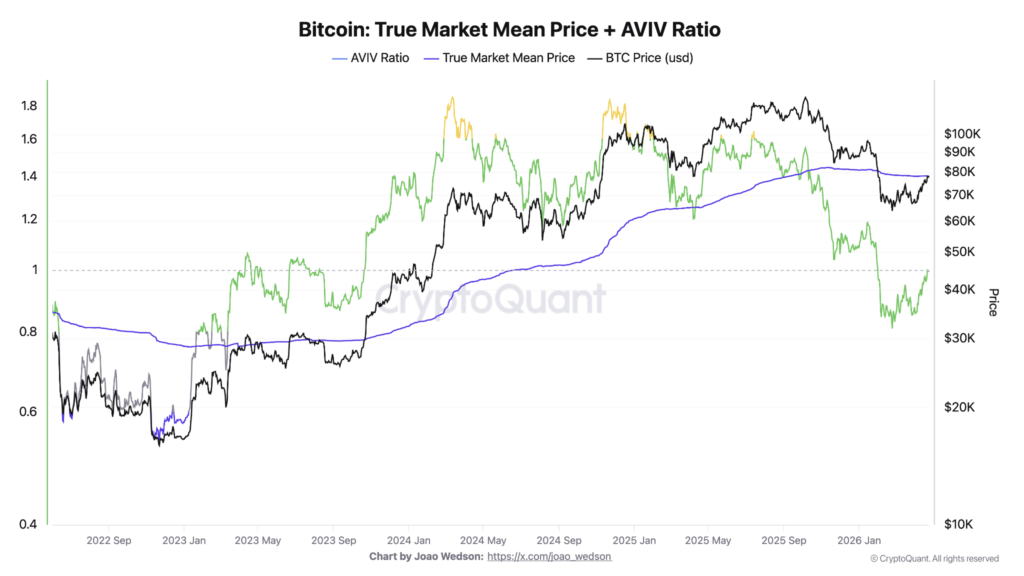
Figure 2: Bitcoin’s True Market Mean. (Source: CryptoQuant)
The reclaim of the True Market Mean, which tracks the cost basis of actively transacted supply, is a historically significant event, often signalling a shift from deep bear market dynamics towards a more constructive market regime. This breakout represents a substantial mean reversion within the ongoing bear cycle, targeting the Short-Term Holder Cost Basis at approximately $79,900 as the next logical upside objective.
Nevertheless, the upward momentum is being tempered by rising sell pressure. Investors who accumulated supply in the $60,000–$70,000 range are now nearing their cost basis, facing a strong behavioural incentive to realise a breakeven exit. This dynamic significantly increases the probability of a local price ceiling forming in the near term, thus giving us a more cautious view of the market, despite the encouraging breakout above the True Market Mean.
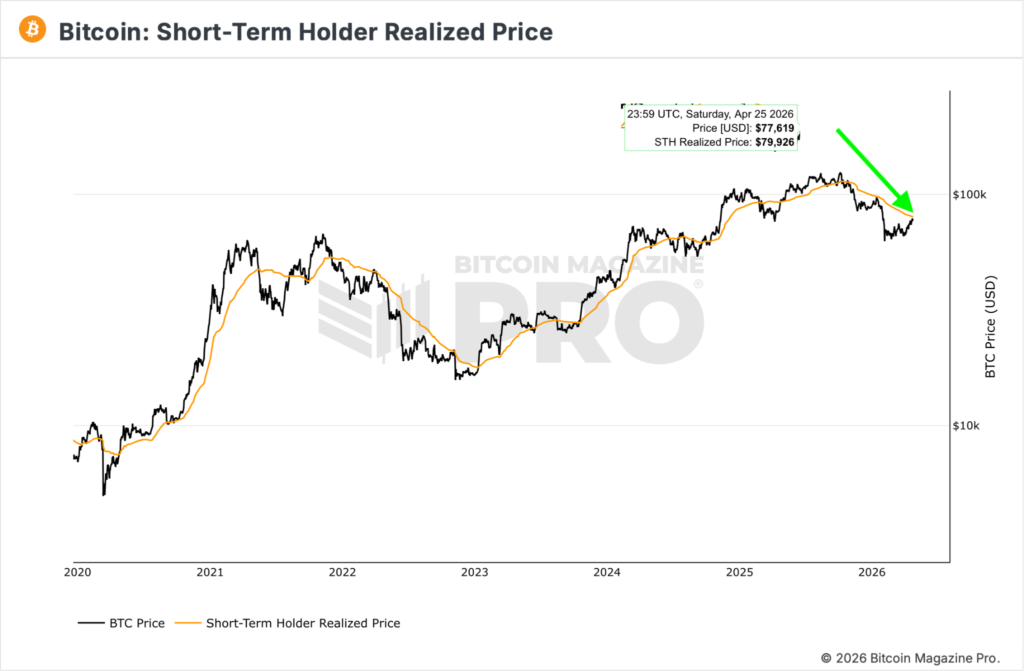
Figure 3: Bitcoin Short-Term Holder Realised Price.
(Source: BitcoinMagazinePro)
STH RP Presents a Significant Barrier to Price
The Short-Term Holder Realised Price (STH RP) currently presents the immediate technical hurdle (See Figure 3 above). This price level represents the aggregate cost basis for all coins acquired within the past 155 days and has historically functioned as a significant overhead supply when approached from below. A sustained daily close above this $80,000 threshold would shift more than 54 percent of recent market participants into profit.
Notably, this precise level has, throughout the current cycle, proven to be the point at which distribution pressure has effectively quelled previous relief rallies, marking the second such critical juncture in this cycle.
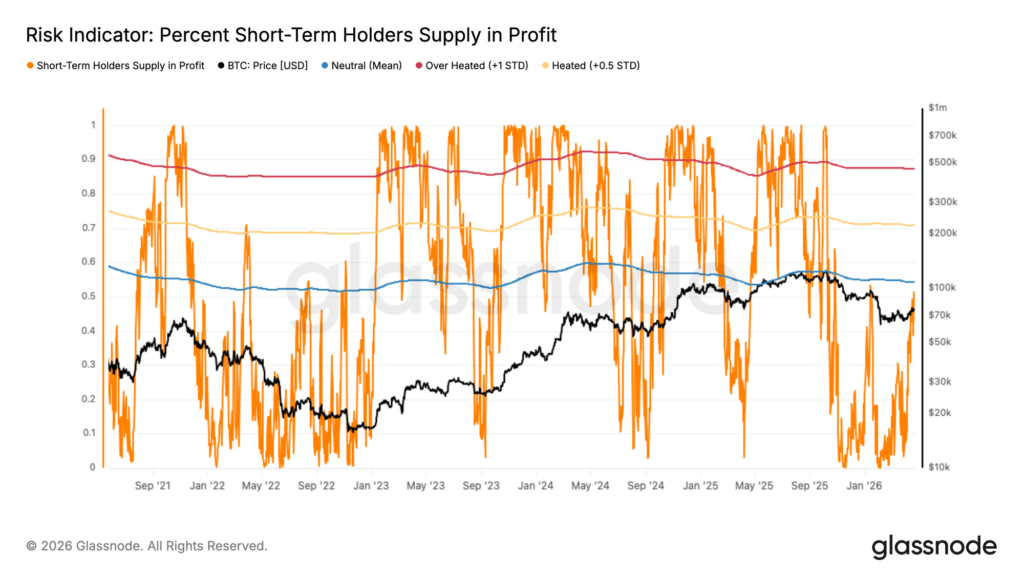
Figure 4: Bitcoin Short-Term Holders Supply In Profit. (Source: Glassnode)
Concurrent with this, the Short-Term Holder Realised Profit metric has sharply escalated to $4.4 million per hour. This figure is nearly three times the $1.5 million threshold that has consistently delineated every local market top year-to-date. This surge represents the most compelling cautionary signal within the current market structure, aligning precisely with cohort behaviour observed at every preceding 2026 local peak. Consequently, the data suggests that, heading into the upcoming FOMC week, markets will favour a phase of consolidation or even a technical retest of the $75,000 level, before any sustainable acceptance above $80,100 can be convincingly established.
ETF Demand Remains Solid
Spot Bitcoin ETFs exhibited robust institutional interest last week, recording an eight-day consecutive net inflow streak totaling $2.1 billion through April 23rd (See Figure 5). The week of April 20–24 alone absorbed approximately $823.7 million across five sessions. Notably, BlackRock’s IBIT alone captured $710 million of the week’s net total.
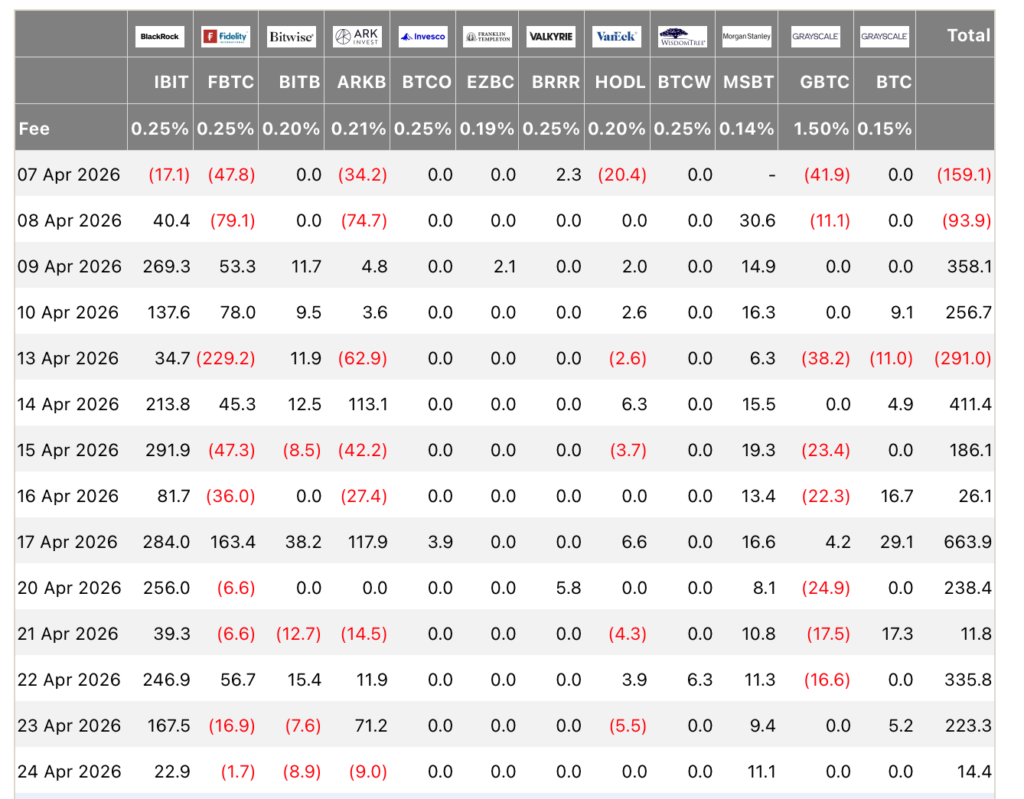
Figure 5: Spot Bitcoin ETF Net Flows Across All Providers.
(Source: FarsideUK)
Inflows on April 22 are particularly significant, as they represent the largest single-session net inflow in the week and took place as the oil market deteriorated. This confluence of events provides the clearest evidence that unconditional institutional demand has emerged this year.
Simultaneously, the corporate bid, channelled through Strategy’s STRC perpetual preferred offering, continues to clear substantial supply from the market. During the week of April 6–12, the company issued 10.03 million STRC shares, generating $1 billion in net proceeds. The inflows were promptly deployed to acquire 13,927 BTC at an average price of $71,902 per coin. Strategy’s total Bitcoin holdings now stand at 780,897 BTC, with an average cost basis of $75,577.
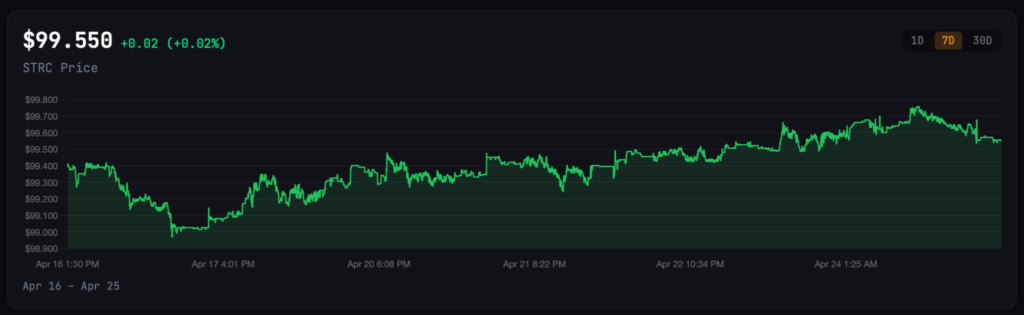
Figure 6: STRC Price Across the Past Two Weeks
The monthly dividend for STRC was maintained at 11.5 percent for April, following a sequence of seven consecutive monthly increases, and marks the first time the dividend did not rise since the product’s inception. This should not be interpreted as a sign of weakness; rather, the absence of a further yield increase suggests that the at-the-market (ATM) issuance program continues to clear at par, obviating the need for a higher yield to attract incremental capital. Critically, STRC’s issuance effectively absorbed a volume of Bitcoin supply equivalent to a full month of aggregate spot ETF demand.
Derivatives Are Calm
In the options market, the dominant move in implied volatility remains to the downside across the curve. The 1-month, 3-month, and 6-month tenors have been grinding lower over the past two weeks, reflecting a steady compression in volatility expectations.
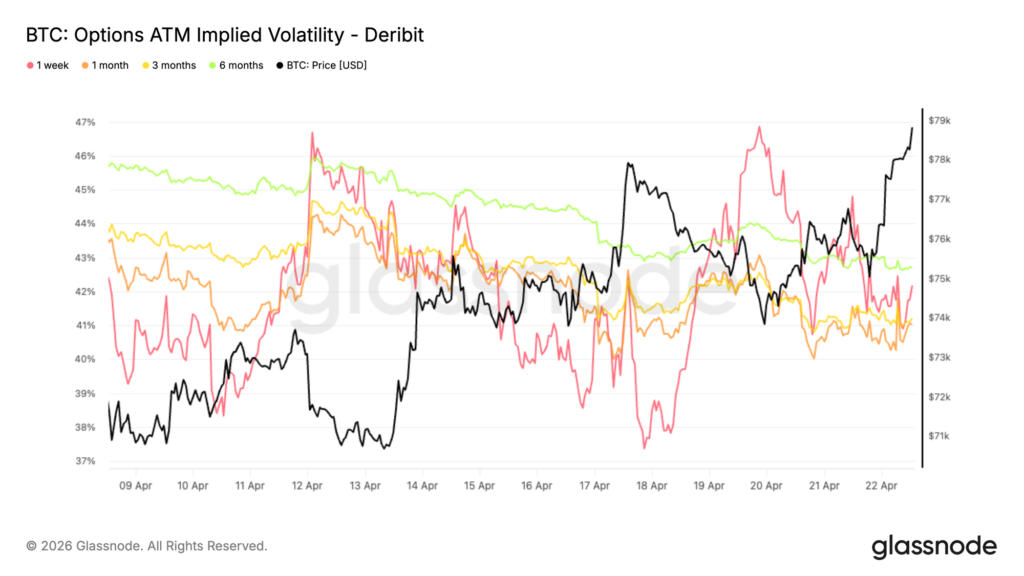
Figure 7: Bitcoin Options Implied Volatility Across All Major Expiries.
(Source: Deribit)
The 1-week has been more reactive, with a few sharp spikes toward 46 percent, but these moves have not held and have quickly faded back into the broader downtrend. This suggests the market is not willing to sustain a bid for short-term protection. Instead, volatility is being consistently sold across maturities. Even as price trends higher, implied volatility fails to expand, pointing to a lack of urgency in hedging and limited chasing to the upside.

General Macro Update
US Consumers Show Resilience, but Pressures Are Building
The US household is, on the surface, the strongest argument against an imminent slowdown. Spending continues to expand, hiring remains stable, and headline output is tracking near trend. Beneath that headline, however, three pressures are accumulating in parallel: energy, housing, and the gap between nominal and real income, which together determine how long the resilience can last. The starting point for the next phase of the cycle is therefore not whether consumers are still spending, but what is funding that spending and what would have to change for it to weaken.
Spending Is Holding, but the Composition Hints at Stress
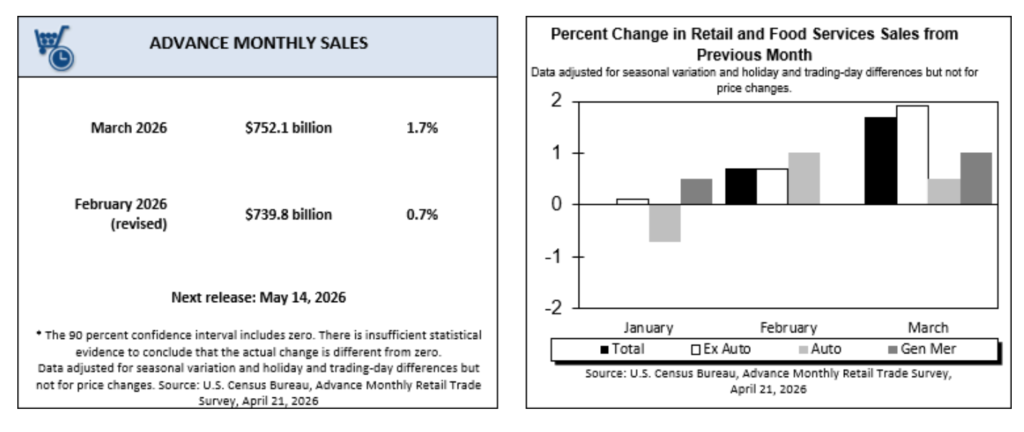
Figure 8. Unemployment Rate, Nonfarm Payroll (Source: Bureau of Labour Statistics)
The latest data from the US Census Bureau shows retail and food services sales rising 1.7 percent in March, the largest monthly gain since January 2023. Strength was broad-based: twelve of thirteen categories advanced, and the increase was not confined to fuel. Higher gasoline prices pushed petrol-station receipts up 15.5 percent on the month, but the control group ex-fuel still rose, indicating that consumers continued to spend across discretionary categories rather than reallocating exclusively into essentials. Strong March hiring supported the income leg, whilst larger tax refunds added a one-off cash-flow boost, a factor particularly meaningful for lower-income households whose marginal propensity to consume is highest.
Retail sales remain one of the most timely measures of consumer demand, and a print of this magnitude is consistent with around 2.2 percent quarterly GDP growth on current Atlanta Fed GDPNow nowcasts. However, the strength is partially mechanical. A portion likely reflects pull-forward demand, with consumers bringing purchases forward in anticipation of further price rises tied to geopolitical risk and energy. The lagged effect of higher costs on large-ticket categories such as vehicles also tends to appear with a delay. The base case is that consumer spending softens over the next quarter before stabilising, conditional on external pressures fading.
The Labour Market Is Doing the Heavy Lifting

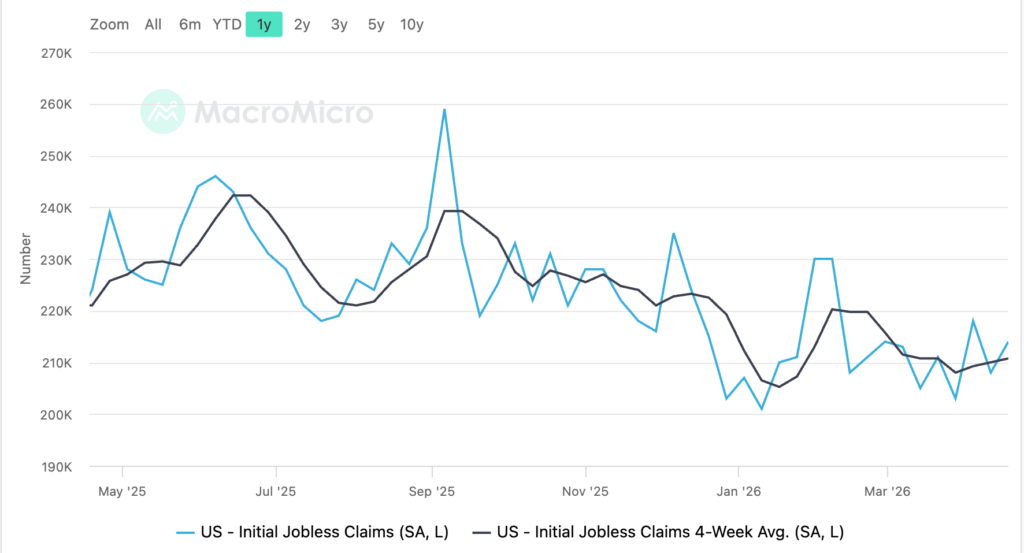
Figure 9. Initial Jobless Claims (Source: US Department of Labour)
The labour market is the single most important variable holding the resilience thesis together. The 13-week moving average of initial jobless claims tracked by the US Department of Labour sits near 214,000, indicating steady employment conditions and very low layoff activity. Hiring has slowed materially, but firings have slowed in parallel. This has been characterised as a “low-fire, low-hire” regime, in which firms are reluctant to expand headcount but equally reluctant to release existing staff into a market they are not confident they could re-hire from later.
For households, the practical effect is income stability without acceleration. Job security is intact, wage gains are firm in nominal terms, and confidence in the income leg supports continued spending decisions. The fragility of the regime, however, lies precisely in its dependence on this single pillar. If the firing side of the equation begins to lift, even modestly, the offsetting buffer that has masked weaker hiring disappears quickly.
Energy and Food: A Real Income Story
Rising energy and food costs are the most visible pressure point on household budgets. Food accounts for around 14 percent of typical household expenses, whilst energy contributes roughly 6.5 percent of the consumer price index (CPI) basket. Both categories disproportionately affect lower-income households, where a larger share of income is spent on non-discretionary items.
The framing here matters. Nominal wage growth is not the bottleneck; real wage growth is. So long as nominal earnings track price increases, headline incomes look healthy. When energy and food prices accelerate above wage gains, however, the squeeze appears not in the income statement but in the household’s discretionary budget. The watch-item over the coming weeks is therefore not the labour data on its own, but the gap between expected price increases and realised wage gains, the variable that most accurately predicts whether confidence and spending behaviour begin to diverge.
Housing Is the Structural Constraint
Housing is the most durable source of pressure on household finances, and the one least amenable to short-term policy response. Shelter costs represent more than 35 percent of household expenditure and a similarly outsized share of core inflation. A persistent supply shortage continues to drive prices higher, reinforced by two structural dynamics: existing homeowners are locked into low-rate mortgages from 2021 and have little incentive to sell, and post-pandemic preferences have shifted toward larger units, concentrating demand in the most supply-constrained segments of the market.
Mortgage rates have re-priced sharply over the cycle, with the 30-year fixed rate mortgage rate rising from roughly 3 percent in 2021 to over 6.7 percent currently. Borrowing costs of that magnitude reduce affordability for prospective buyers and increase financing costs for builders, suppressing new construction and prolonging the supply imbalance. Renting absorbs the spillover, with rental costs pushed higher by the same supply-demand mismatch. The result is that a meaningful share of household income is now absorbed by shelter regardless of tenure choice. This fixed cost crowds out discretionary capacity even when nominal incomes hold up.
What We Are Watching
The resilience thesis is intact for now, but it depends on a specific configuration: stable labour market conditions, contained inflation expectations, intact savings buffers, and credit availability used as a tool for flexibility rather than as a substitute for income. The leading indicators of a regime change are not the headline spending or jobs prints, those are coincident, but the second-order series that signal stress earlier: household inflation expectations, the personal savings rate, the share of credit card balances financing essentials, and the gap between real wage growth and expected inflation.
Each of these is currently in a fragile, watch-list state. A meaningful deterioration in any one of them would not, on its own, end the resilience phase. A simultaneous move in two or more would.
Conclusion
US consumers are still doing the work of supporting the expansion, but the conditions underwriting that support are more conditional than the headline data suggests. Stable employment and one-off income boosts have masked the real-income compression that energy, food, and shelter together impose. Spending is firm; the funding mix beneath it is the variable to monitor. The next phase of the cycle will not be defined by whether consumers continue to spend, but by what they have to draw on to keep doing so.

Are We Entering a ‘Squeeze Economy’?
We argued that headline spending was holding up despite accumulating headwinds in housing, energy, and income growth. The April data confirms that the headwinds have now hardened into a measurable shift. Consumption itself has not yet broken, but the way it is being financed has, and household expectations have re-rated lower in a single month. The question is no longer whether pressures are building beneath the surface; it is how long the surface holds.
The Expectations Channel Has Snapped
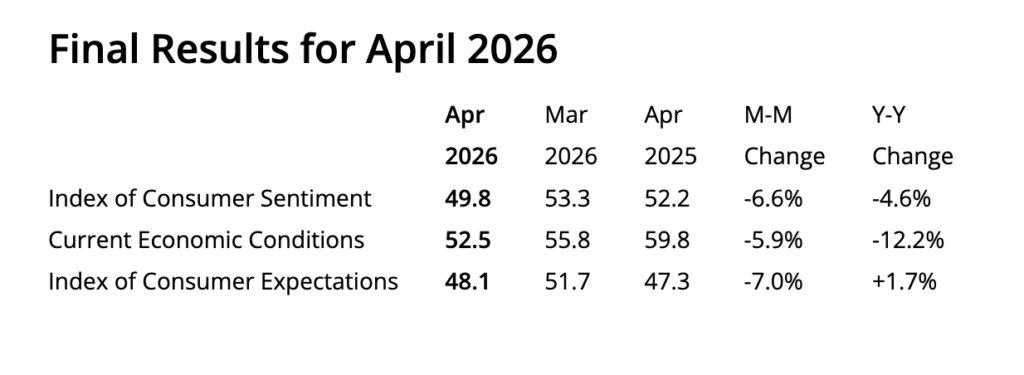
Figure 10. Consumer Sentiment – University oF Michigan
The most consequential development since the last Bitfinex Alpha is the move in household inflation expectations. The University of Michigan‘s final April reading places the headline Consumer Sentiment Index at 49.8, an all-time low in the survey’s history. More importantly, year-ahead inflation expectations jumped from 3.8 percent in March to 4.8 percent in April, a 100 basis point shift in a single month and the largest such move since April 2025. Long-term (5–10 year) expectations rose to 3.5 percent, the highest reading since October 2025 after holding in a 3.2–3.3 percent range for four consecutive months.
Sentiment fell across every demographic: income, age, and political bracket in the survey, ruling out a partisan or cohort-specific explanation. The proximate cause is the energy pass-through from the US-Iran conflict: national average retail gasoline has held above $4 per gallon throughout the month, with diesel above $5 per gallon, and households remained focused on the inflation fallout even after a ceasefire was announced. This pattern, which reflects sentiment lagging diplomatic de-escalation by months, is consistent with prior energy-shock episodes.
For the Federal Reserve, the long-term expectations move is the more dangerous data point. It is the variable the central bank watches most closely when assessing whether inflation psychology is becoming unanchored, and a one-month shift of this size raises the bar for any near-term easing pivot, even as the real economy weakens at the margin.
The Real Wage Gap Is Widening
We have previously flagged that slowing income growth is a pressure point. The April data refines that picture in an important way. Nominal wage growth is not slowing: the Atlanta Fed Wage Growth Tracker rose to 3.9 percent in March from 3.7 percent the prior month, and average hourly earnings continue to print near 3.5 percent year-on-year. The actual squeeze is in real terms. Real average hourly earnings rose only 0.3 percent year-on-year in March, and with year-ahead inflation expectations now at 4.8 percent, the gap between expected price increases and realised nominal wage gains has widened materially.
This distinction matters because it changes the policy implication. A nominal wage slowdown would justify Fed easing on its own. A real wage compression driven by an external supply shock does not, and may in fact require the Fed to remain restrictive for longer to prevent expectations from drifting further. Households experience the gap as a squeeze regardless of which mechanism is at work.
Consumption Is Being Financed, Not Earned
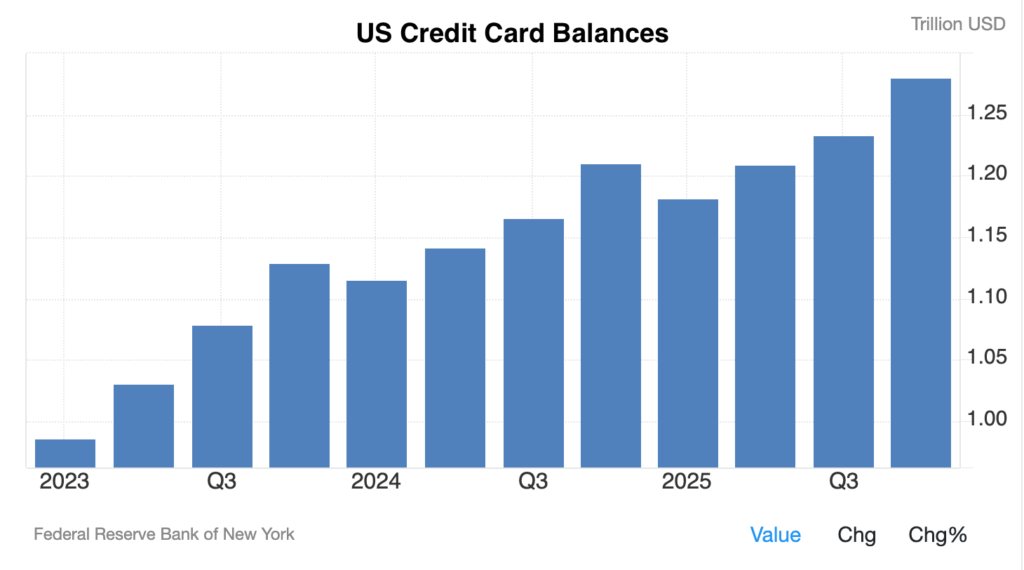
Figure 11: US Credit Card Balances (Source: Federal Reserve Bank of New York)
We have acknowledged that the March retail sales strength may partly reflect pull-forward demand. The April composition data adds a second, harder-edged explanation: the funding mix beneath stable consumption is shifting from earned income to credit and savings drawdown. Total US credit card balances have crossed $1.3 trillion. The share of cardholders carrying a balance for at least a year has risen to 61 percent, up from 53 percent in late 2024. Roughly 55 percent of those balances now cover essentials, groceries, rent and healthcare, rather than discretionary purchases.
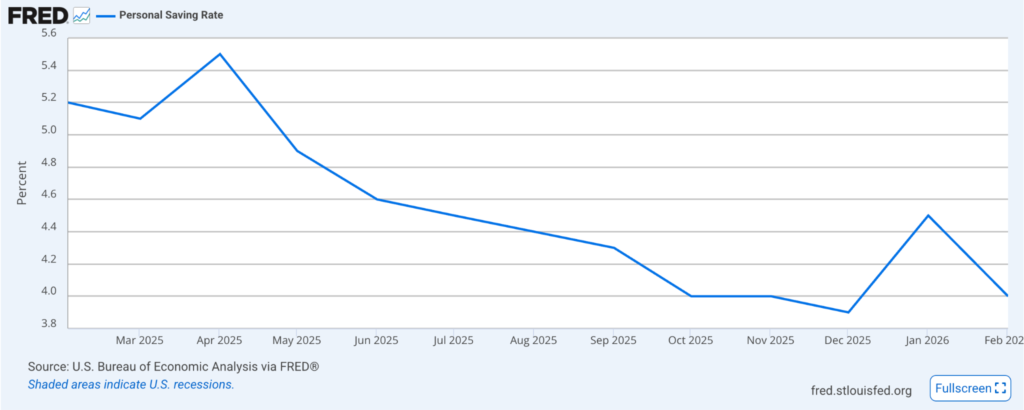
Figure 12. Personal Savings Rate (Source: Bureau of Economic Analysis)
The personal savings rate fell to 4 percent in February from 4.5 percent in January, with March data due 30 April. Taken together, these are the first hard signals that the buffers identified in the prior note are now being actively drawn down. Consumption can stay firm under this configuration for a meaningful period, but the marginal source of spending power has shifted from a renewable resource to a depleting one.
The Sentiment-Spending Divergence
A common pushback at this stage of a cycle is that consumer sentiment and consumer spending are weakly correlated, and therefore, a record-low sentiment print should not be over-interpreted. That objection is partially valid, as the gap between what households say and what they do has been a persistent feature of the post-pandemic period. The relevant question is what sustains the gap. Historically, sentiment-spending divergences narrow when one of three things happens: the savings buffer is exhausted, credit access tightens, or a labour-market shock removes the income leg.
The labour market remains the load-bearing pillar characterised as a “low-fire, low-hire” regime. As long as that continues, the divergence can persist. Once it does not, the convergence is typically rapid.
Implications for Crypto and Risk
For crypto markets, the setup is more complex than a simple “weak consumer = Fed cuts = bid for risk.” A sentiment-driven slowdown that compels the Fed to ease would historically support Bitcoin through the liquidity channel. However, the inflation-expectations move complicates that path: the Fed cannot ease aggressively into a 4.8 percent year-ahead expectations print without risking de-anchoring, and Fed Chairman Jerome Powell has consistently signalled that long-term expectations are the line he will not let move.
The more probable near-term regime is what has been labelled “stagflation-lite” , slowing real demand, sticky-to-rising inflation expectations, and a Fed forced to remain patient. This historically favours scarce, non-sovereign stores of value such as Bitcoin and gold while pressuring duration-sensitive risk assets. Recession probability estimates have widened in the past month: RSM puts it at 30 percent, J.P. Morgan at 35 percent, with some economists pricing 50 percent. The Conference Board‘s Expectations Index has held below the 80-point recession-warning threshold for several months, and the share of consumers calling a 12-month recession “very likely” has risen even as the “somewhat likely” and “not likely” cohorts have shrunk, a bifurcation typical of late-cycle macro environments.
Conclusion
Resilience has not collapsed, but it is now visibly being underwritten by credit, savings drawdown, and a stable labour market rather than by real income growth. The expectations channel has snapped, the energy pass-through is structural for as long as gasoline remains above $4 per gallon, and the Fed’s room to respond has narrowed at exactly the moment the household sector would benefit most from accommodation.
The market implication is asymmetric. Upside surprises now require both clear disinflation and confirmation that the labour market remains intact. Downside surprises require only one further shock, to credit conditions, to the labour market, or to energy, to land on a buffer that has materially thinned. The squeeze is no longer a forecast. It is a regime.
News From the Cryptosphere
UK Brings Stablecoins and Tokenised Deposits into Core Financial Framework

The United Kingdom has unveiled a comprehensive regulatory initiative aimed at integrating stablecoins and tokenised deposits into a unified payments framework alongside traditional financial services, marking a decisive shift toward modernising its financial infrastructure. Announced by HM Treasury, the proposal seeks to consolidate fragmented regulatory regimes into a single, coherent structure that reflects the growing convergence of blockchain-based systems and conventional payment rails.
At the core of the reform is the intention to formally regulate stablecoins used in payments under a forthcoming issuance regime, bringing them within the perimeter of established financial oversight. Simultaneously, tokenised bank deposits, digital representations of traditional deposits on distributed ledgers, will be incorporated into the same regulatory architecture, enabling interoperability between legacy banking systems and emerging tokenised financial networks.
The framework also expands the authority of the Financial Conduct Authority (FCA), particularly in relation to Open Banking and next-generation payment systems, including those executed by AI-driven agents. This signals a forward-looking approach that anticipates the increasing role of automation and programmable finance in payment ecosystems.
To support innovation and industry coordination, the government has committed additional funding to the Centre for Finance, Innovation and Technology, while appointing a dedicated Wholesale Digital Markets Champion to accelerate the development of tokenised wholesale financial systems.
Crucially, the initiative also proposes legislative measures to reduce administrative barriers for firms offering stablecoin-based payment services, aiming to position the UK as a globally competitive hub for digital assets.
Overall, the reform reflects a strategic alignment of regulation with technological evolution, embedding digital assets within the mainstream financial system and reinforcing the UK’s ambition to lead in the next generation of global payments infrastructure.
Tether Executes Record $344M USDt Freeze

Tether has carried out one of the largest enforcement actions in stablecoin history, freezing more than $344 million in USDt across two wallets on the Tron blockchain in coordination with the US Treasury’s Office of Foreign Assets Control (OFAC) and federal law enforcement agencies. The freeze, executed on April 23, 2026, followed intelligence provided by authorities identifying the addresses as linked to illicit financial activity, including sanctions evasion and criminal networks.
The targeted wallets reportedly held approximately $213 million and $131 million, respectively, and were blacklisted in real time, preventing any further transfer or movement of funds. This action underscores Tether’s technical capability to intervene at the smart contract level, effectively halting transactions by restricting specific blockchain addresses, a feature that has become central to its compliance infrastructure.
Beyond the scale of the freeze, the event signals a broader structural evolution in the role of stablecoin issuers. Tether increasingly operates as an enforcement-adjacent entity, collaborating directly with regulators and investigative bodies. The company reports working with over 340 law enforcement agencies across 65 jurisdictions and has supported more than 2,300 cases globally, freezing over $4.4 billion in assets to date.
This development highlights the dual nature of public blockchain systems: while transactions remain transparent and traceable, centralised issuers like Tether retain the authority to enforce restrictions, effectively embedding compliance mechanisms within decentralised financial rails. As regulatory scrutiny intensifies globally, such actions reinforce the positioning of stablecoins not merely as liquidity instruments, but as programmable financial infrastructure aligned with sovereign oversight.
Ultimately, the freeze represents a critical inflection point, demonstrating how large-scale digital asset networks are converging with traditional enforcement frameworks, reshaping the boundaries between decentralisation and regulatory control in modern finance.

Russia Advances State-Controlled Crypto Framework
.png")
Russia has taken a decisive step toward formalising its cryptocurrency market, as the State Duma approved a comprehensive digital asset bill in its first reading, establishing the legal and regulatory foundations for crypto circulation within the country. The legislation introduces a structured framework that brings cryptocurrencies under explicit state oversight, with the Central Bank of Russia designated as the primary regulatory authority responsible for licensing, supervising, and potentially restricting market participants.
A central feature of the bill is its dual-track approach to crypto usage. While cryptocurrencies are formally recognised as property, granting holders legal protections in civil contexts such as bankruptcy and asset disputes, the law explicitly prohibits their use as a means of payment within Russia’s domestic economy. The ruble, including its digital form, remains the sole legal tender, reinforcing monetary sovereignty and limiting internal financial disintermediation.
However, the legislation introduces a strategically significant exception by permitting cryptocurrencies for cross-border trade settlements. This provision enables Russian firms to transact with foreign counterparties using digital assets, a mechanism widely interpreted as a response to ongoing financial sanctions and restricted access to global payment systems. By embedding crypto into foreign economic activity while restricting domestic use, Russia is effectively leveraging blockchain infrastructure as a geopolitical and financial tool.
The bill also outlines a tiered investor framework, imposing purchase limits, reportedly around 300,000 rubles, for non-qualified investors while granting broader access to institutional or professional participants. Additionally, it establishes pathways for banks, brokers, and exchanges to operate legally within a licensed environment, signalling a transition from an informal market to a tightly regulated ecosystem.
Although the proposal must still pass additional legislative stages before becoming law, with a potential implementation target of July 2026, the first reading marks a pivotal shift in Russia’s crypto strategy, balancing state control, economic necessity, and technological integration within a rapidly evolving global financial landscape.