Bitfinex Trading 101—Understanding Support & Resistance
When it comes to trading, understanding and being able to identify support and resistance levels is crucial. It could be a powerful knowledge & skill as most trading strategies usually involve support/resistance analysis.
The occurrence of support and resistance is reliant on the psychology of the market.
Identifying support levels
A support level is a level to which price has descended yet struggled to break below. At this level, demand is strong enough to keep the price from dropping further.
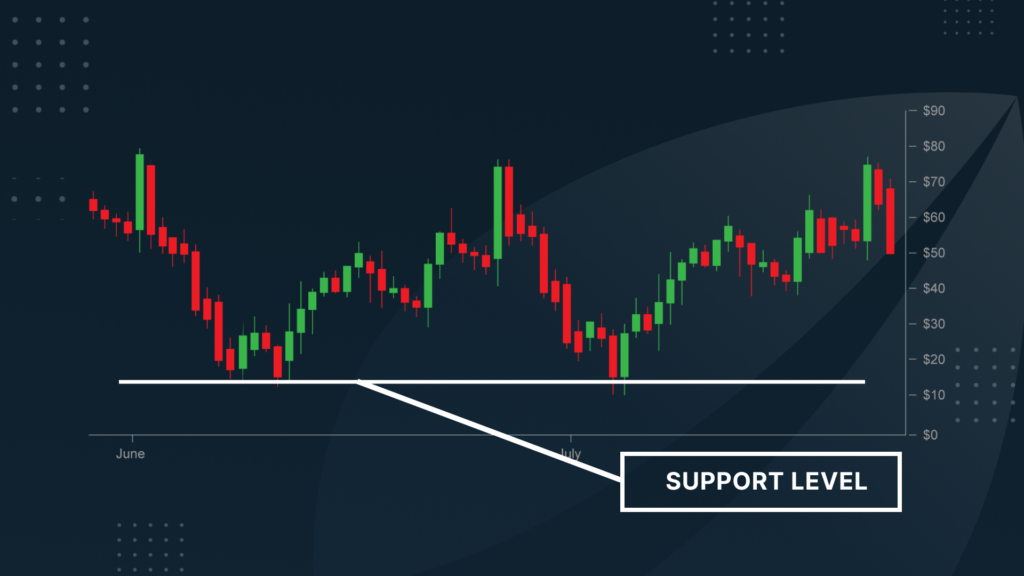
The rationale behind this is buyers see it as a good deal when the price gets closer to the support level. Meanwhile, sellers are no longer motivated to sell as they’re getting a worse deal. Such a scenario leads to demand from buyers outnumbering supply from sellers; thus, price is supported from falling even lower.
Identifying resistance levels
The opposite of a support level, a resistance level is a level to which price has ascended yet struggled to break above. At this level, the selling pressure is strong enough to keep the price from climbing further.
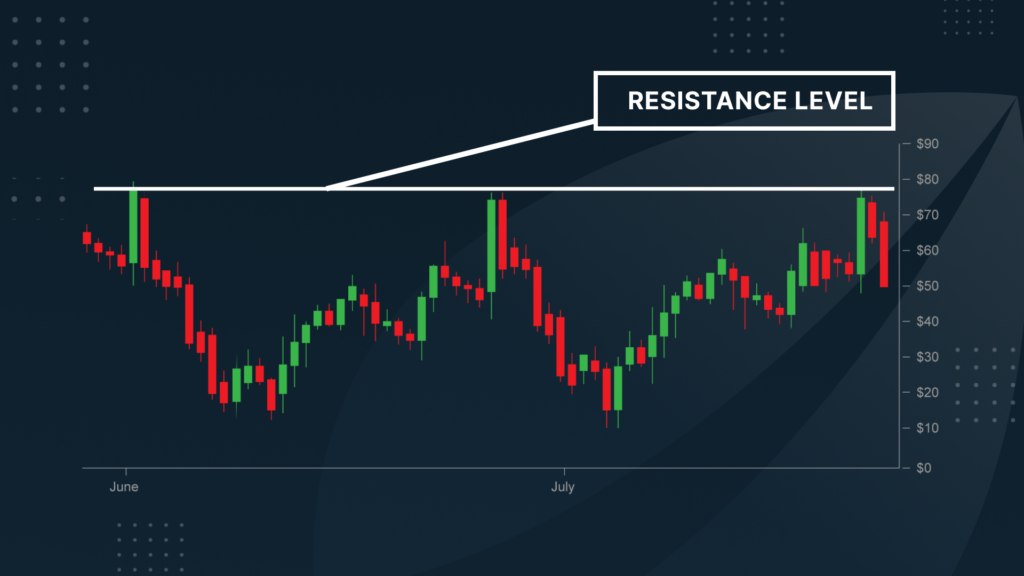
The rationale behind this is as the price gets more expensive, buyers resist themselves from buying, while sellers try to take the opportunity by selling more. In this scenario, supply from sellers outnumbers the demand from buyers; thus, price is resisted from rising even higher.
In theory, once the support/resistance level is breached, the price will keep falling/rising until it finds a new support/resistance level.
On trading charts, a support/resistance level can be identified by drawing a horizontal line across the lowest/highest price points. The more points are connected by the line; the more significance is given to this level. Or in a technical analysis language, the more often a support/resistance level is tested, the more significant is the level.
Sign up to Bitfinex newsletter or subscribe to our YouTube channel for more insightful content.