

Issue #220:
Bitcoin holds $77,100 As the Fed Turns Hawkish
Bitcoin Holds Ground as Rate Risks Rise
Bitcoin is holding firm even as the macro backdrop becomes less forgiving. A sharper repricing of US interest rate risk has cooled the rally, but spot demand, ETF inflows and contained leverage still point to a market absorbing pressure rather than breaking under it.
Bitcoin briefly moved above $81,000 last week before retreating following Federal Reserve Chair Kevin Warsh’s hawkish Jackson Hole remarks. Despite the pullback, BTC remains above the key $77,100 support level and broader market structure is of price forming higher highs and higher lows. Importantly, the August advance has increasingly been supported by spot buying rather than excessive leverage. Open interest has risen gradually, basis remains relatively contained and US spot Bitcoin ETFs still recorded almost $1 billion of net inflows last week.
Institutional demand also continues to absorb supply. Large Bitcoin holders have reduced balances since the end of June, while custodial balances associated with exchanges and ETF platforms have increased. Ether investment products have also shown strong relative demand, taking in $815.7 million over the week and extending their inflow streak to 10 sessions. This suggests that capital remains willing to take crypto risk even as the monetary policy outlook becomes less supportive.
The constraint on markets is increasingly macroeconomic. US Personal Consumption Expenditures inflation remains at 3.7 percent, with core inflation at 3.3 percent, while private domestic demand expanded at a 4.2 percent annualised rate in the second quarter. The federal deficit is now $1.8 trillion after the first 10 months of the US fiscal year 2026. Persistent inflation, resilient private-sector activity and heavy Treasury issuance are therefore keeping upward pressure on borrowing costs and limiting the case for easier monetary policy.
Warsh reinforced that message by confirming last week that the Federal Reserve’s 2 percent inflation target is a firm constraint and signalled that policy may not yet be restrictive enough to tame inflation. Markets responded by lifting the implied probability of a September rate increase to 57 percent and pushing short-dated Treasury yields sharply higher.
For crypto, the result is a more balanced environment. Liquidity entering through ETFs and stablecoins continue to support prices, but higher expected interest rates can limit the extent of further appreciation. The next major test will come from the August labour market and inflation data. If crypto inflows remain resilient while markets continue to price a higher probability of tighter monetary policy, it would strengthen the case that underlying demand remains intact despite a more restrictive macro backdrop.

Market Signals
Bitcoin Holds Its Ground As The Fed Turns Hawkish
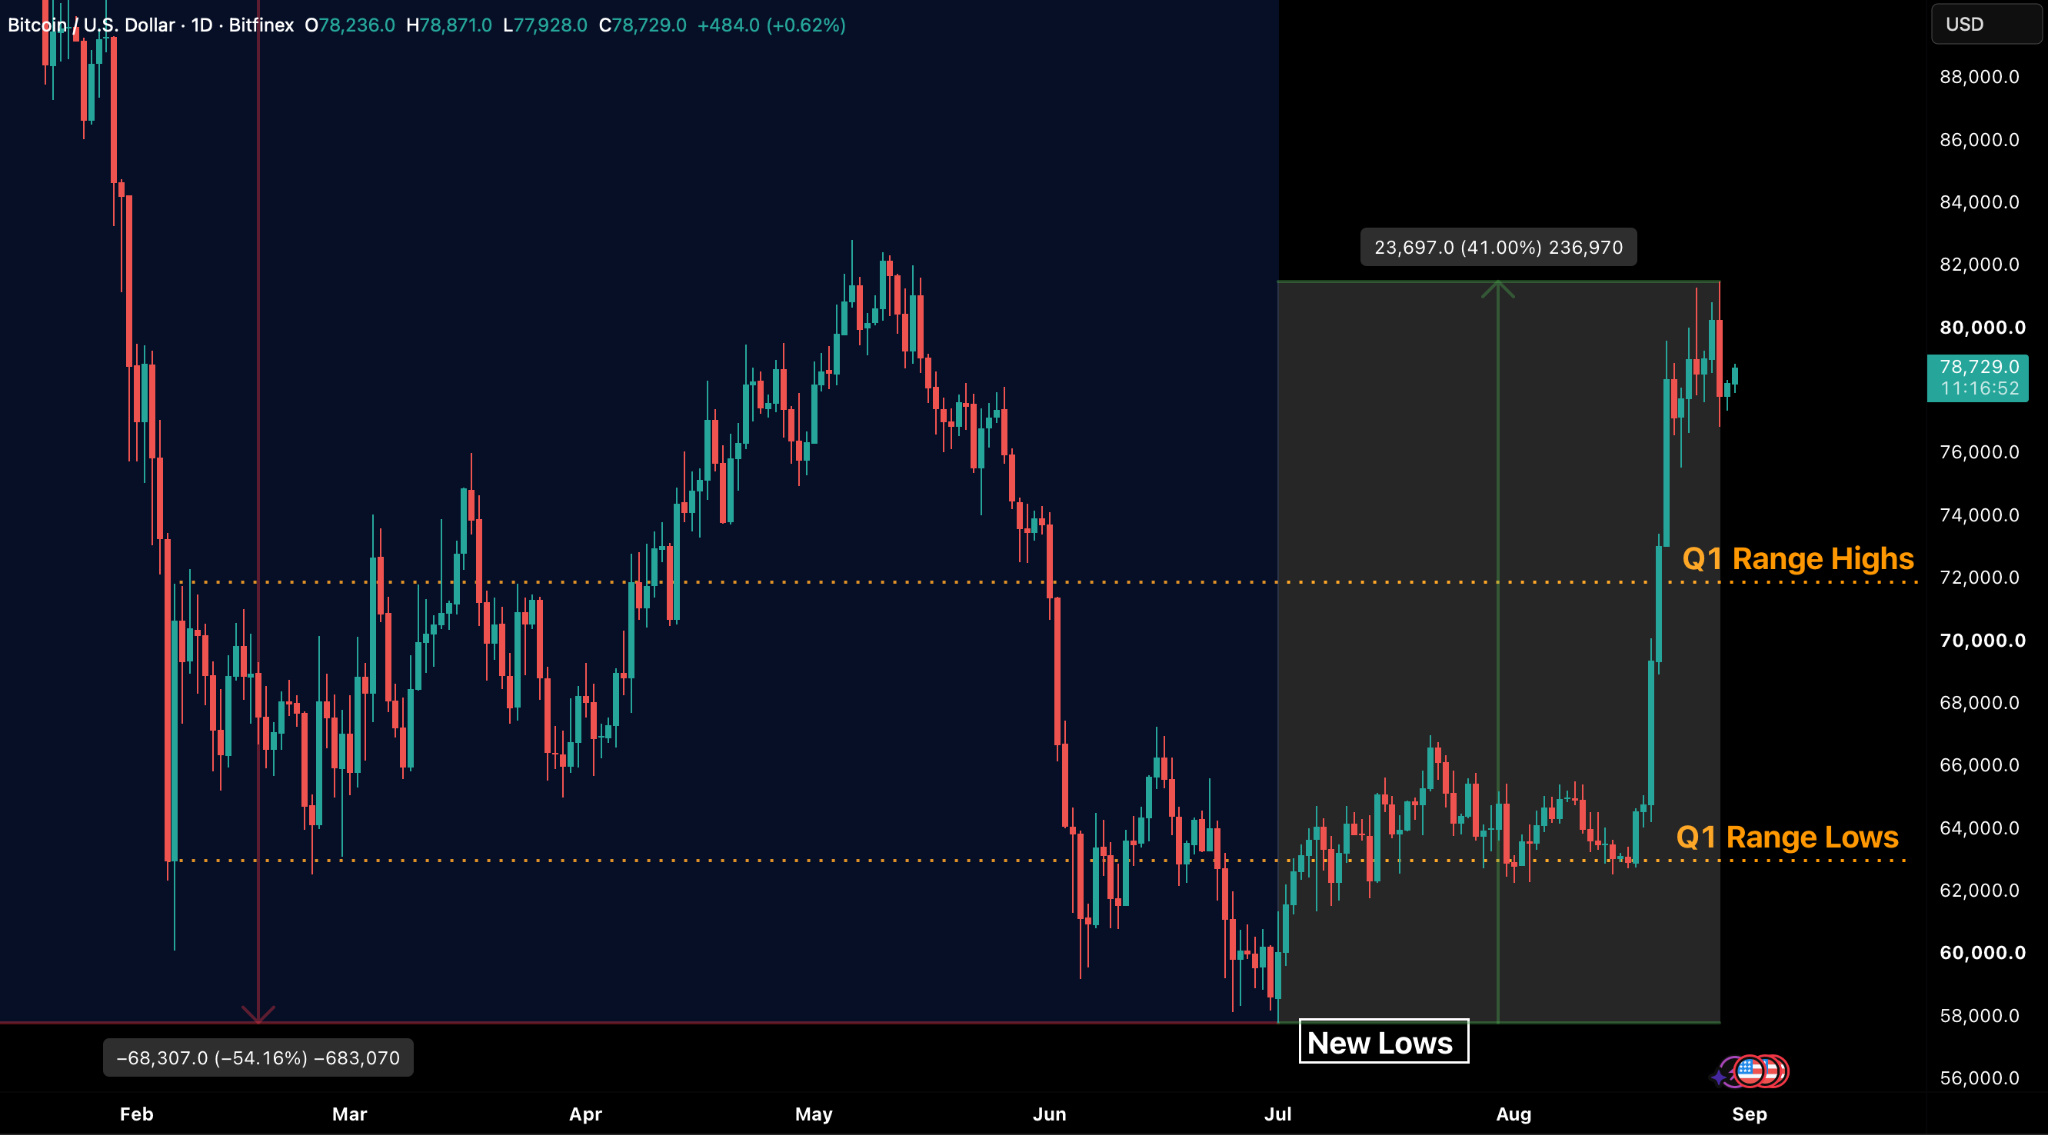
Bitcoin printed its first daily close above $80,000 since 14 May on Thursday, 27 August closing the day at $80,256, and peaking the next day to reach a high of $81,500, before dropping sharply to a low of $76,857, after the wind was taken out of its sails by hawkish signals from Federal Reserve Chairman Kevin Warsh. Indicating that interest rates may need to rise by the end of the year, the market reacted to Warsh’s comments by lifting implied odds of a September rate hike from 35 percent to 60 percent, and BTC dipped. Despite closing last Friday 3.02 percent lower however, the weekend has been calm for crypto with traditional markets closed, and price is holding well above its Q1 range highs, and maintaining a mid-timeframe uptrend of forming higher highs and higher lows.
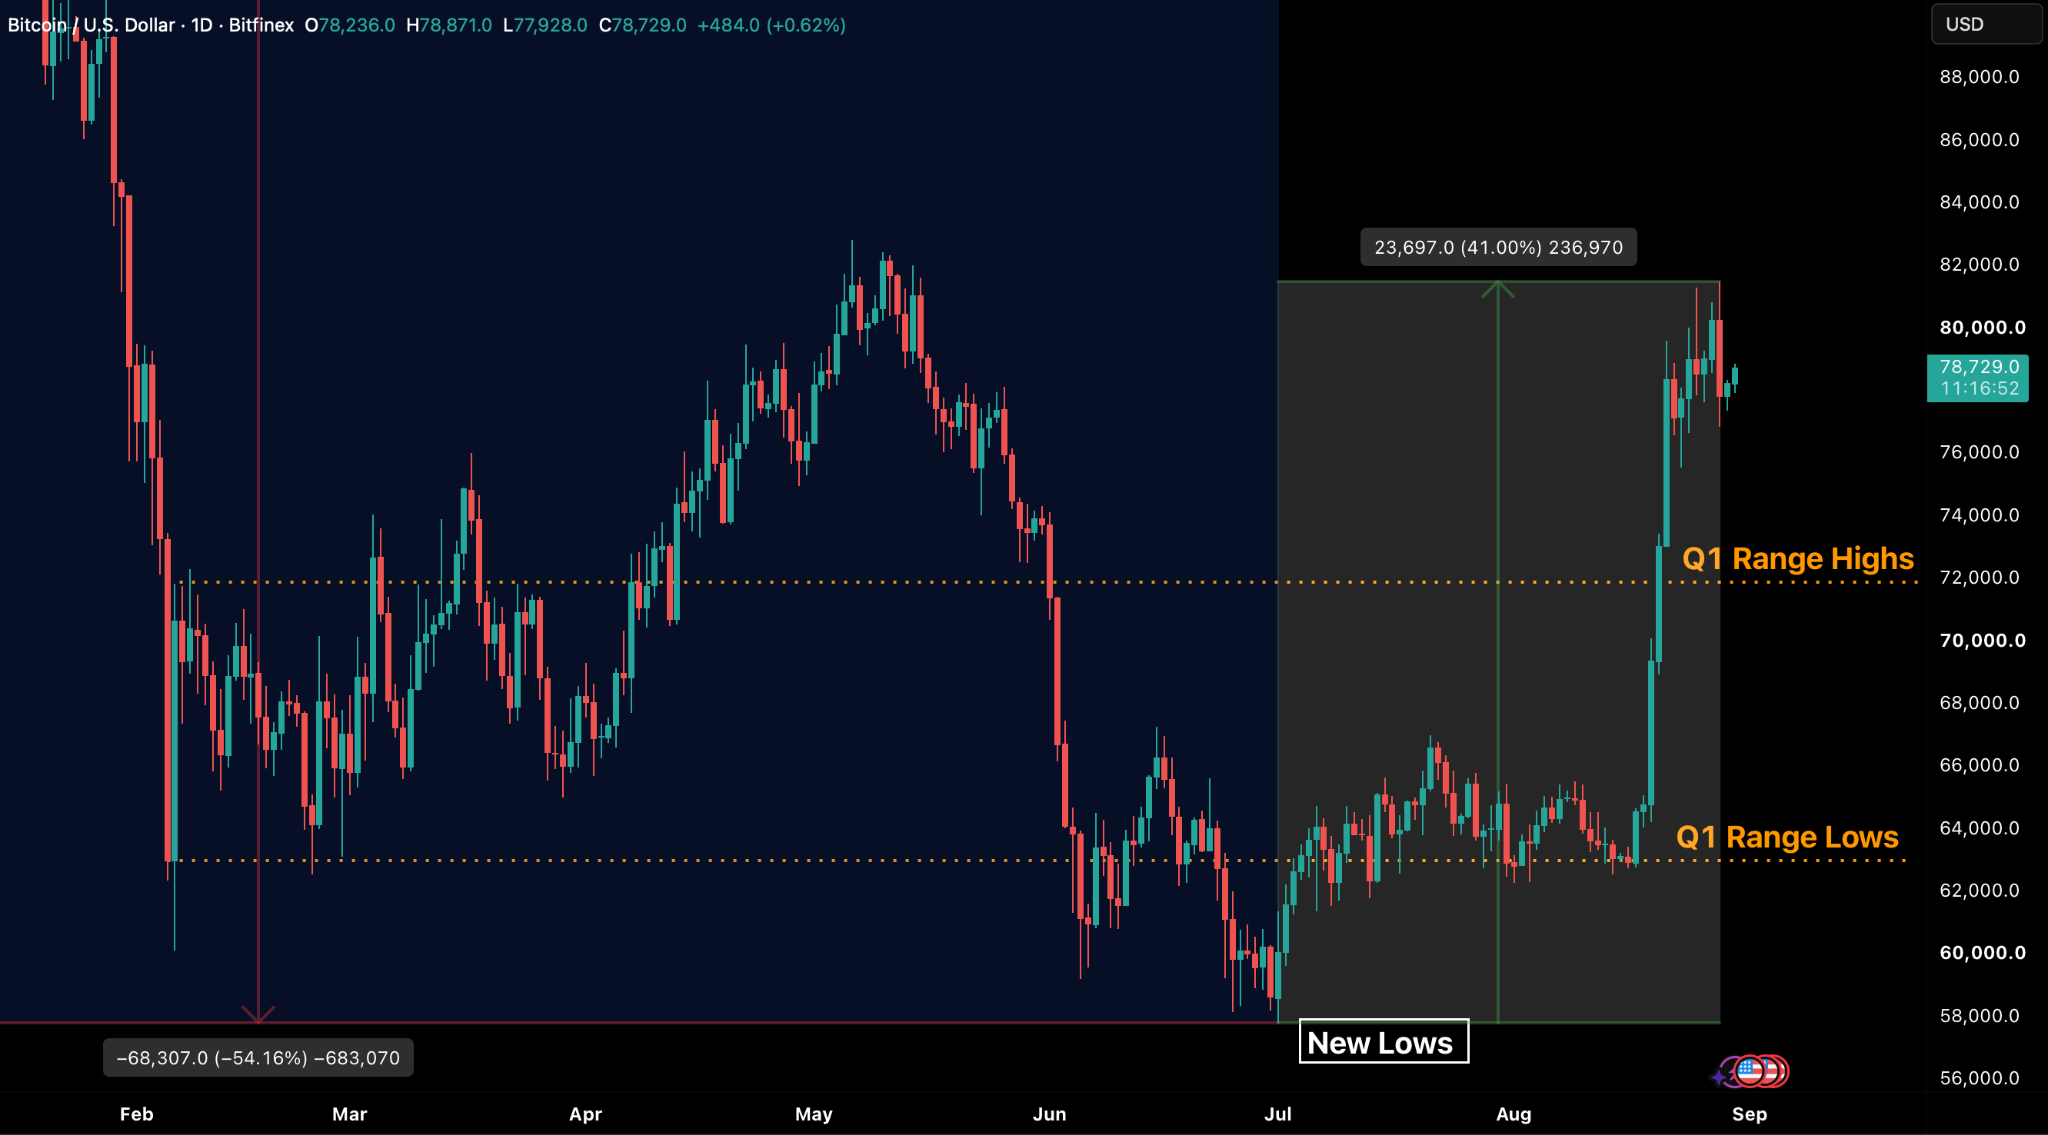
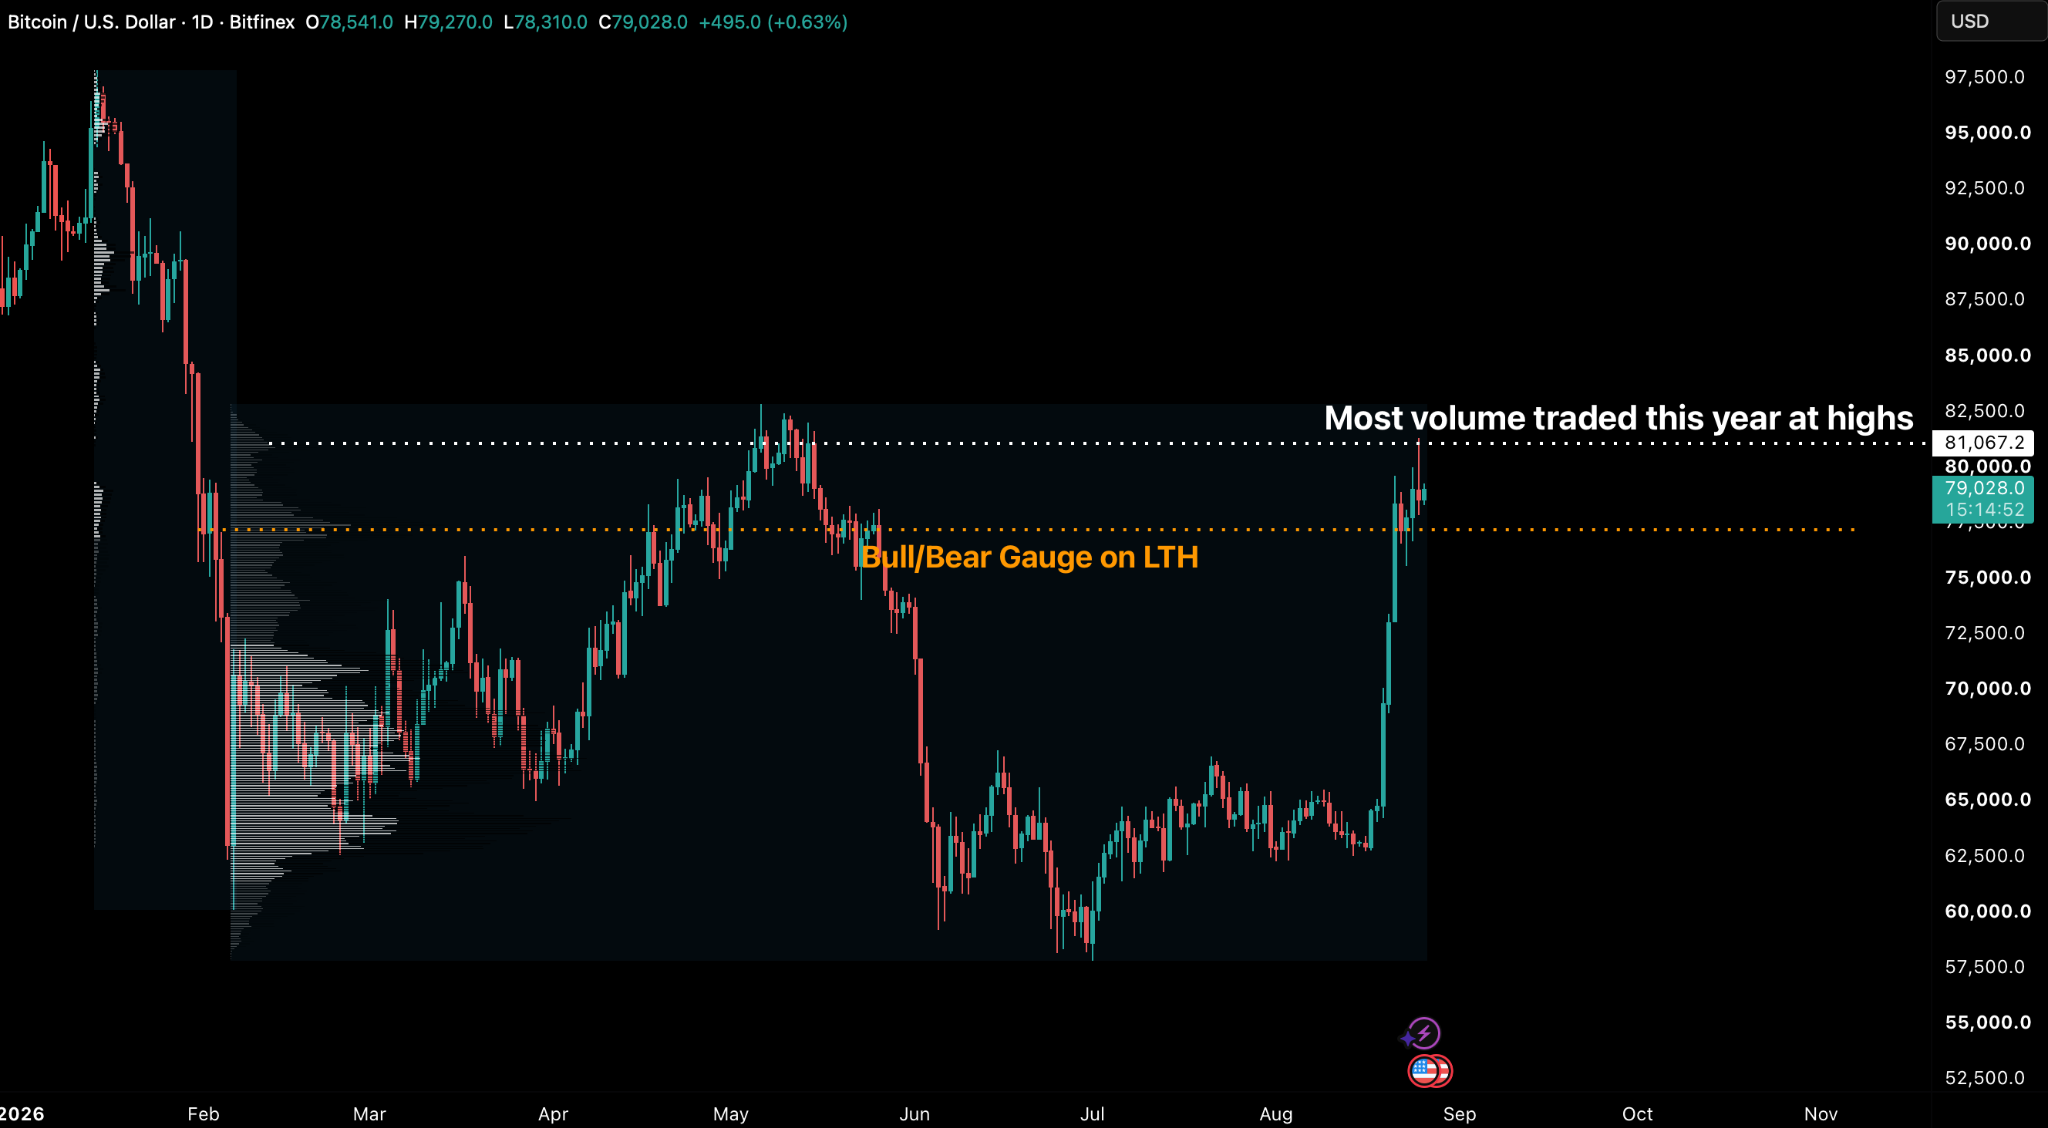
BTC’s rise in August represents a recovery of over 41 percent since the bear market lows and a 25.4 percent month-to-date performance. This price appreciation is clearly more than just an ongoing short squeeze, given that the lower timeframe support level outlined in our mid-week report of $77,100 (the level that has seen the most traded volume since BTC broke out of its summer trading range), has held as support, even after Warsh’s comments .
While the initial move two weeks ago saw significant amounts of short open interest being forced to exit positions, including the largest single-day short liquidation print in history on 19 August, open interest is still currently at $55.6 billion, over 20 percent higher than the August open.
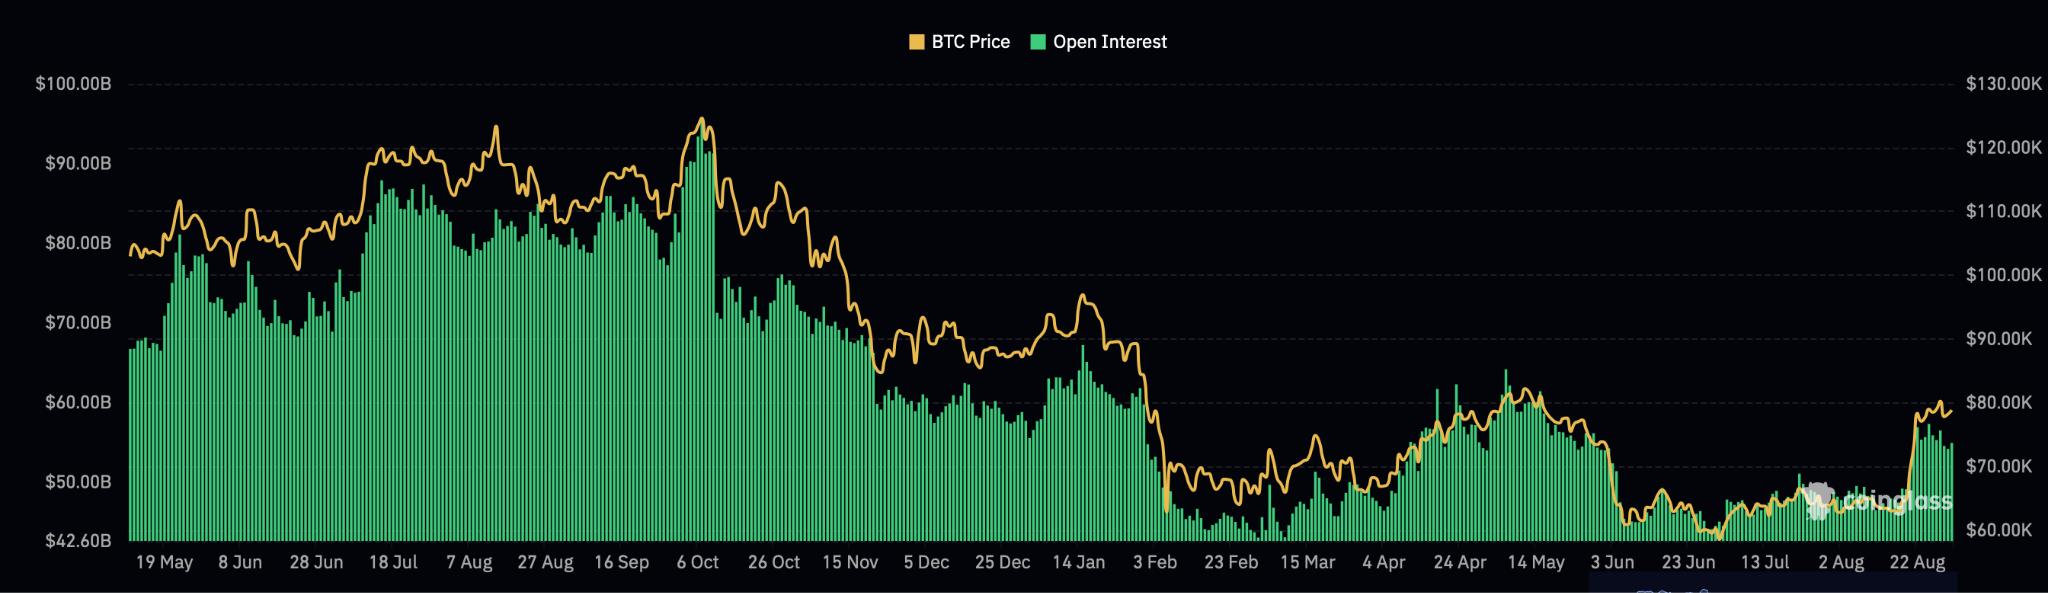
Instead, we are in a market driven by spot buying and, notwithstanding large short liquidations, open interest has only gradually increased, while basis has remained relatively low and at healthy levels historically. Continued buying in the spot market, alongside no sudden sharp build up in open interest, while holding the $77,100 level as support, indicates that we are in a market that does not show any signs of overheating. This is positive and could signal that either we will see a continuation of the new lower timeframe range or an extension of the mid-timeframe uptrend with prices drifting higher.
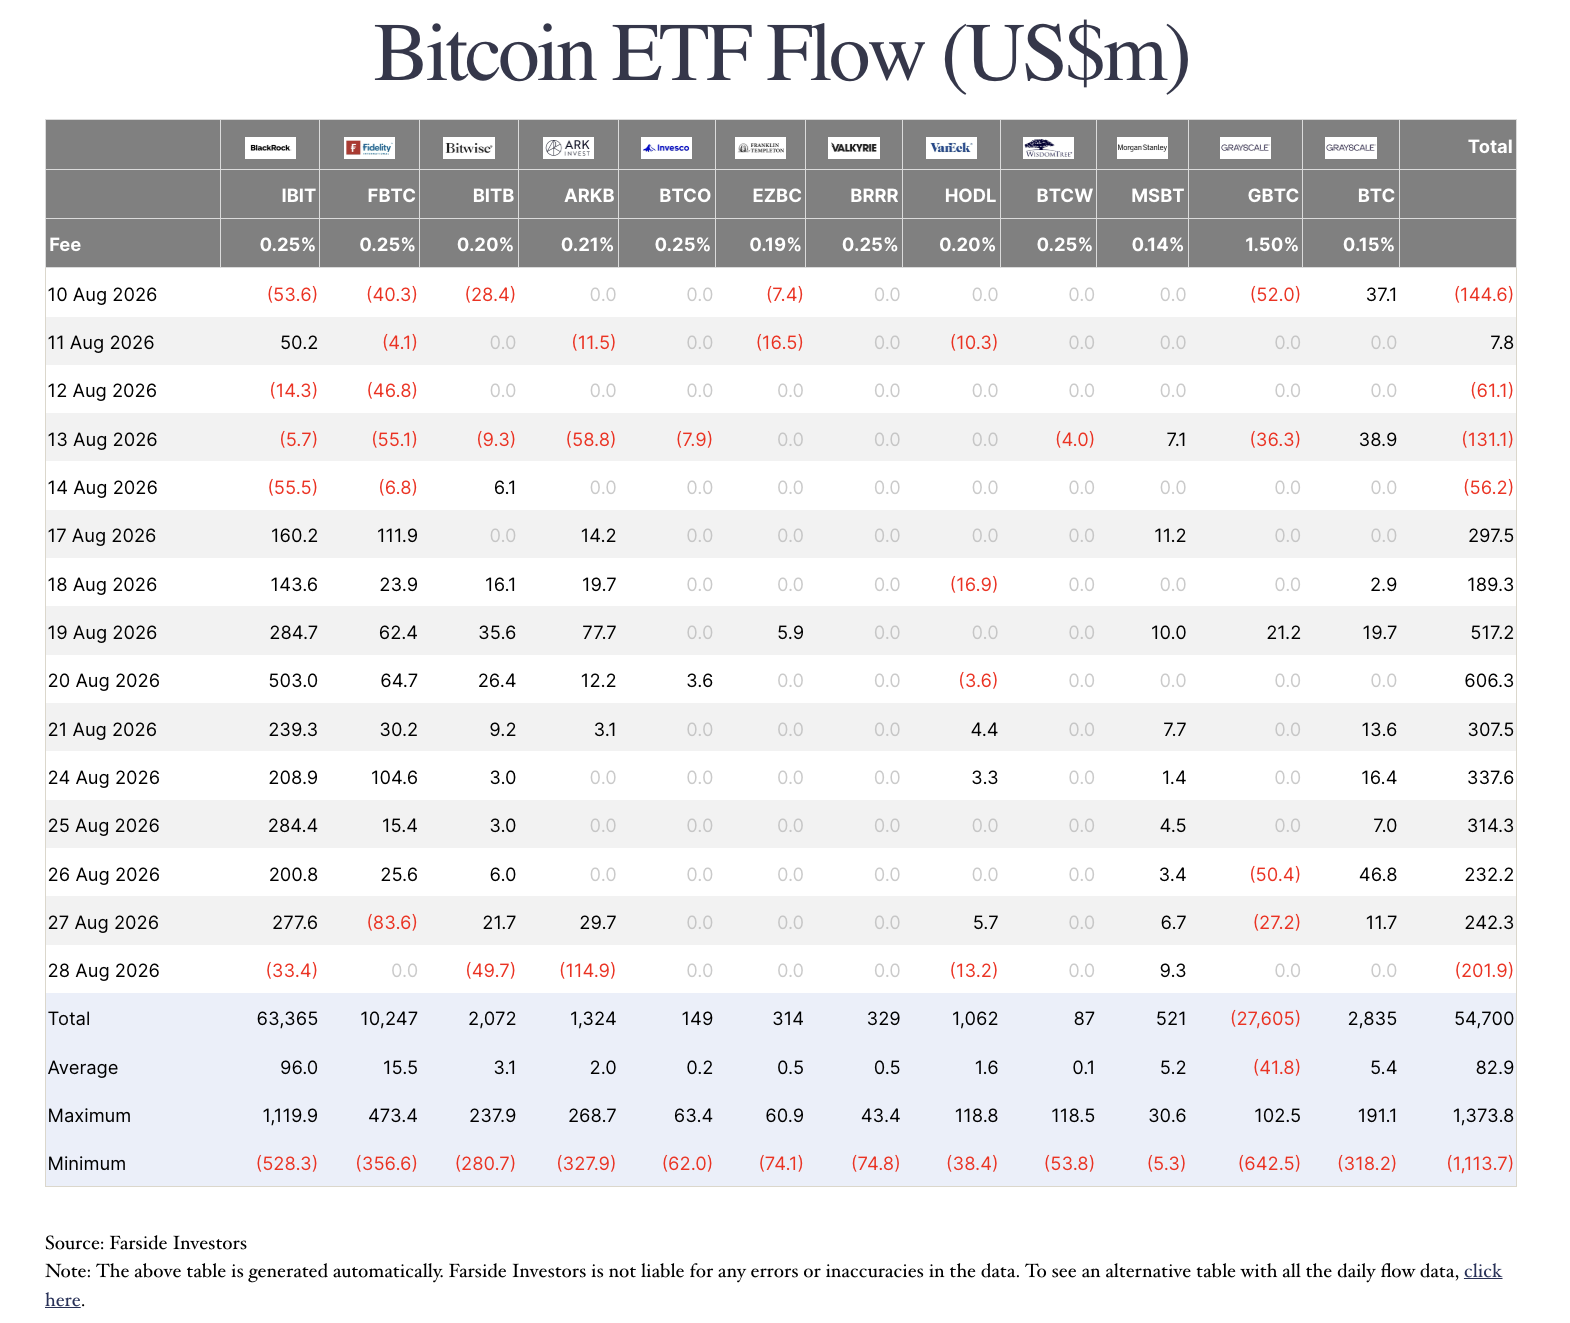
Indeed, despite the US spot ETF complex recording its first net outflow in 10 sessions last Friday, it still ended the week with $924.5 million in net inflows. Even though there were outflows following Warsh’s comments last Friday, the ETF bid remains strong, maintaining a nine-day streak of net inflows starting 17 August and absorbing $3.04 billion of Bitcoin before Friday’s session.
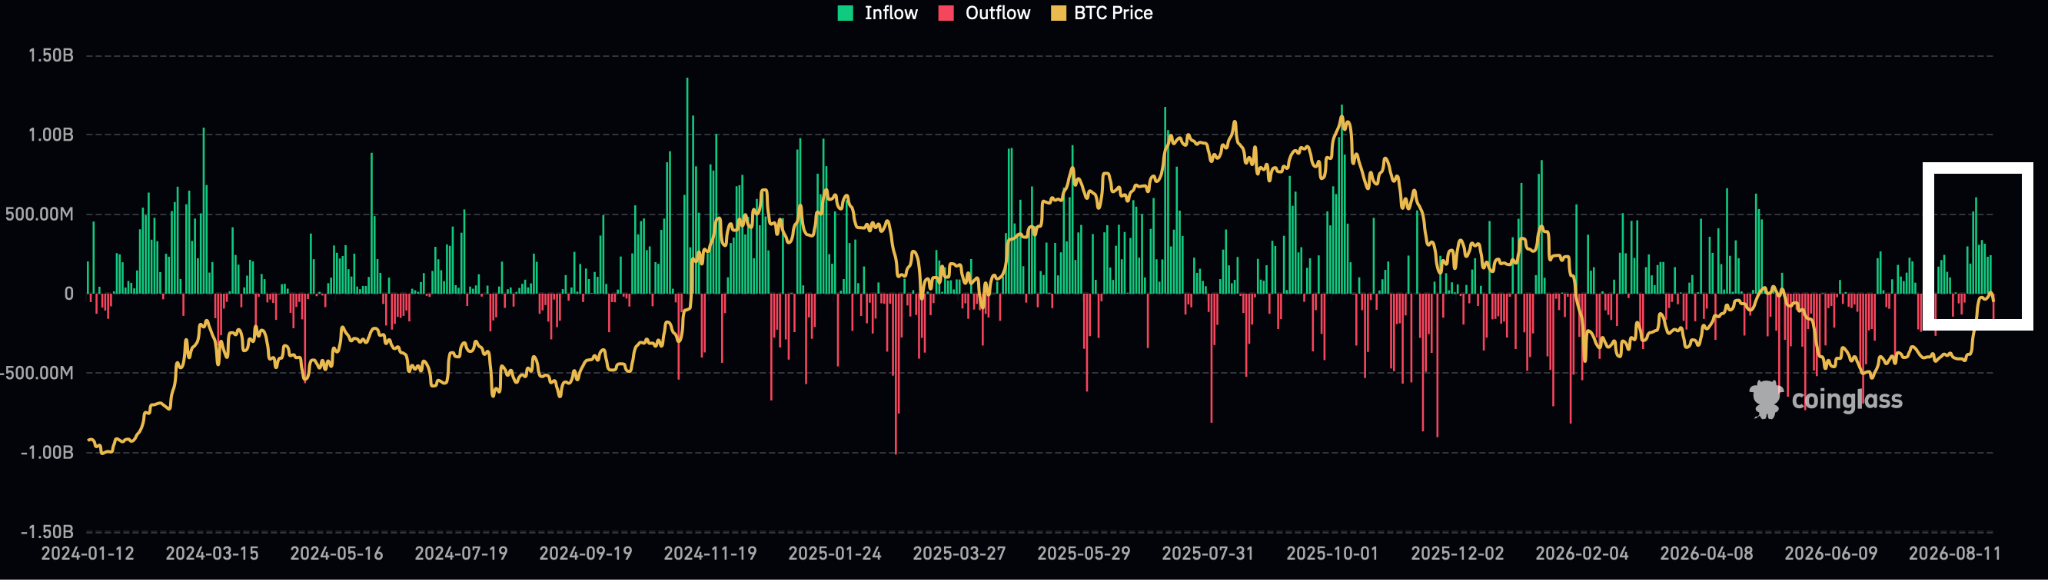
In fact, only a modest $201.9 million of outflows were recorded last Friday. Despite the late-week volatility, the last two weeks have seen inflows totalling $2.8 billion.
Analysis of Friday’s redemptions also suggests the move was a minor retracement rather than a structural reversal. The bulk of outflows originated from ARKB and BITB, totaling $164.6 million, whereas BlackRock’s IBIT shed only $33.4 million, a mere 1.5 percent of the $2.3 billion it accumulated during the previous nine sessions. This indicates that while tactical allocation vehicles reacted to the Fed’s signals, long-term institutional capital remained largely stationary. In aggregate, the complex absorbed approximately 11,700 BTC this week, nearly quadrupling the weekly network issuance, even as central bank rhetoric turned cautious.
Ether investment products outperformed their bitcoin counterparts in consistency, extending their positive streak to 10 sessions and capturing $102.1 million last Friday alone. Weekly inflows reached $815.7 million, representing nearly 90 percent of Bitcoin’s intake despite Ether’s significantly smaller market cap. We believe that Ether’s price action could potentially be the proxy for the market’s risk appetite. While the inflow streak on bitcoin products are significant, given the earlier summer lull, the contrast with Ether products is that inflows into ETH ETFs are at record highs, with nearly 12.3 percent of all inflows since inception taking place in August.
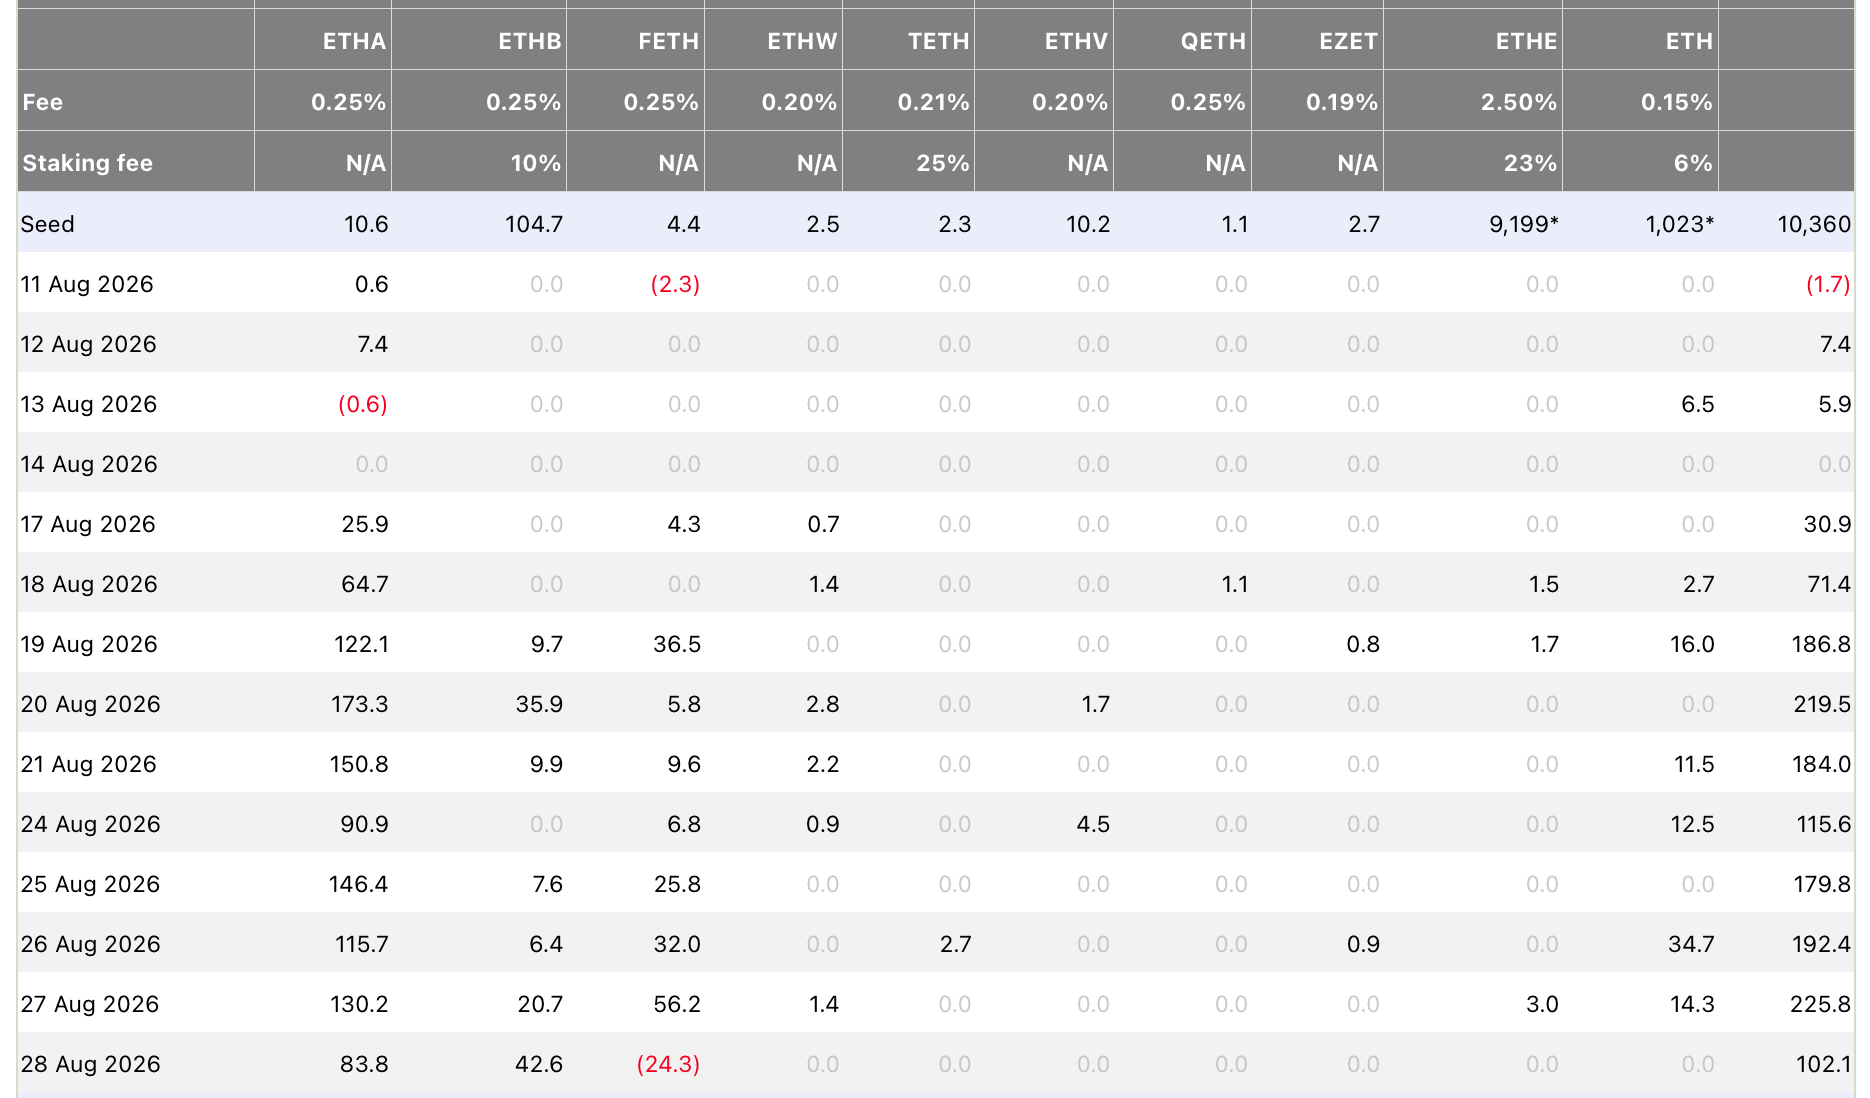
Adjusted for scale, the demand for Ether ETFs was roughly four times as intense as that for bitcoin over the past week. Meanwhile, corporate treasury activity has remained stagnant for two months. Indeed, despite raising $2.01 billion in equity, Strategy opted not to purchase additional coins last week, maintaining a $1.59 billion cash reserve. With spot prices hovering above the company’s $75,385 cost basis for two weeks, upcoming filings will clarify if this liquidity is intended for active accumulation or not.
Ownership patterns on-chain further clarify this structural shift. Since the end of June, large-scale whale addresses holding between 1,000 and 10,000 BTC have offloaded 50,500 coins. In contrast, the institutional custodial layer, which includes both exchanges and ETF platforms, has increased its holdings by 59,100 BTC.
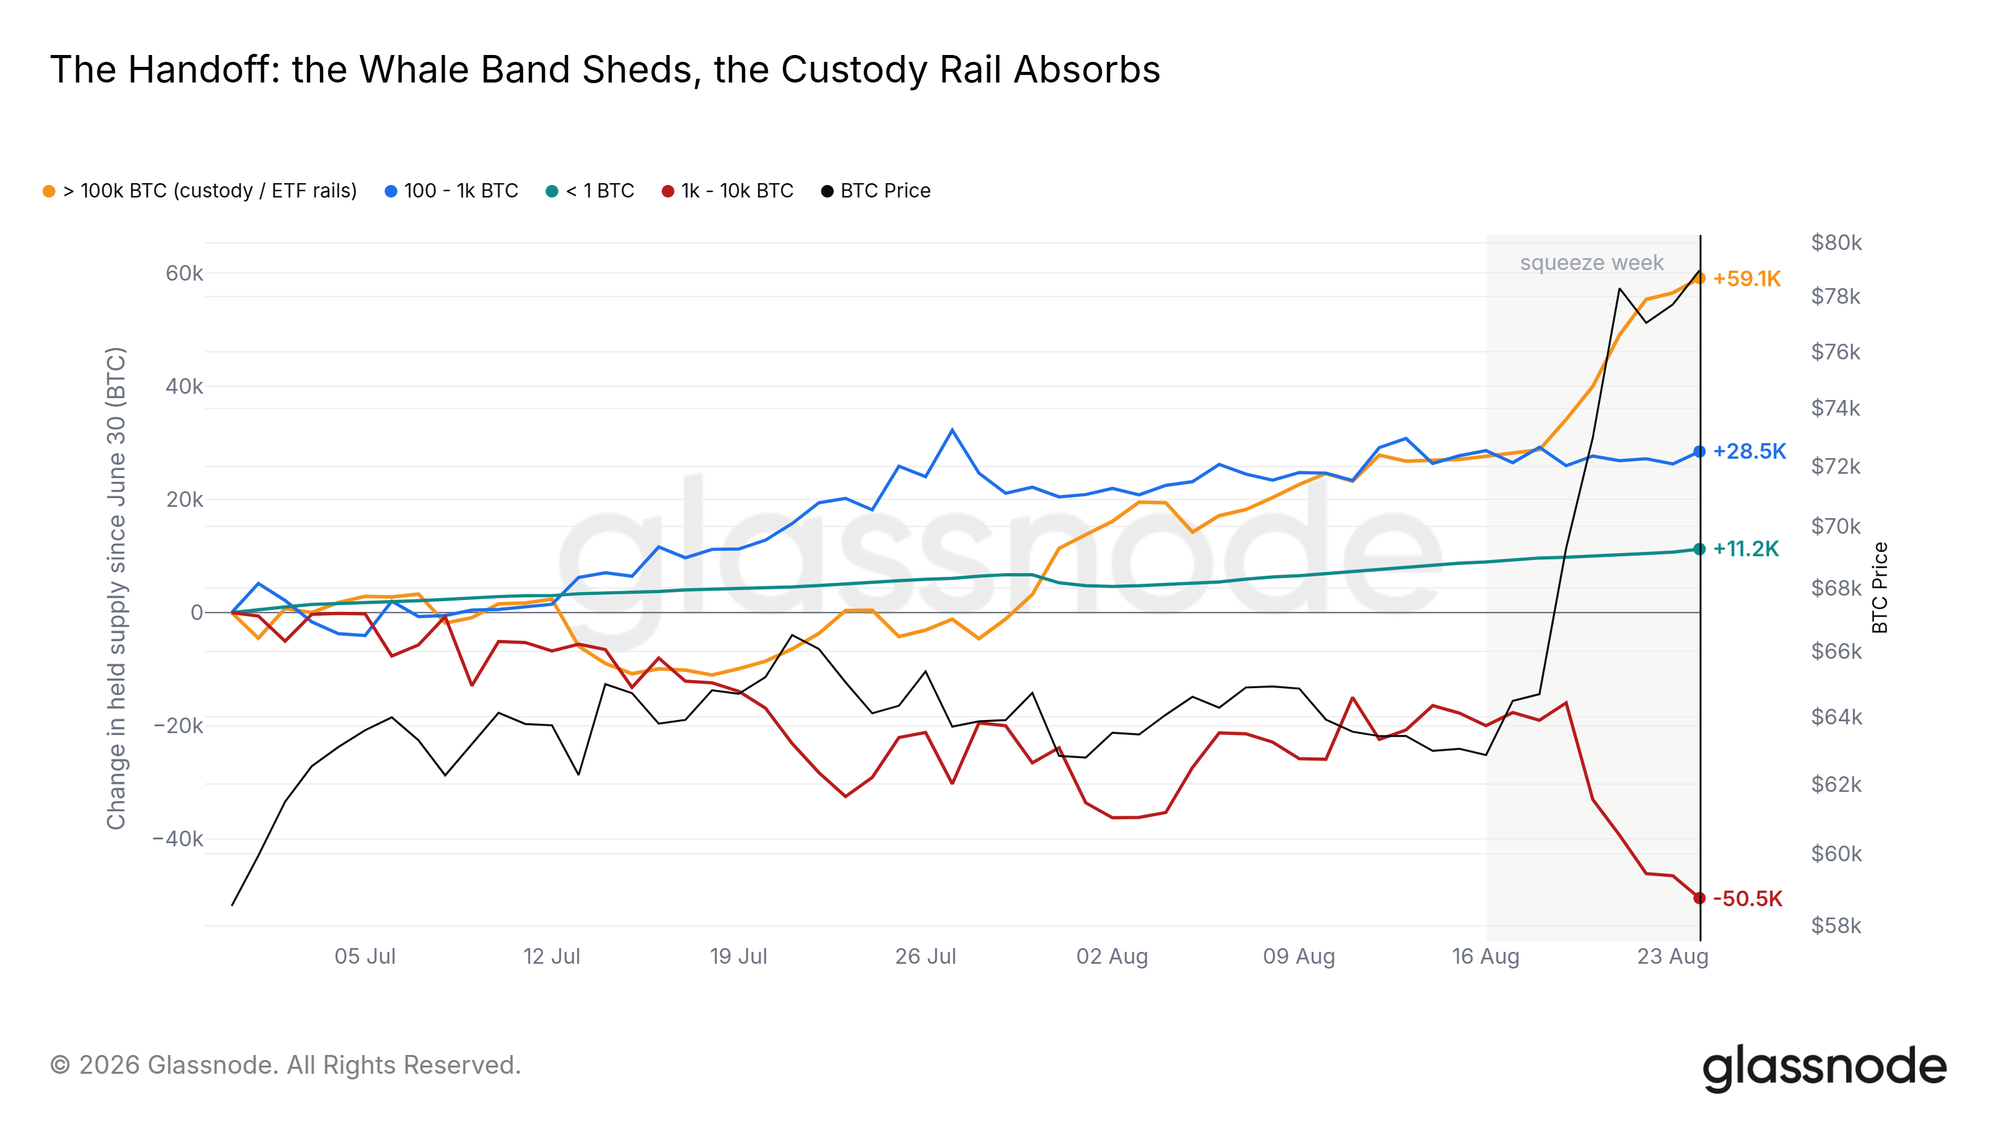
The 31,500 BTC rise in custodial balances during the latest August move higher closely tracks the figures for ETF inflows. While whales took profits during the rally, institutional demand absorbed that supply, indicating that assets moving into these regulated vehicles may be less prone to sudden liquidation on the basis of short-term macroeconomic news. This adds further confidence to our view that despite macro pressure we can expect price to consolidate further, or continue higher unless there is a pullback across all risk assets that drags BTC lower with it.

General Macro Update
Persistent Inflation And Fiscal Deficit Pressures US Bond Yields
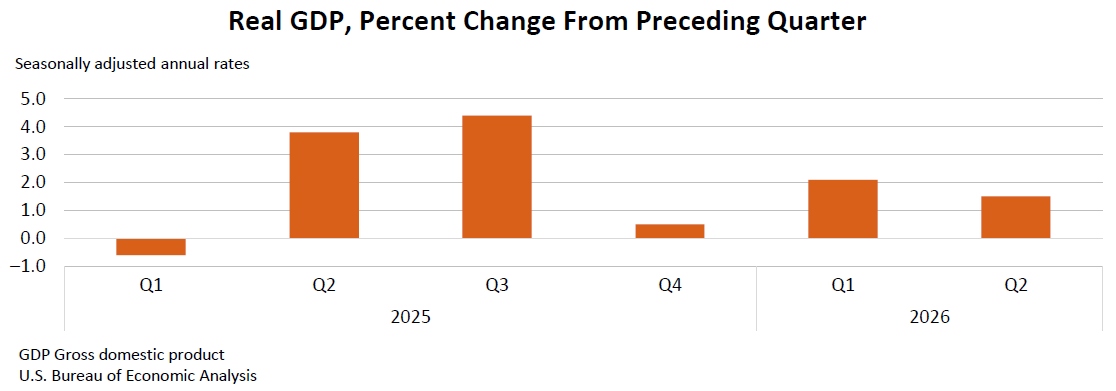
Persistent inflation and a large federal deficit continue to put pressure on borrowing costs and limits the case for easier monetary policy. Underlying economic conditions, however, are stronger than they look. Growth was up 1.5 percent in the second quarter and private sector growth was even stronger, with households and business investment running at 4.2 percent.
Inflation on the other hand, is up 3.7 percent and the deficit has reached $1.8 trillion with two months of the US fiscal year still to run. Recently announced Treasury efforts to restrain long-term yields may therefore have limited effect unless fiscal policy becomes more credible and the Federal Reserve becomes more confident that inflation is returning towards its 2 percent target.
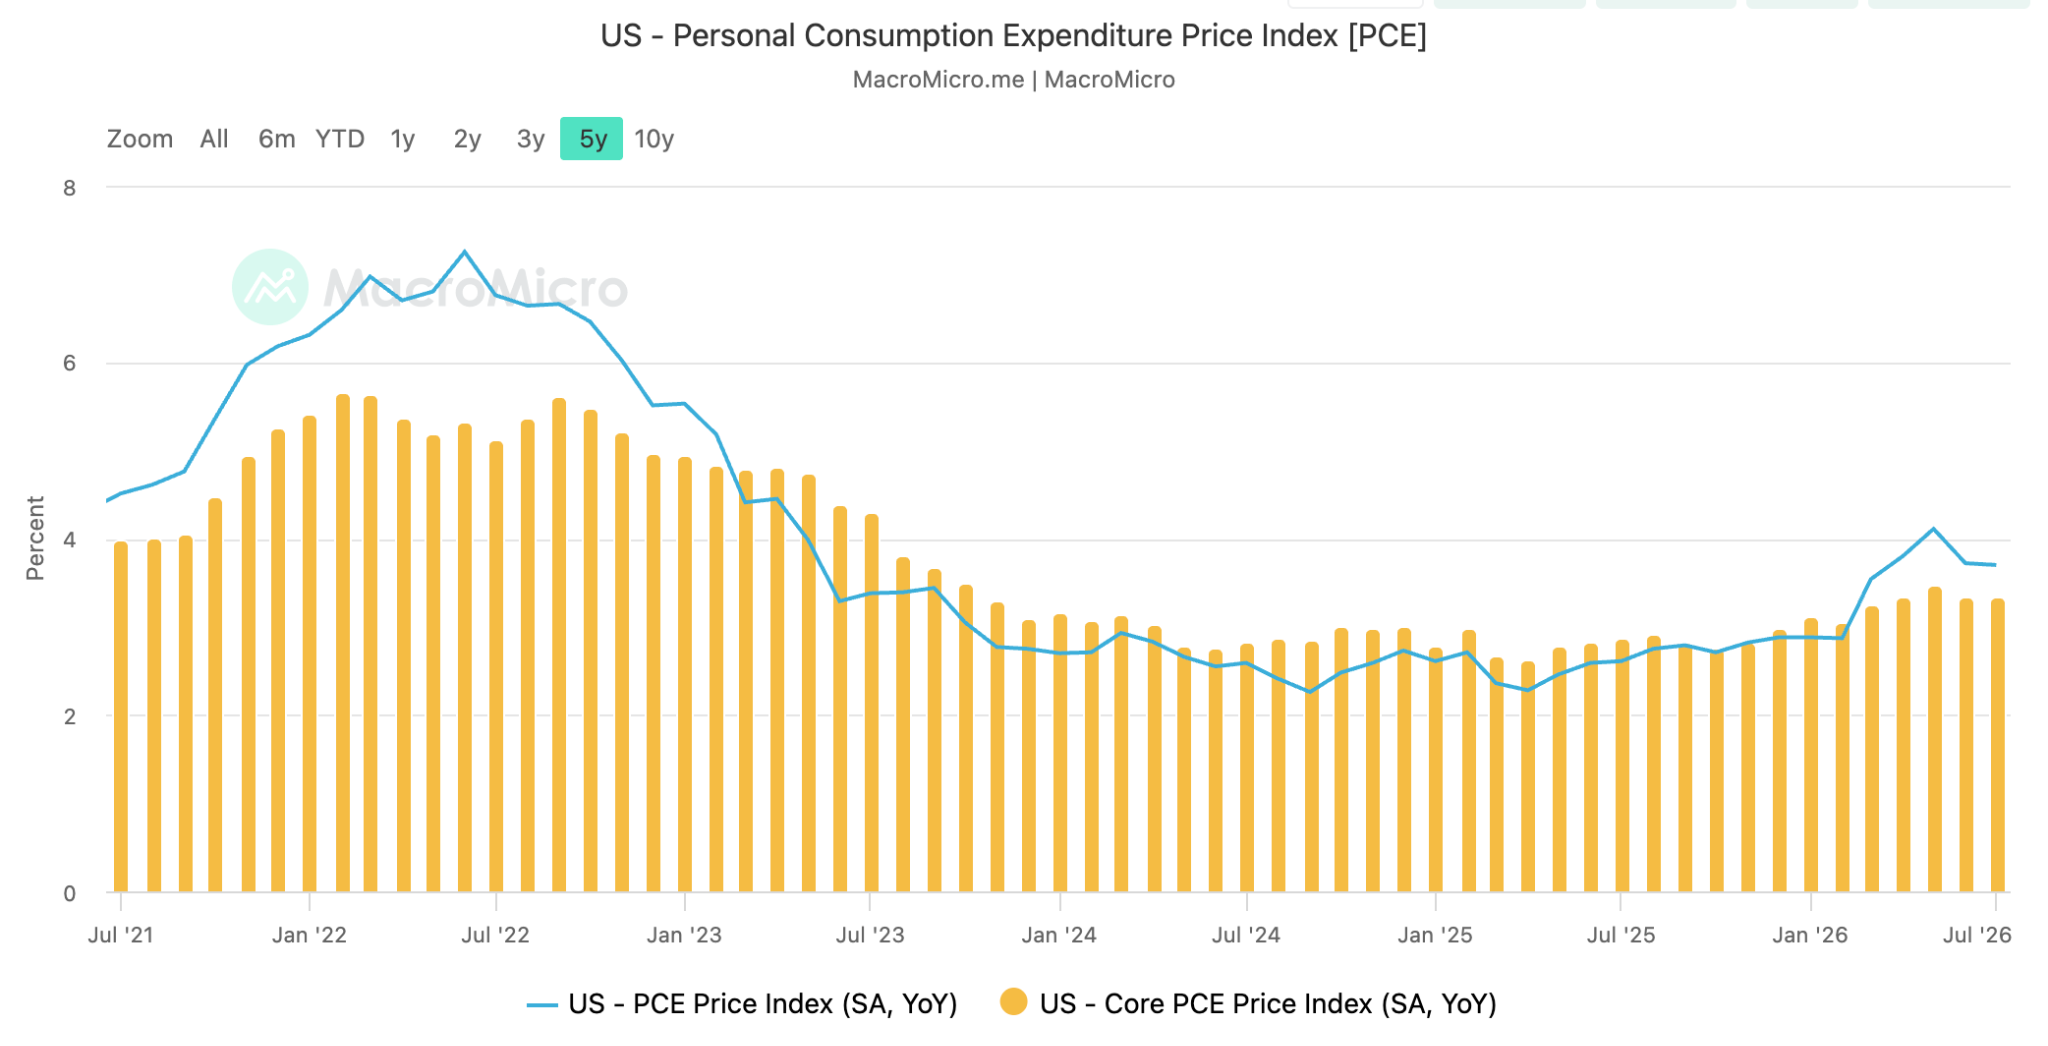
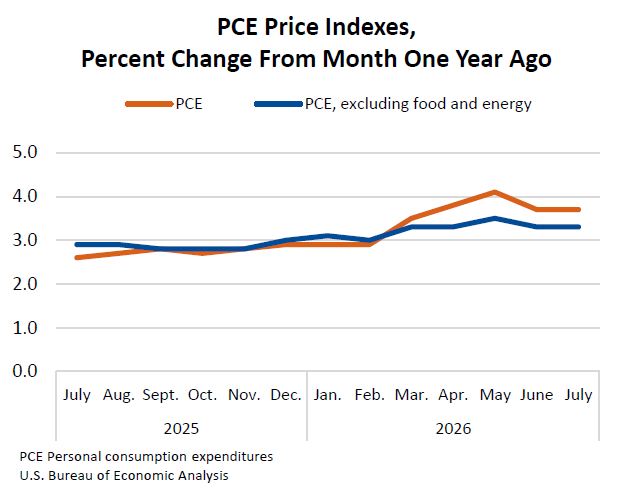
The latest July 2026 Personal Incpme and Outlays report showed that the Personal Consumption Expenditures (PCE) price index rose 0.2 percent during the month and was up 3.7 percent from a year earlier. Core PCE, which excludes volatile food and energy prices, also increased 0.2 percent during the month and was up 3.3 percent on the year.
The Fed follows PCE inflation closely because it provides a broad measure of changes in prices households pay. Both core and non-core measures remain well above the Fed’s 2 percent target.
Price pressure also remains broad. Chain-type PCE measures showed both goods and services prices up 3.7 percent in July, compared to 12 months ago. Food at home prices rose 2.4 percent and energy goods and services increased 15.3 percent in the same period.
Several forces could make further progress on inflation difficult. Tariffs raise the cost of imported goods, while higher energy prices linked to geopolitical conflict can increase transport and production costs. At the same time, investment in artificial intelligence (AI) infrastructure is increasing demand for commodities, equipment and other inputs. Together, these pressures can keep prices elevated even if inflation in some parts of the economy slows.

Household finances also suggest that demand has not weakened sharply. Personal income increased 0.4 percent in July, while disposable personal income rose 0.5 percent. After adjusting for inflation, consumer spending was essentially flat, rising less than 0.1 percent, while real disposable income increased 0.4 percent.
The wider economic picture reinforces that resilience. The BEA’s second estimate of Q2 gross domestic product (GDP), showed that the real rate was up 1.5 percent, with several measures underneath the headline number pointing to stronger domestic activity.
Household spending was revised to a 3.4 percent increase during the quarter, and real final sales to private domestic purchasers rose 4.2 percent, up from the previous estimate of 3.9 percent. That measure excludes trade, government spending and inventory changes and focuses on spending by US households and private businesses, which can provide a clearer view of underlying domestic demand.
Gross domestic income (GDI) also increased 2.2 percent. While GDP measures the value of goods and services produced in the economy, GDI measures the income generated from that production. The two should broadly track each other over time. The stronger GDI reading therefore adds to evidence that the US economy is performing better than the 1.5 percent headline GDP figure suggests. In addition, unlike the private demand metrics above, GDI covers the whole economy, so it is a direct alternative reading of the overall 1.5 percent growth reported, rather than a component of it.
Corporate earnings provide another sign of strength. Corporate profits with inventory valuation and capital consumption adjustments increased by $400.9 billion in the second quarter, compared with an increase of $74.4 billion during the first quarter.
Business investment remains firm as well. The US Census Bureau reported that new orders for durable goods increased 1.1 percent in July. Orders for non-defence capital goods excluding aircraft, which are commonly used as an indicator of future business investment, increased 0.2 percent. Shipments of the same goods, which provide an indication of current capital spending, rose 1.4 percent. The data suggest that investment linked to the expansion of AI capacity remains strong, although the pace could moderate.
The Deficit Is The Other Half Of The Yield Story
This combination of persistent inflation, healthy household demand and strong capital expenditure complicates the outlook for monetary policy. The Fed’s policy rate is currently in a range of 3.5 percent to 3.75 percent. The July data support keeping rates unchanged in the near term, but they provide little evidence that inflation will return to 2 percent without further restraint. That reduces the case for near-term rate cuts and leaves policymakers focused on whether current borrowing costs are restrictive enough to bring inflation down.
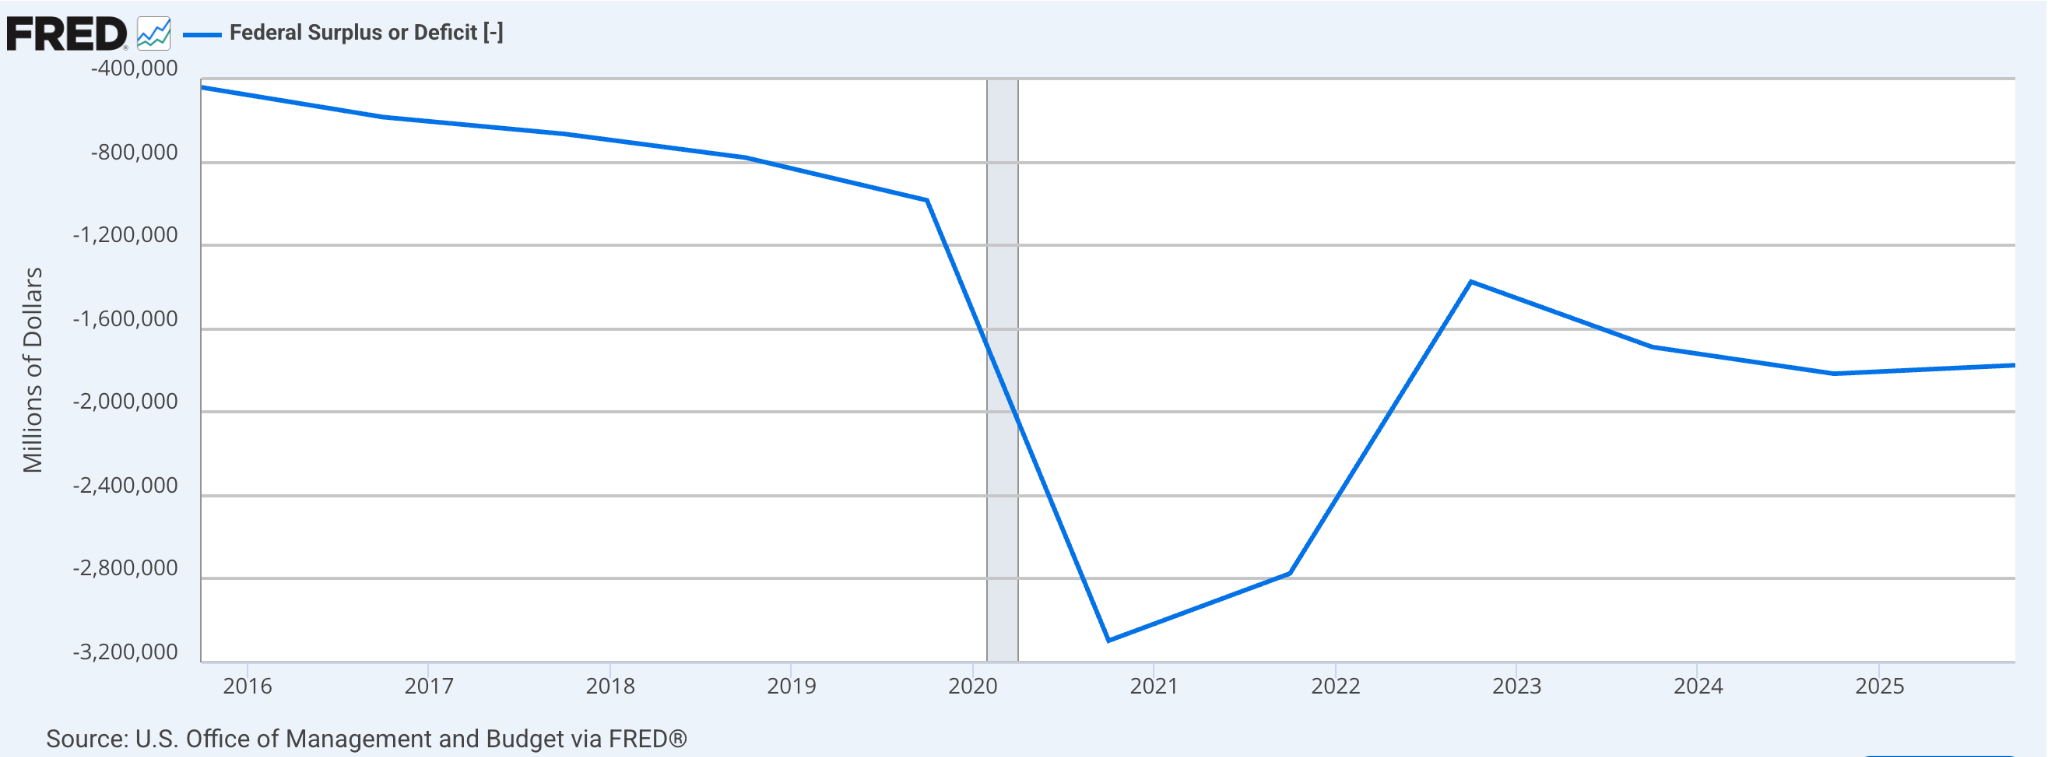
Fiscal policy adds another layer of pressure. The federal budget deficit reached $1.8 trillion in the first ten months of the 2026 fiscal year. The Congressional Budget Office (CBO) also projected that the fiscal year 2026 deficit will be $2.1 trillion, equivalent to 6.4 percent of GDP. That is elevated for any economy, even one that is still expanding, given an unemployment rate of 4.1 percent (although payrolls fell by 23,000 in July).
Large deficits require the government to borrow more money by issuing Treasury securities. When investors have to absorb a larger supply of government debt, they may demand higher yields, particularly if inflation remains above target. Higher Treasury yields can then feed into mortgages, business loans and other forms of credit.
This is why fiscal consolidation has become increasingly important for the bond market. Fiscal consolidation means reducing the government’s budget deficit through slower spending growth, spending cuts, higher tax revenue or a combination of these measures. Without a credible plan to bring borrowing under control, verbal attempts to encourage lower yields are likely to have limited influence on investors.
Why Verbal Intervention Has Not Worked
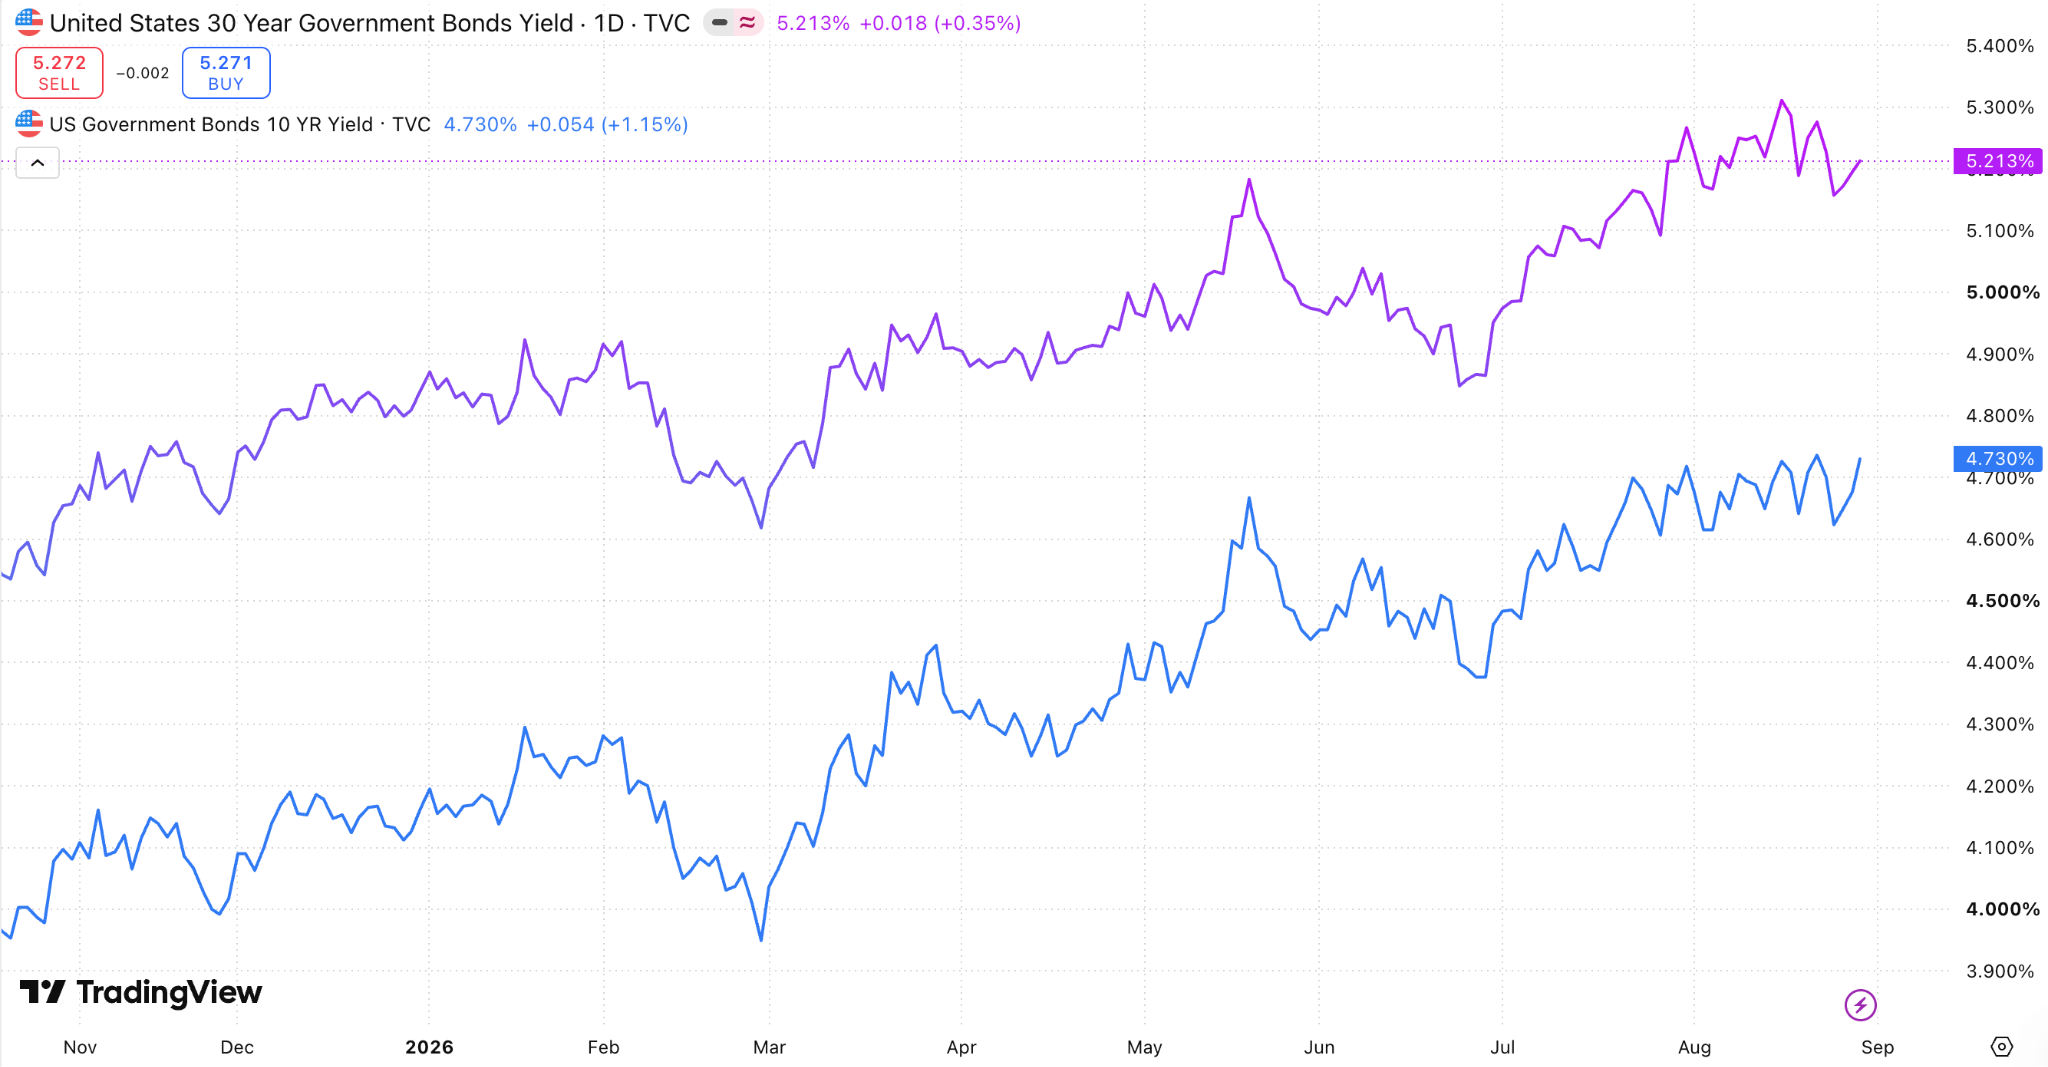
US Treasury Secretary Scott Bessent said that buyback operations could run to more than $4 billion per issue and that, in his words, “we believe that the yields don’t reflect the underlying fundamentals.” He urged investors to look through headline moves in a thin late-summer market. The impact of his words on the market however, has been limited. The announcement on 19 August pulled the 30-year down just nine basis points from the 19-year high of 5.31 percent it had set two days earlier.
The Treasury has also signalled that it could use part of the roughly $950 billion held in the Treasury General Account to support its planned bond buyback programme. The Treasury General Account is effectively the US government’s main operating cash account. A bond buyback allows the Treasury to repurchase outstanding government securities and can help improve market liquidity, although it leaves the government’s underlying financing needs in place.
What the Treasury has actually committed to is smaller than the cash balance implies. Its August refunding statement authorised up to $38 billion of liquidity support buybacks and up to $25 billion of cash management buybacks for the August to October quarter, against a cash balance it expects to peak near $1.05 trillion in late October. No official estimate has been published of how much of that balance could be redirected into repurchases and drawing it down materially would reduce the cash available to the government if a genuine financial emergency develops.
The broader issue is credibility. Treasury intervention alone cannot sustainably control long-term interest rates when inflation remains above target and fiscal deficits remain large. Direct control of the yield curve would also require cooperation from the Fed, creating a potential conflict with the central bank’s effort to restore price stability.
The economic data therefore point in the same direction as the bond market. Domestic demand remains resilient, business investment remains firm and inflation remains too high for policymakers to assume that price pressure will fade without further restraint. In addition, continued fiscal deficits increase the supply of government debt and make it harder for Treasury officials to push borrowing costs lower through communication or buybacks alone.
For long-term yields to fall in a sustained manner, investors will likely need clearer evidence on two fronts: inflation must move convincingly towards the Fed’s 2 percent target and fiscal policy must show a credible path towards smaller deficits.
Until those conditions improve, strong domestic demand and heavy government borrowing are likely to keep upward pressure on US borrowing costs.

Warsh Makes The 2 Percent Target A Hard Target
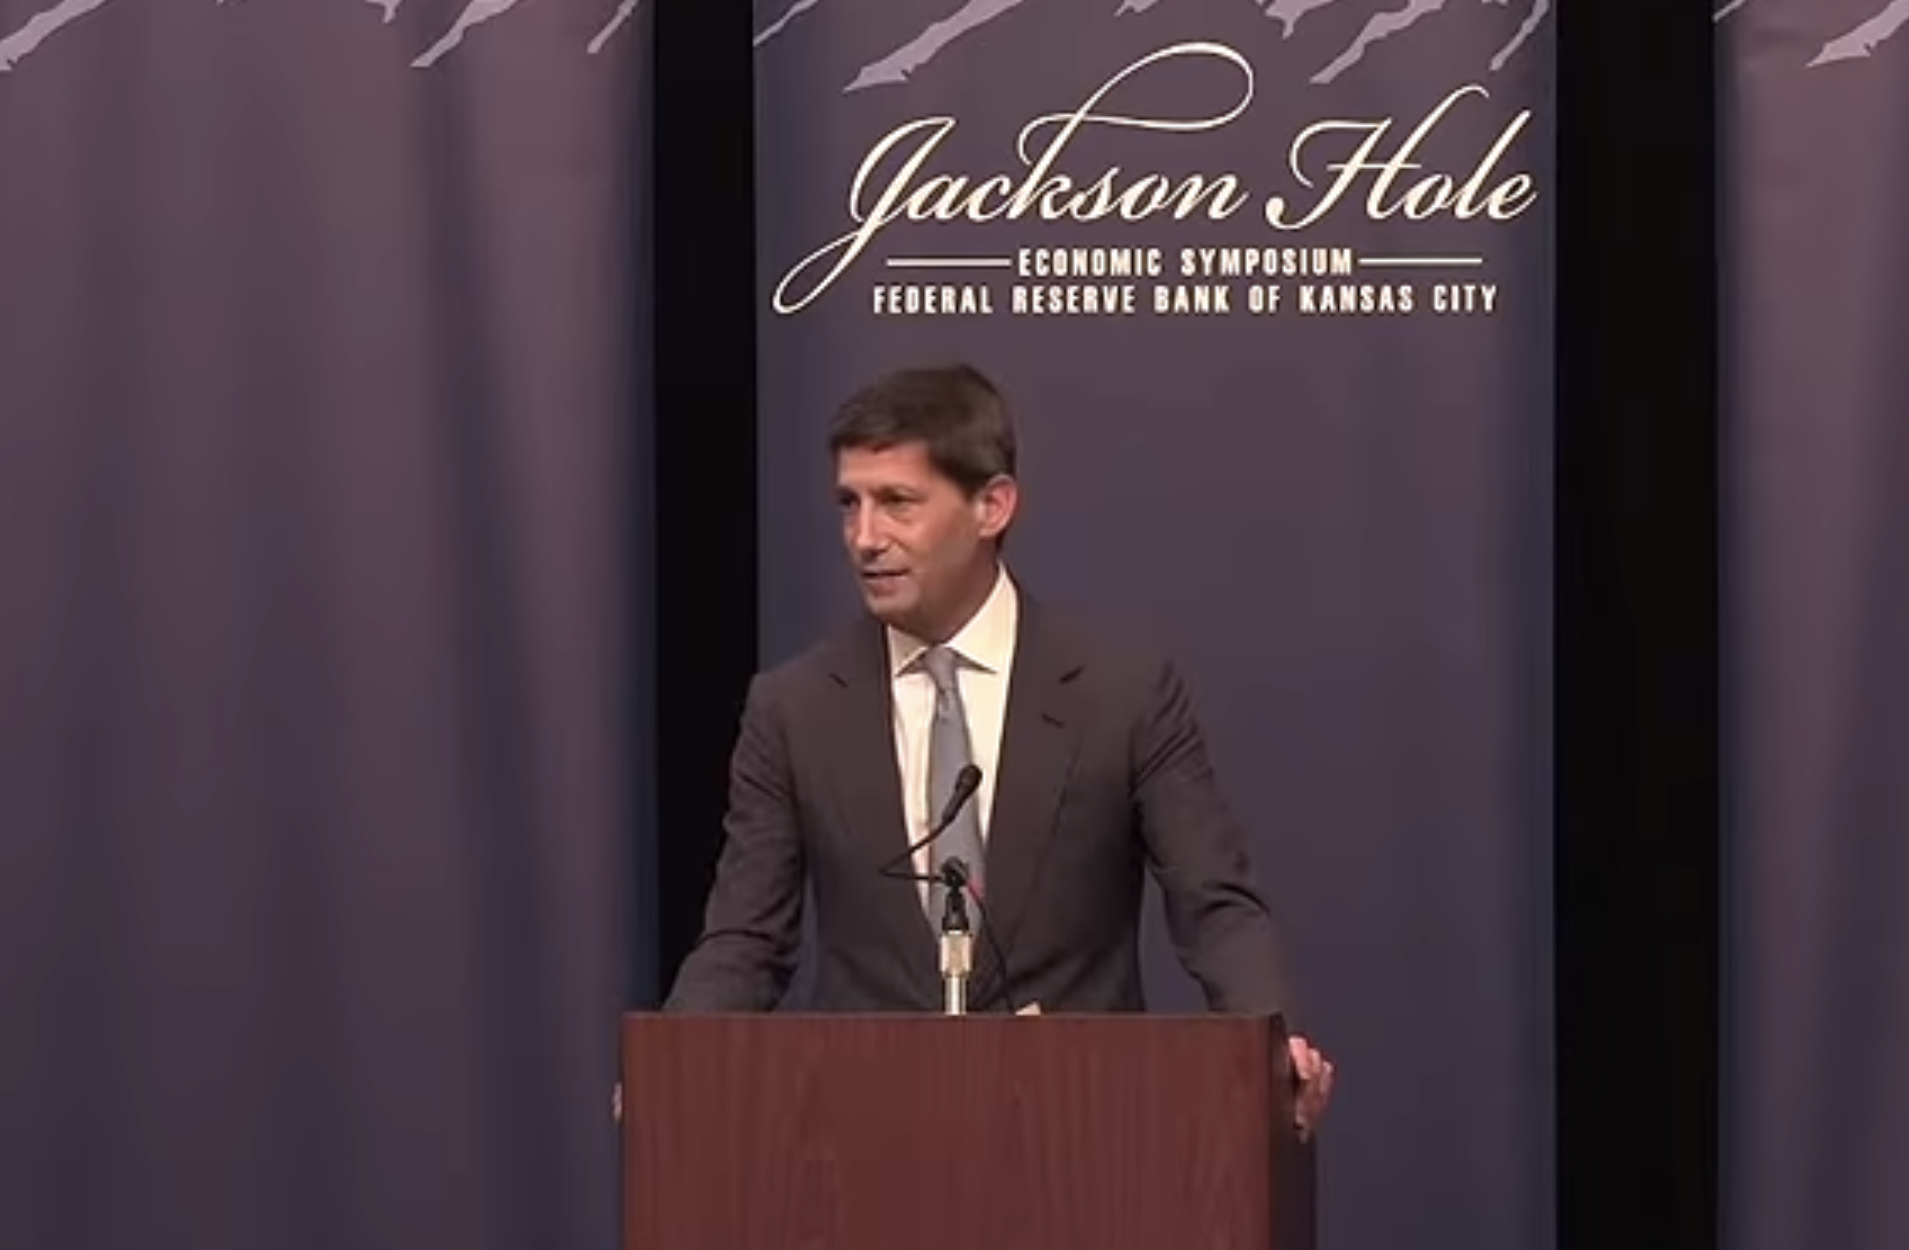
The view of the bond market that persistent inflation and heavy borrowing means long-end yields need to stay relatively high, won endorsement last Friday from Fed Chair Kevin Warsh, who used his first Jackson Hole address to confirm that the battle against inflation was not over. The market responded by removing a September cut from its pricing of interest rate expectations. As of last Friday, Fed funds futures now attach zero probability to an easing of rates at the next Federal Open Market Committee (FOMC) meeting on 16 September, assigning 43 percent probability of a a hold and 57 percent to a quarter-point increase. The 2-year Treasury yield rose 14 basis points following his speech, while the 30-year rose just three basis points.
A Higher Bar Has Been Set
Warsh said the Fed “must be confident that underlying inflation is moving to our objective, clearly and at sufficient speed”. He called the 2 percent target firm and fixed and accepted the institution’s responsibility for what he described as 65 months of sustained, elevated inflation.
In addition, he indicated that the evidence of a meaningful fall in inflation needed to be reflected across a range of indicators. He noted that 54 percent of the components of the PCE price index rose more than 3 percent over the past year, against a post-pandemic peak of 77 percent and a pre-pandemic norm of 32 percent.
In the previous Fed framework, there was a tolerance for inflation going above target if the direction of travel was credible. Warsh said he now wants to ensure there is market confidence in the level of inflation, judged on the width of indicators providing a consistent message. This will mean that it will take longer to demonstrate meaningful progress on inflation than just relying on improving headline prints.
Policy May Not Be Restrictive Enough
Warsh did not use the word increase. His message was more consequential, because he described an economy that can absorb one. As we indicated in the previous chapter, demand, income and profit data all show an economy running at or above trend, with private domestic demand at 4.2 percent and headline inflation at 3.7 percent. At the last Fed meeting it was clear that certain FOMC members were already asking whether a policy rate of 3.5 to 3.75 percent is a sufficient restraint on inflation, and with three members dissented against keeping rates where they are, in favour of a quarter-point increase.
Warsh also removed the tool that would have softened the message, arguing that publishing forecasts to illustrate the Fed’s reaction function works “better in theory than in practice, better in the lab than in the field”. He prefers a committee that will not pre-commit to their views on rates so that they are more free to react to ongoing evidence of the state of the economy before they cast their vote.
The asymmetry is the practical point. A fall in rates needs the evidence of a convincing narrowing in a wider breadth of price indicators in the economy, and is not dependent on just a single release. In contrast, an increase in rates needs only a committee judgement that policy is not restrictive enough, which the activity data already supports. Cuts have therefore moved further away, while the prospect of increases have moved closer.
The Front End Repriced
The implied probability of a quarter-point increase moved rapidly from 35 percent on Thursday 27 August to 60 percent on Friday 28 August, following Warsh’s remarks, before settling at 57 percent. The prospect of any easing of rates is now zero. The contrast with the July minutes is striking. Although the minutes also leaned hawkish, two-year treasuries did not move at all. Warsh’s comments moved it 14 basis points in a single afternoon.
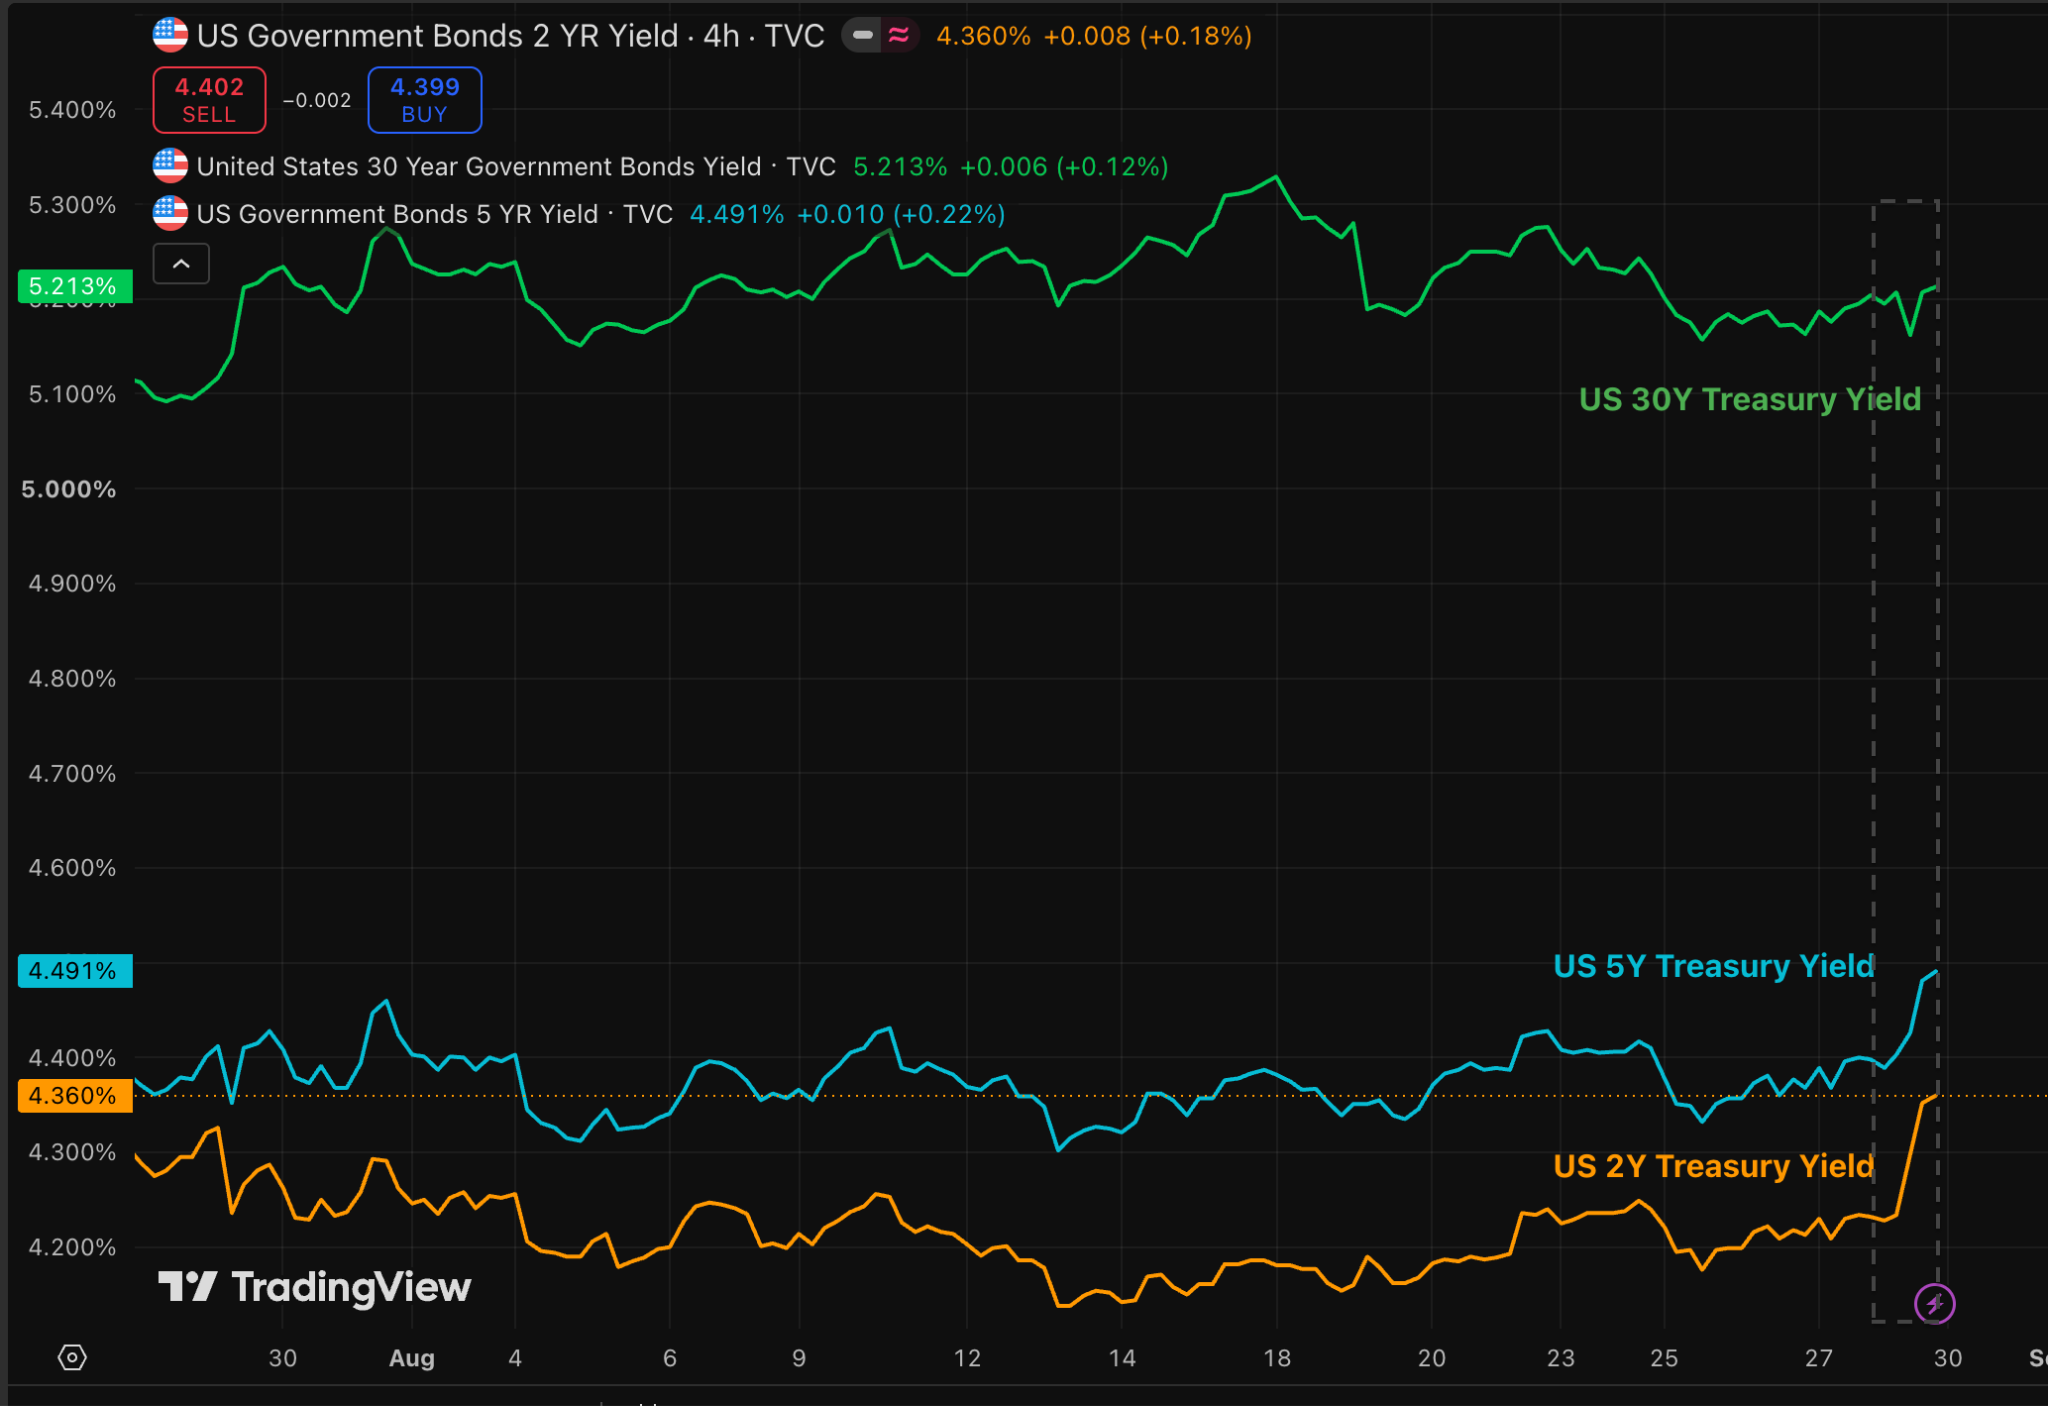
The two-year closed at 4.34 percent on 28 August against 4.2 percent the day before and the five-year rose 10 basis points to 4.48 percent, while the 30-year rose three basis points to 5.22 percent and finished the week a basis point below where it started. The 10-year inflation-protected real yield rose eight basis points to 2.42 percent, reflecting demand for higher real return not a changed inflation forecast.
What The Labour Market Will Allow
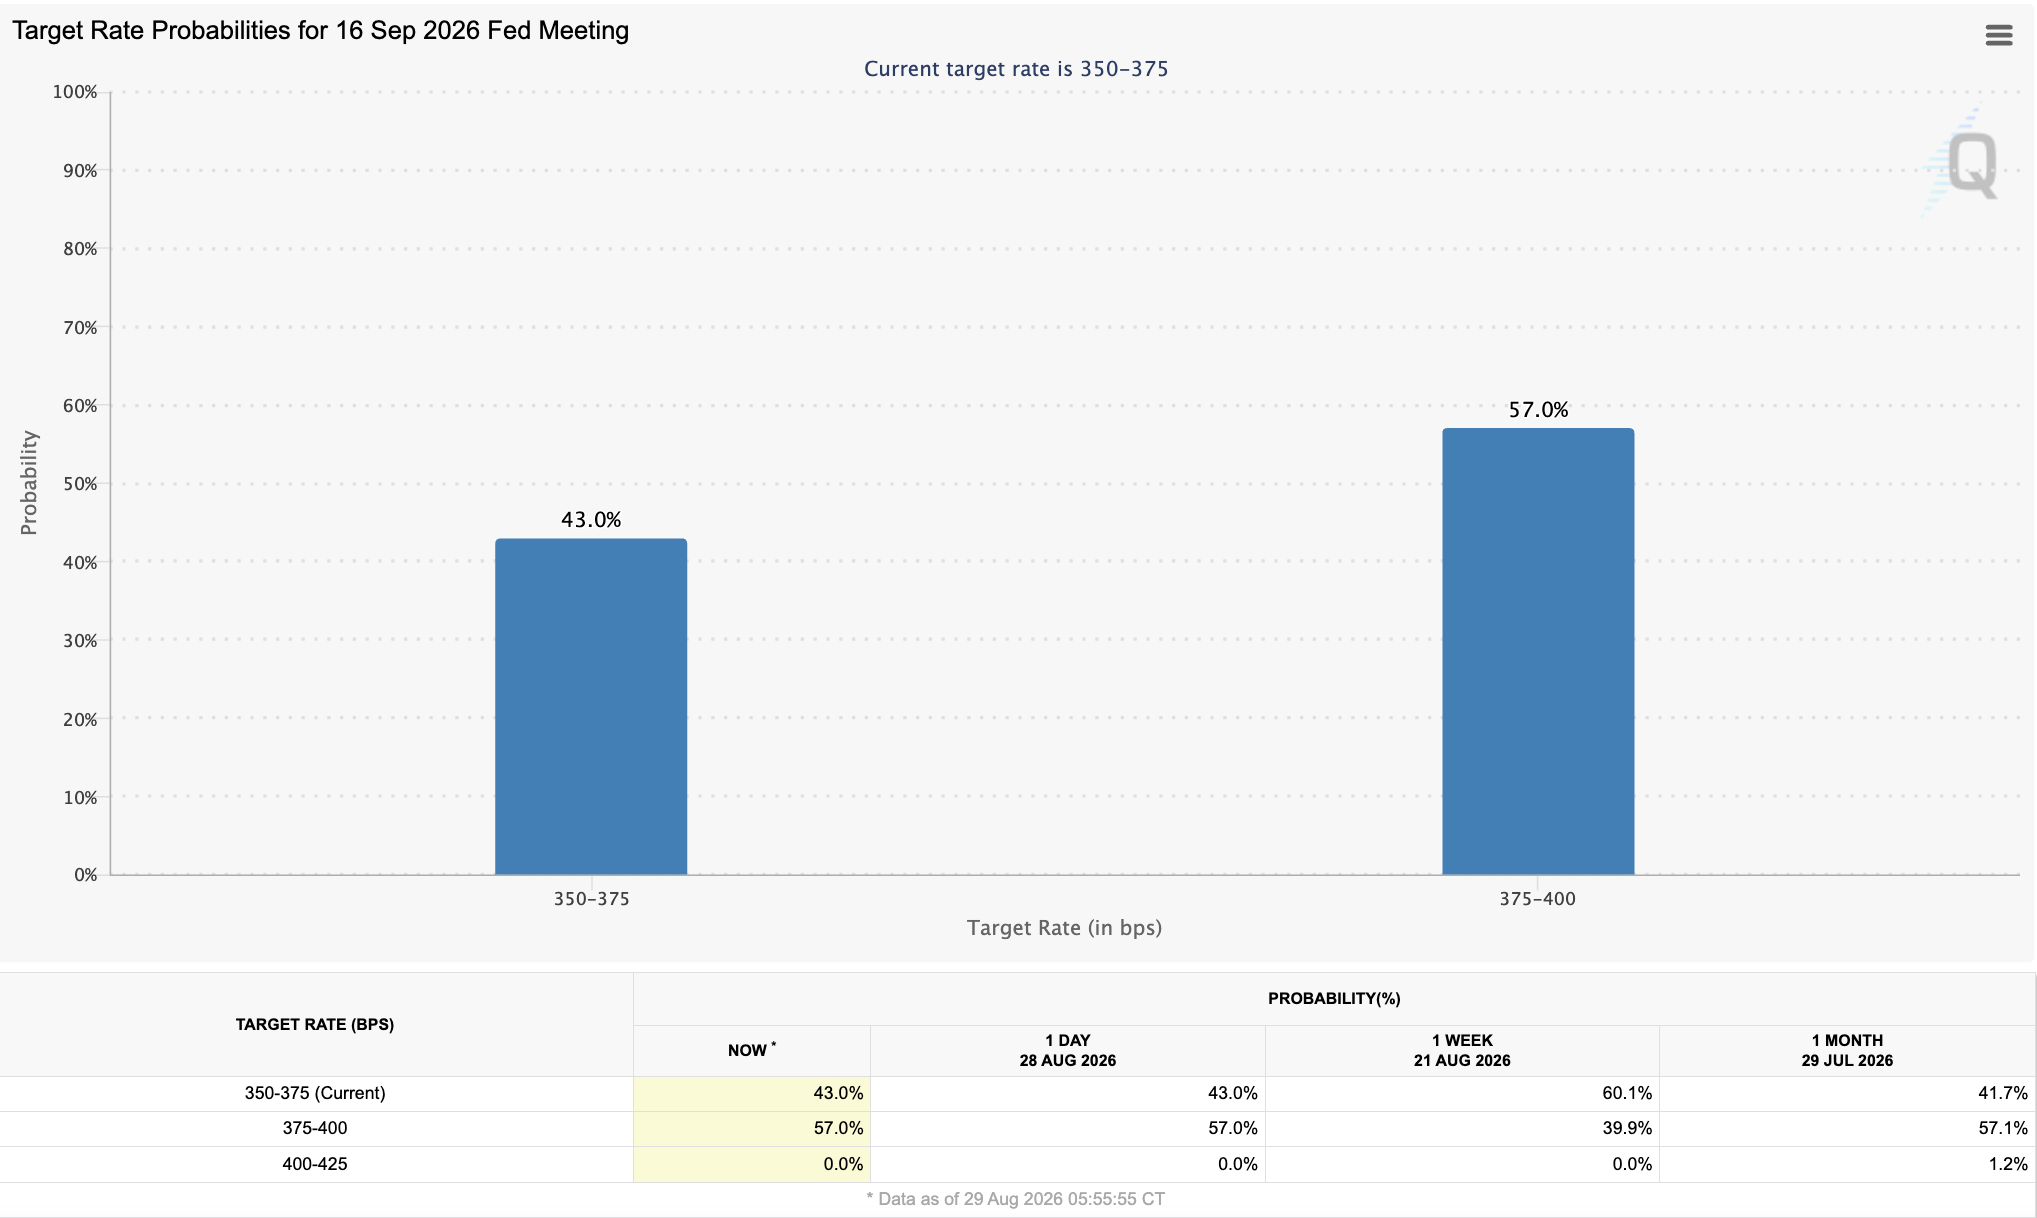
Employment however remains an important constraint on monetary policy. Initial jobless claims fell to 203,000 in the week ending 22 August, indicating that firms are holding onto staff. Hiring has also stalled: payrolls fell by 23,000 in July with the unemployment rate at 4.1 percent. The Bureau of Labor Statistics also reported in its preliminary benchmark revision that employment through March 2026 had been overstated by 79,000. Low layoffs mean an increase in rates would not obviously break anything this quarter. Flat hiring, real consumer spending that was essentially flat in July and a University of Michigan sentiment index at 51.7 in the August reading provide a little cushion if rates do rise.
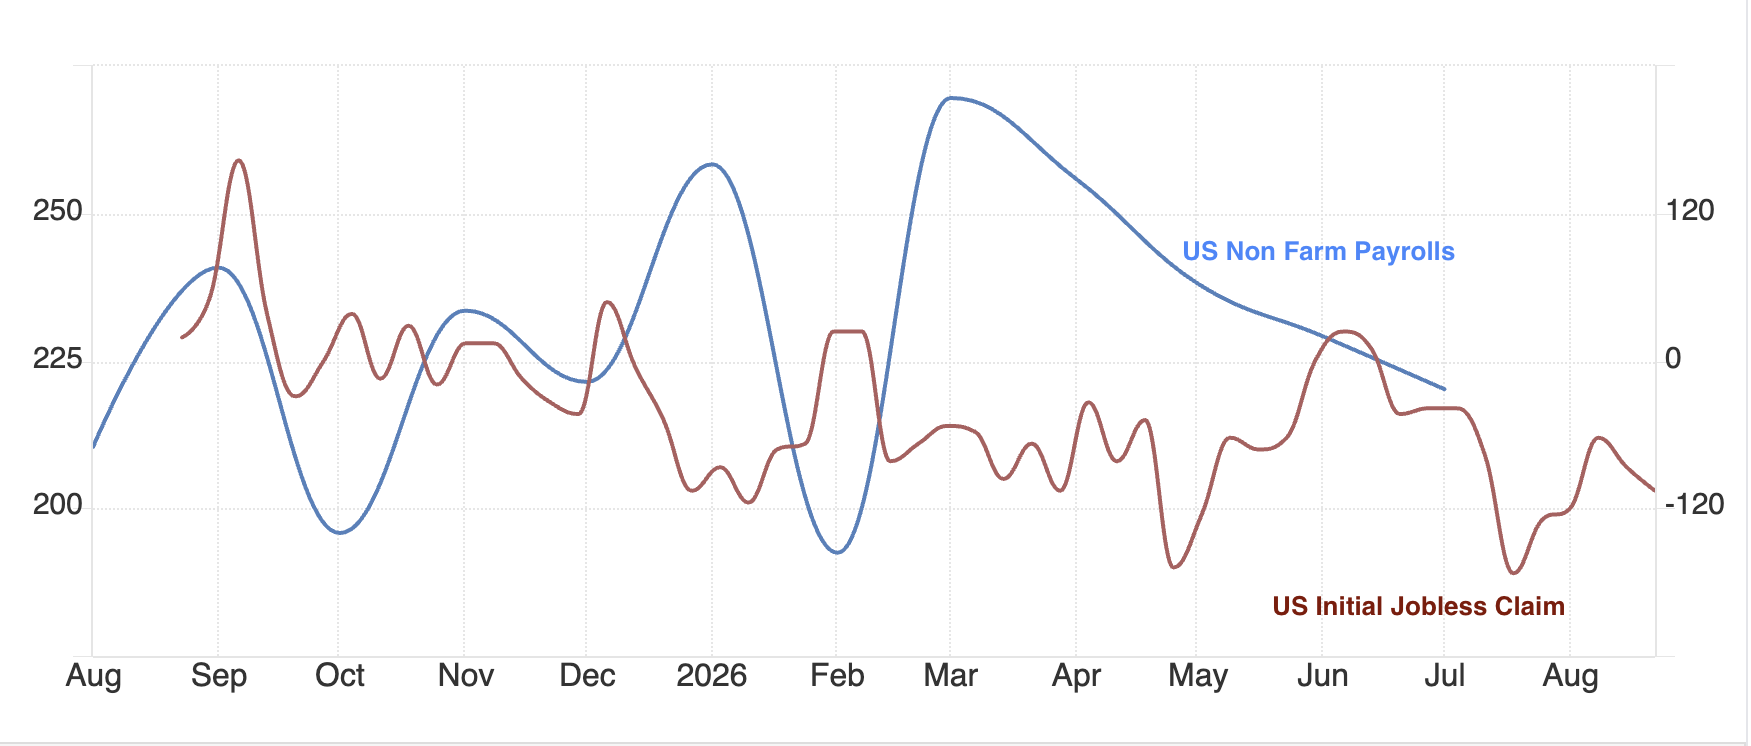
That leaves the September decision genuinely open. The market puts a rise at 57 percent, three of the 12 voters backed one in July and Warsh has told markets not to expect guidance. However price increases have to be narrowing across the basket, before there is any progress on inflation. We now look forward to the August jobs report on 4 September and the August inflation print (Consumer Price Index) that follows on 11 September.
Either way, it is worth being clear about where a rise would have impact. As we showed in the previous edition of Bitfinex Alpha, interest rate moves have an increasingly muted effect on the economy. Even in housing, it is less impactful, and for crypto, it sits at the very end of the chain.
Why This Matters for Crypto
In the final week of August, Bitcoin failed to hold above $81,000 and fell roughly 4 percent last Friday, reaching a low of $76,857.
Capital, however, has continued to enter the market. The US spot Bitcoin Exchange Traded Fund complex (ETF) recorded about $924.5 million in inflows across the five trading sessions from 24 to 28 August. Stablecoin supply has also increased by around $1.4 billion during the same period, to $304.59 billion.
Last week, we argued that crypto responds more to actual liquidity entering the market than to expectations about interest rates. In the last few days, the market has showed that the relationship is more nuanced. New liquidity may help support prices, but expectations for higher interest rates can still limit how far the market can rise. Warsh’s Jackson Hole comments on Friday last week, helped to make the point more clearly. The day he indicated that rates may have to rise, was the day the inflows streak broke.
The key signal now is whether Bitcoin ETF inflows and stablecoin supply continue to rise for a full week while markets put the probability of a rate increase above 50 percent.
What Would Prove This Wrong
Our view is that the pressure on the long end is fiscal in origin, that the September decision turns on the two data releases still to come and that incoming liquidity supports cryptocurrencies, although any upward re-pricing at the front end can restrict price appreciation.
None of the falsifiers that we listed last week fired cleanly. Two resolved in the framework’s favour. New home sales fell 10.5 percent and spot bitcoin ETFs took in money for four of five sessions. The one that came closest is the view on rates.
The implied probability of a September increase goes above 60 percent through both the 4 September jobs report and the August inflation print. That would mean the Jackson Hole speech settled the meeting on its own and the data did not matter. Interest rate probabilities rose to 57 percent on 28 August, having sat near 35 percent the day before.
The 30-year yield makes a new high above 5.31 percent while the enlarged buyback operations run, or the first $4 billion operation on 9 September fails to have the desired effect the Treasury cited when it expanded the programme. It closed at 5.22 percent on 28 August and did not move on Warsh’s speech.
The 10-year Treasury Inflation-Protected Securities (TIPS) real yield holds above 2.5 percent for two consecutive weeks. It rose eight basis points on the speech to 2.42 percent, leaving it eight points from the line.
Initial jobless claims exceed 230,000 for two consecutive prints. They fell to 203,000 in the week ending 22 August, moving further away from the line.
US spot Bitcoin ETFs post a week of net outflows, or the stablecoin float resumes shrinking through September. Both moved the other way this week.
Capital goods import prices, the line that carries computers, semiconductors and machinery, flatten for a second consecutive month, which would break the AI inflation channel. The August read lands in mid-September.
The 4 September payrolls report and the August inflation print decide the meeting. The first enlarged buyback operation on 9 September decides whether the long end is still ignoring the Fed.