

Issue #222:
BTC Poised to Move on Fed Decision
Selling Pressure Fades as Macro Risks Rise
Bitcoin’s recent consolidation reflects a market with limited selling pressure but insufficient demand to sustain a breakout. Meanwhile, higher energy costs, rising real yields and weakening consumer confidence are creating a more difficult macroeconomic backdrop ahead of the Federal Reserve’s 16 September decision on rates.
Bitcoin (BTC) has remained within a 5.5 percent range for more than 24 trading sessions, with approximately 840,000 BTC carrying a cost basis inside that band. Profit-taking has slowed substantially: the Sell-Side Risk Ratio has fallen to seven basis points, placing realised selling pressure among its lowest levels of the past year. Yet subdued supply has failed to attract aggressive buying. Leverage has accumulated around both the upper and lower trading boundaries, with an estimated $1.95 billion in potential short liquidations near $82,000 and a broader concentration of vulnerable long positions between $75,000 and $76,000. These concentrations could amplify price moves around the policy announcement.
The current constraint on macroeconomic conditions is the prospect of sustained monetary tightening. August consumer and producer prices both rose 0.4 percent month on month, driven largely by energy. Although annual headline inflation remained at 3.4 percent and annual core inflation eased to 2.4 percent, the monthly acceleration has reinforced expectations of a rate increase. Futures price an 88.5 percent probability of a 25-basis-point rise this week. With the 10-year real Treasury yield reaching 2.55 percent, financial conditions have already tightened, raising the opportunity cost of holding BTC. The Fed’s projections from the meeting will be significant for whether markets anticipate a single increase or further tightening.
The energy shock is also threatening to extend beyond fuel prices. Brent crude is now well over $100 per barrel, while US retail diesel rose to $5.65 per gallon, increasing cost pressures across freight, agriculture and distribution. Strategic petroleum reserves have declined to 285.4 million barrels, reducing the emergency cushion. Consumer sentiment has weakened as a result, with year-ahead inflation expectations rising to 4.6 percent and longer-run expectations edged up to 3.4 percent. This combination complicates the Fed’s response: tighter policy can restrain demand, but cannot restore disrupted energy supplies.
The central conclusion is that for BTC, even though there is a reduction in selling pressure in the market, this alone is insufficient to support a sustained recovery. A stronger demand response must contend with elevated real yields and persistent energy costs. The Fed’s guidance, subsequent movements in real yields and evidence of easing fuel pressures will help determine whether the current range resolves into a durable move or further volatility.

Market Signals
Leverage Builds at Range Extremes
BTC has traded within a 5.5 percent range over the last 24 trading sessions. As highlighted in the 9 September Intelligence Update, approximately 840,000 BTC have a cost basis within this range.
This puts a relatively large amount of BTC supply in flux, with moves of even a few basis points potentially shifting a meaningful amount of supply from profit to loss. In turn, this is triggering increased market participation at the range extremes where leverage is building.
One important consideration to note, however, is that volume traded at both the upper and lower boundaries remains significantly lower than nearer the centre of the range. This suggests that price continues to trade around “fair value” from a volume-profile perspective.
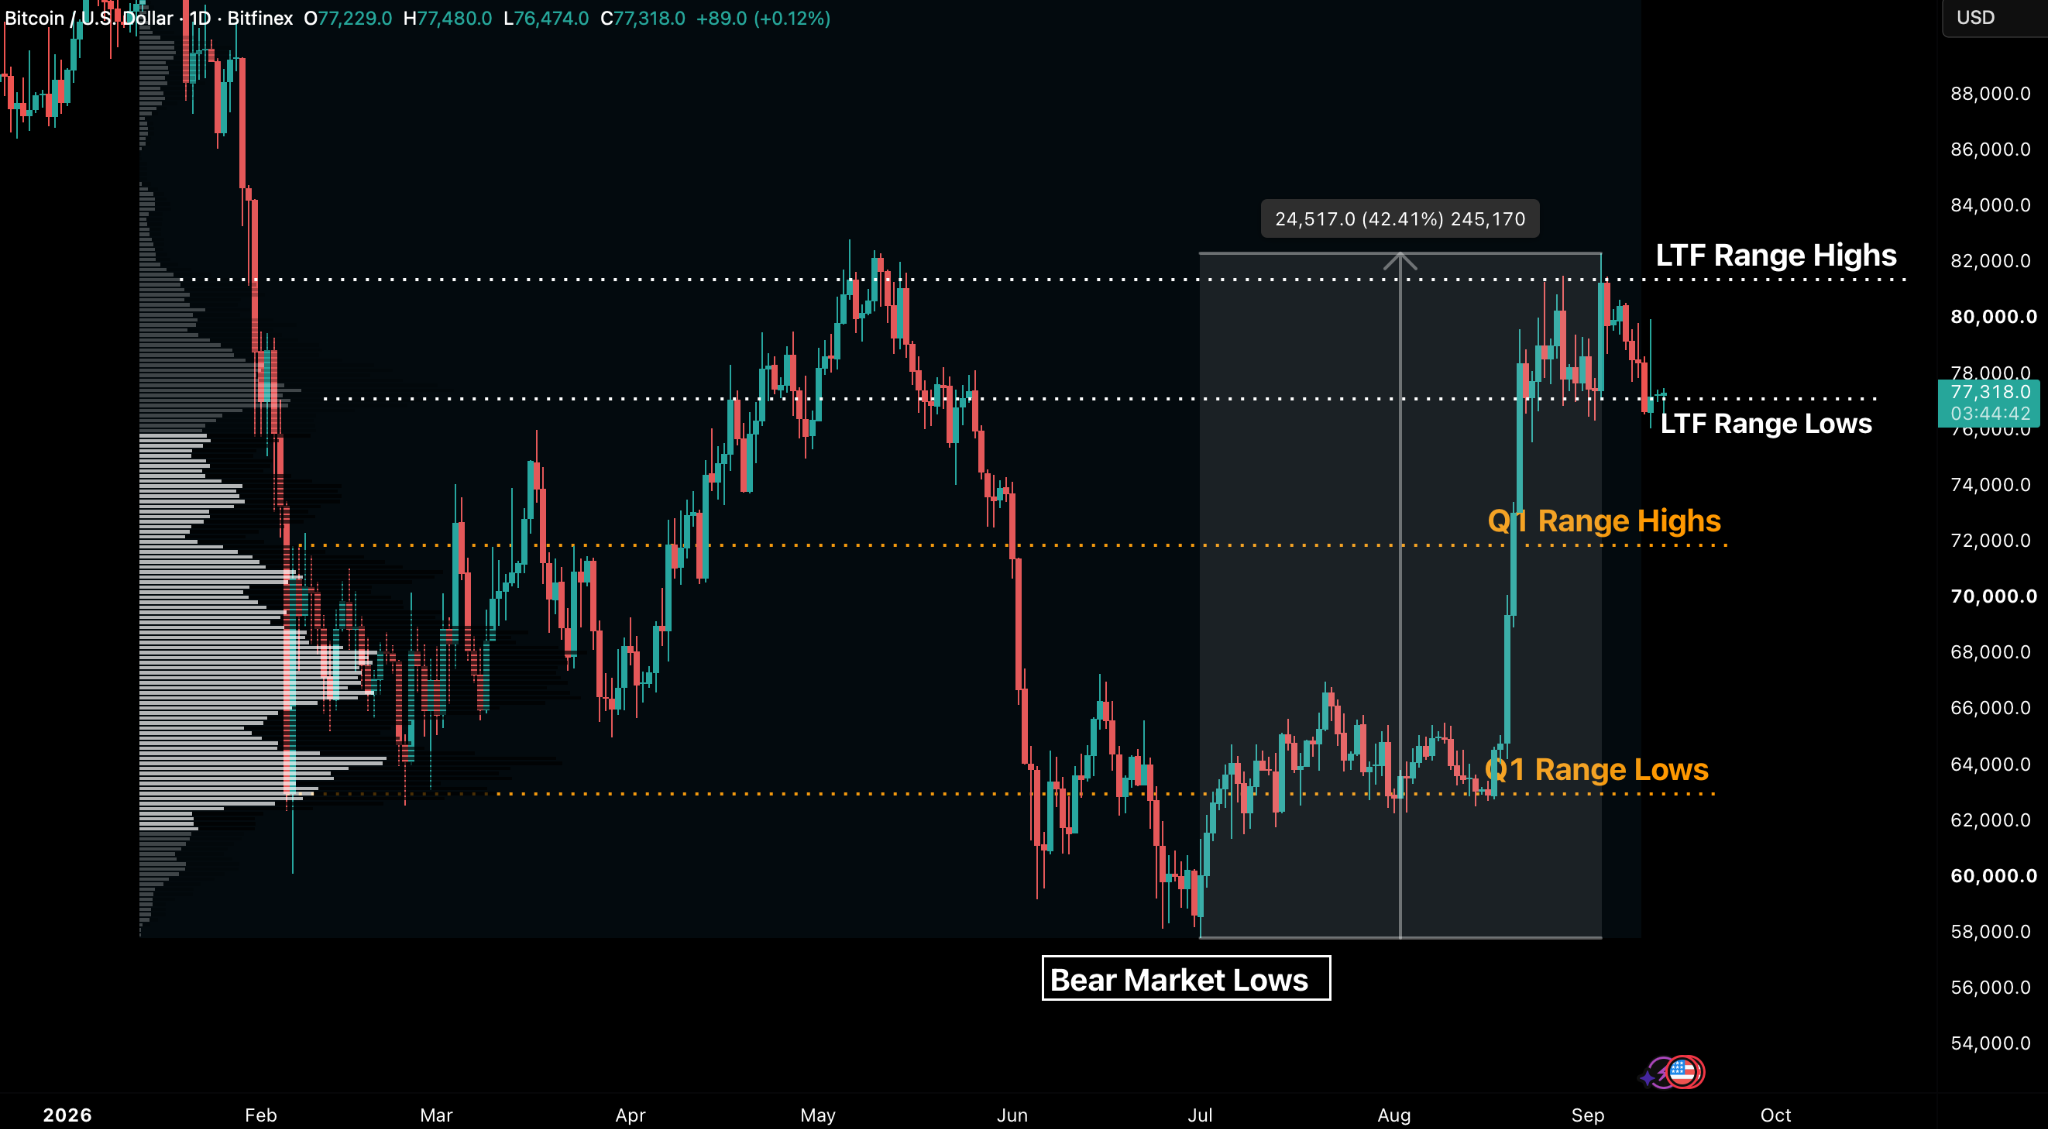
The ascent towards the $81,300 resistance level encountered minimal sell pressure in early September, a pattern that has continued on subsequent attempts to move past $80,000. However, there has also been no aggressive bid to drive BTC higher, leaving price stalled near the range lows on extremely low volumes.
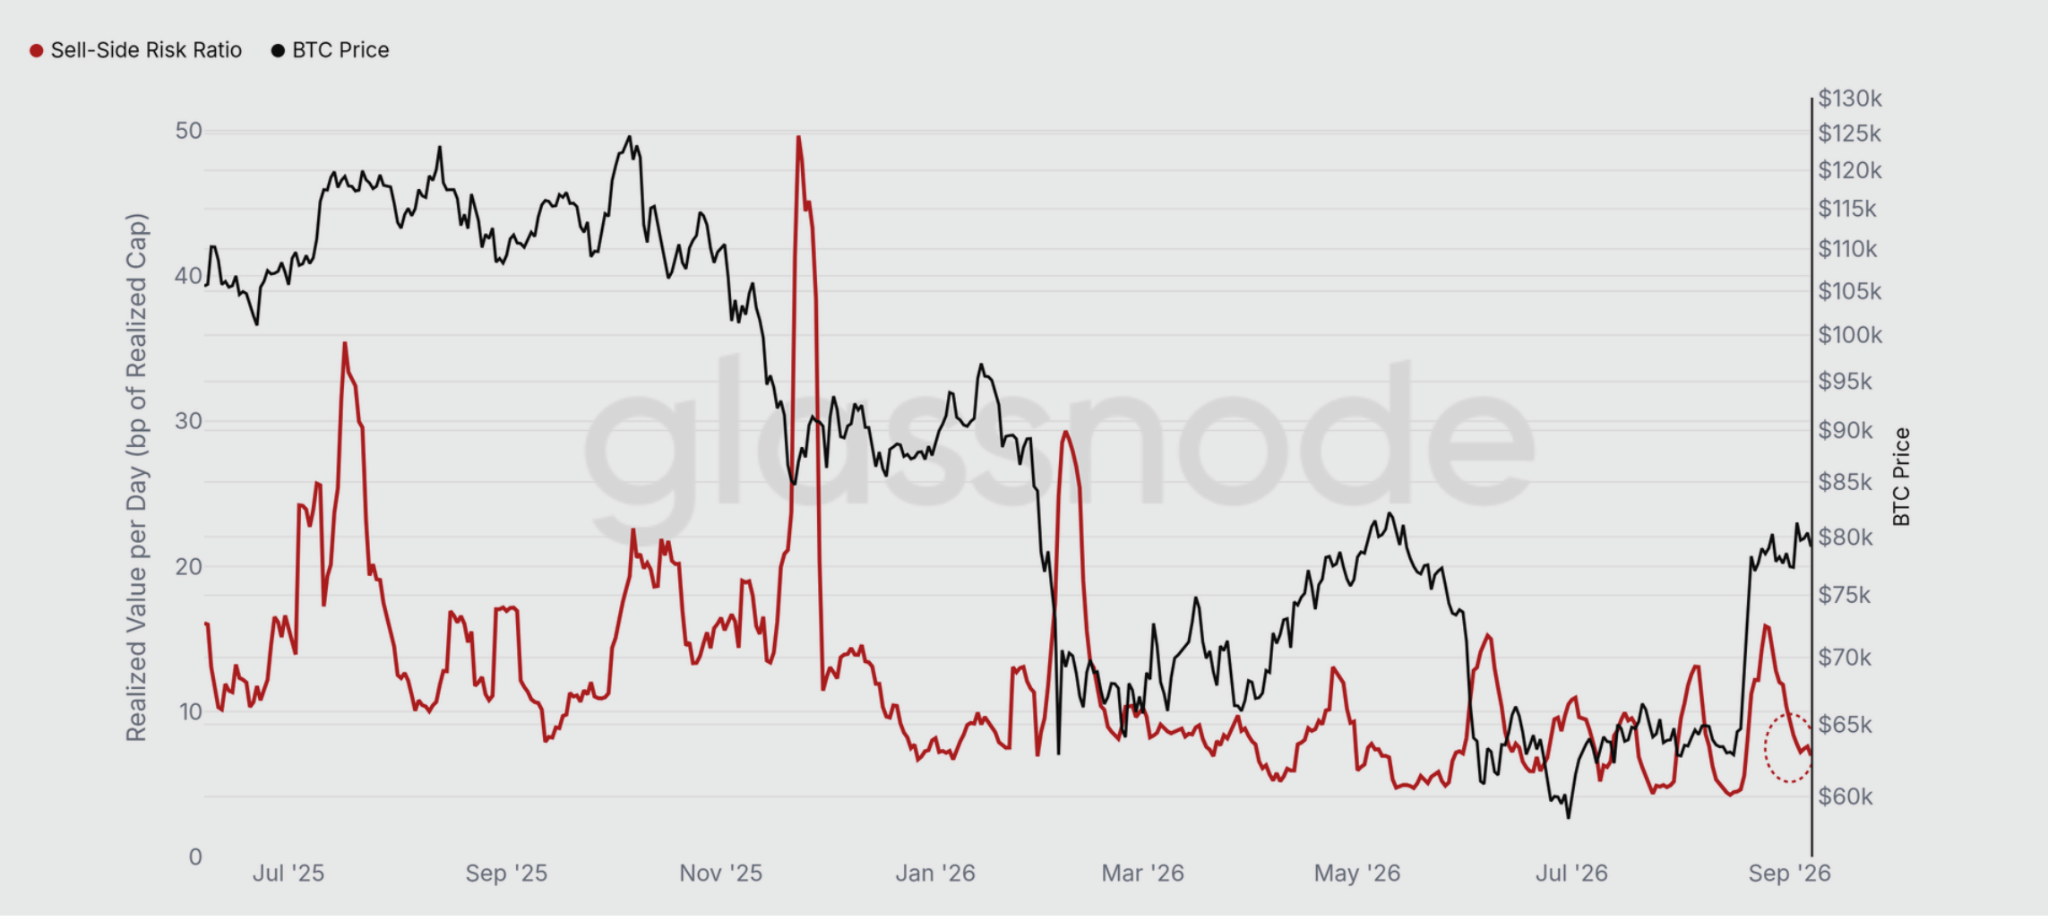
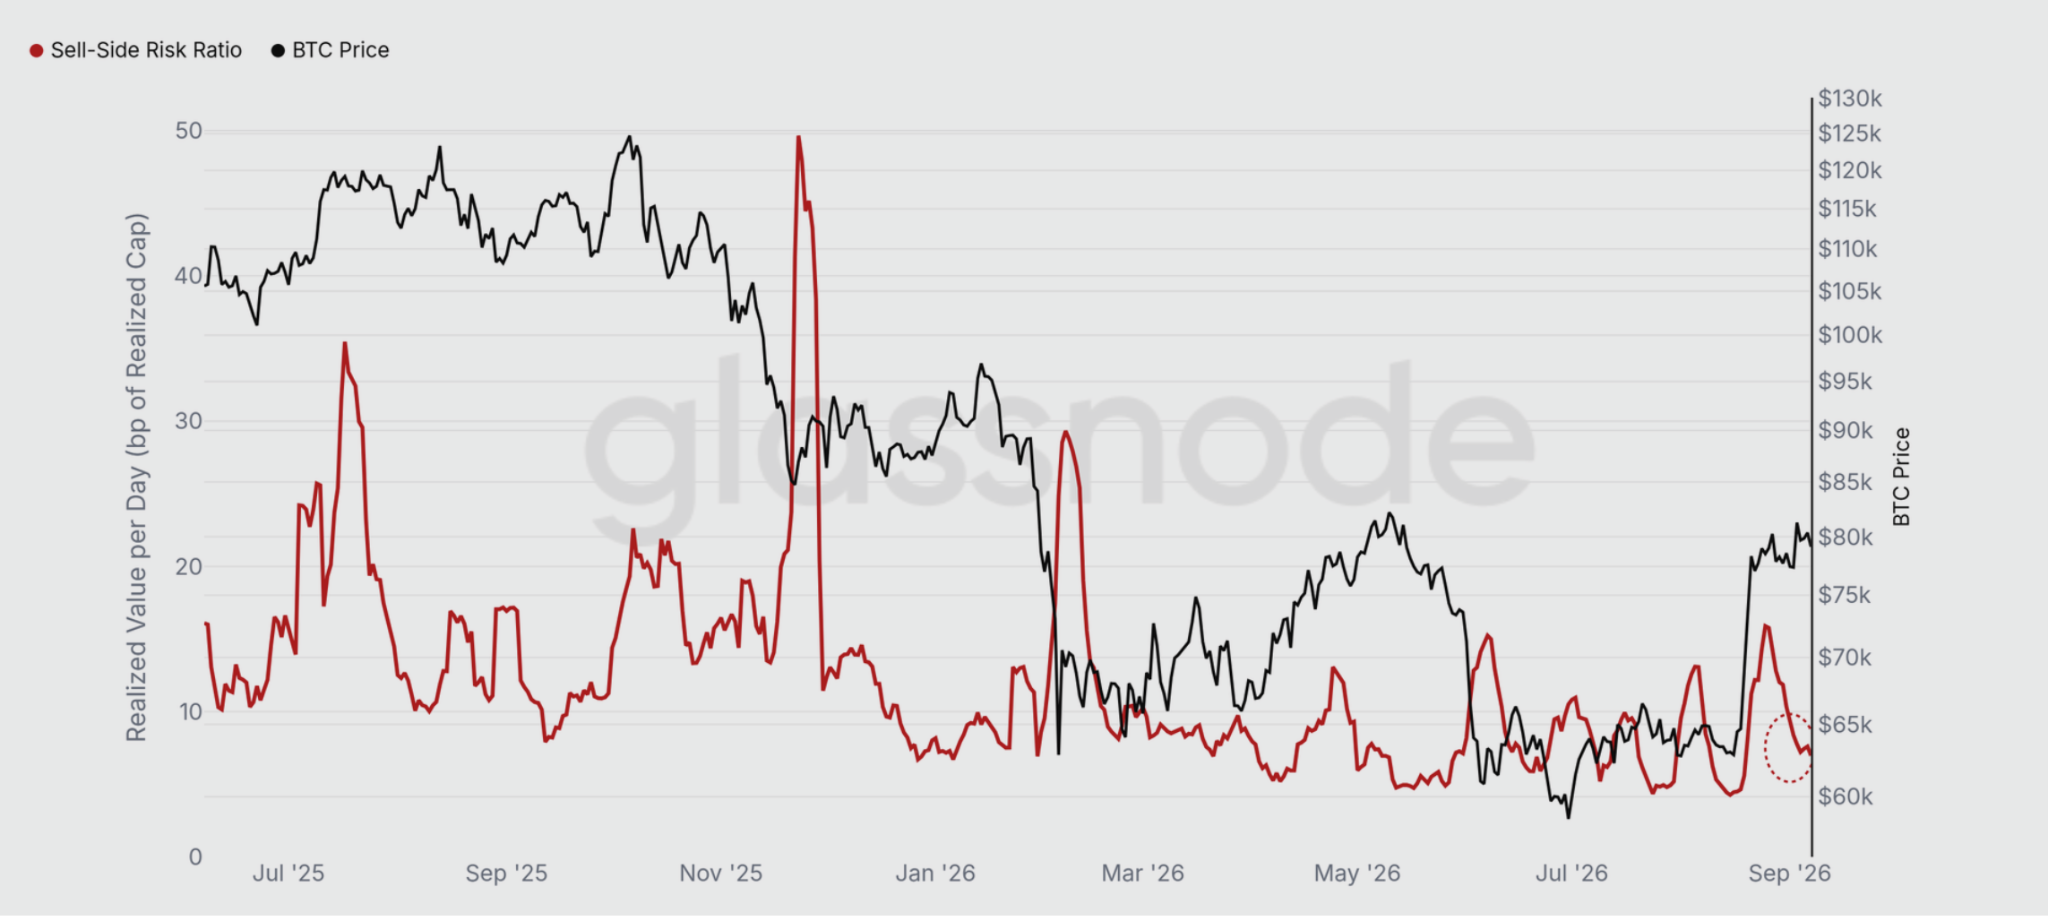
On a rolling seven-day metric, the Sell-Side Risk Ratio, which evaluates total realised profit and loss against Realised Cap, dropped to 7 basis points, marking a sharp decline from the 16 bps recorded during the August peak. Earlier local tops in July 2025 and October 2025 drove this figure to 35 and 23 bps respectively. Current levels therefore place daily sell-side realisation among the lowest readings of the past year.
Long-term holder profit realisation has contracted significantly, dropping from 88 percent at the peak in August down to 42 percent currently.
Even during the profit spike on 3 September, when BTC rose to $82,320, profit realisation remained at less than half the level seen in May, when BTC similarly spiked above $80,000.
Newer market participants account for the majority of current selling, yet overall volume from this cohort remains muted. A sustained expansion back above the 16 bps threshold would signal a re-emergence of potentially larger distribution. Until that materialises, spot markets continue to show limited supply at these valuations, while bulls lack the aggressive bid needed to propel price higher.
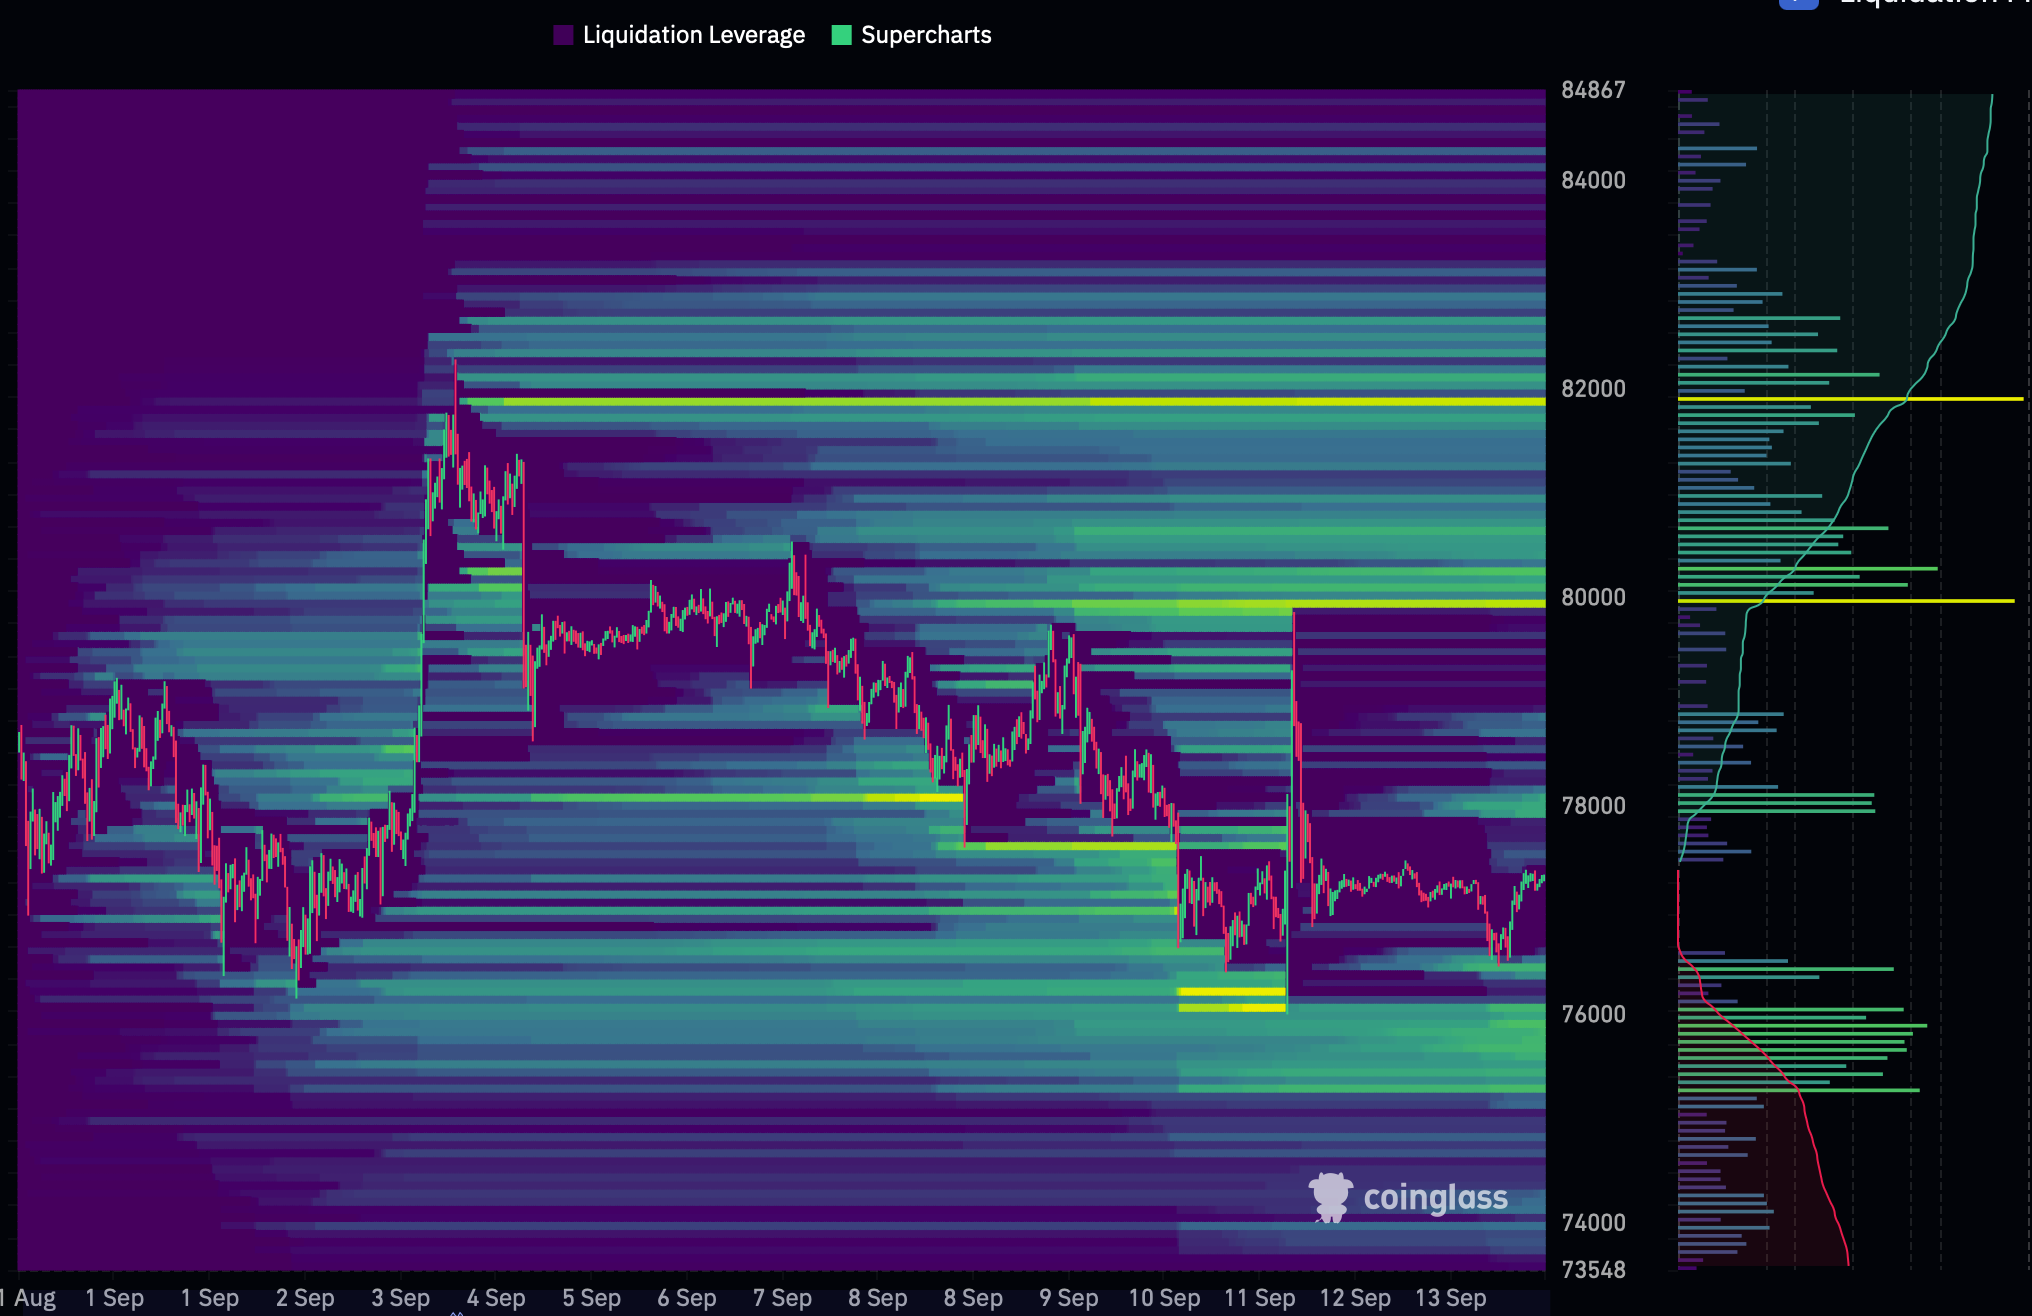
Following the significant short liquidations triggered on 19-20 August, the concentration of shorts around $82,000 — just above the current range highs — has expanded by 43 percent. If price moves through this level, cumulative potential short liquidations could reach $1.95 billion in notional value, assuming positioning remains unchanged. This build-up has occurred even as global open interest has cooled and aggregate map density has contracted by one-third (see Figure 2 above). As a result, this threshold now represents a significant concentration of projected liquidation volume.
On the lower range boundary, the long liquidation cluster between $75,000 and $76,000 has helped define the floor. A sustained breakout above $82,000 could trigger the main pool of short liquidations, while a move below $76,000 could set off cascading long liquidations. Liquidation clusters are common when price remains trapped in a narrow range for a sustained period.
The difference between the two liquidation bands is that the higher band has a limited number of positions and is concentrated across a certain strike price of $82,000. The lower band has evenly distributed strikes, collectively amounting to a large number of potential long liquidations.
Given this week’s impending rate decision, it would not be surprising to see both zones tested,with the nature of any move governed by the different liquidation structures sitting just beyond the current range extremes.

Bitcoin ETFs Sold, While Ether ETFs Bought
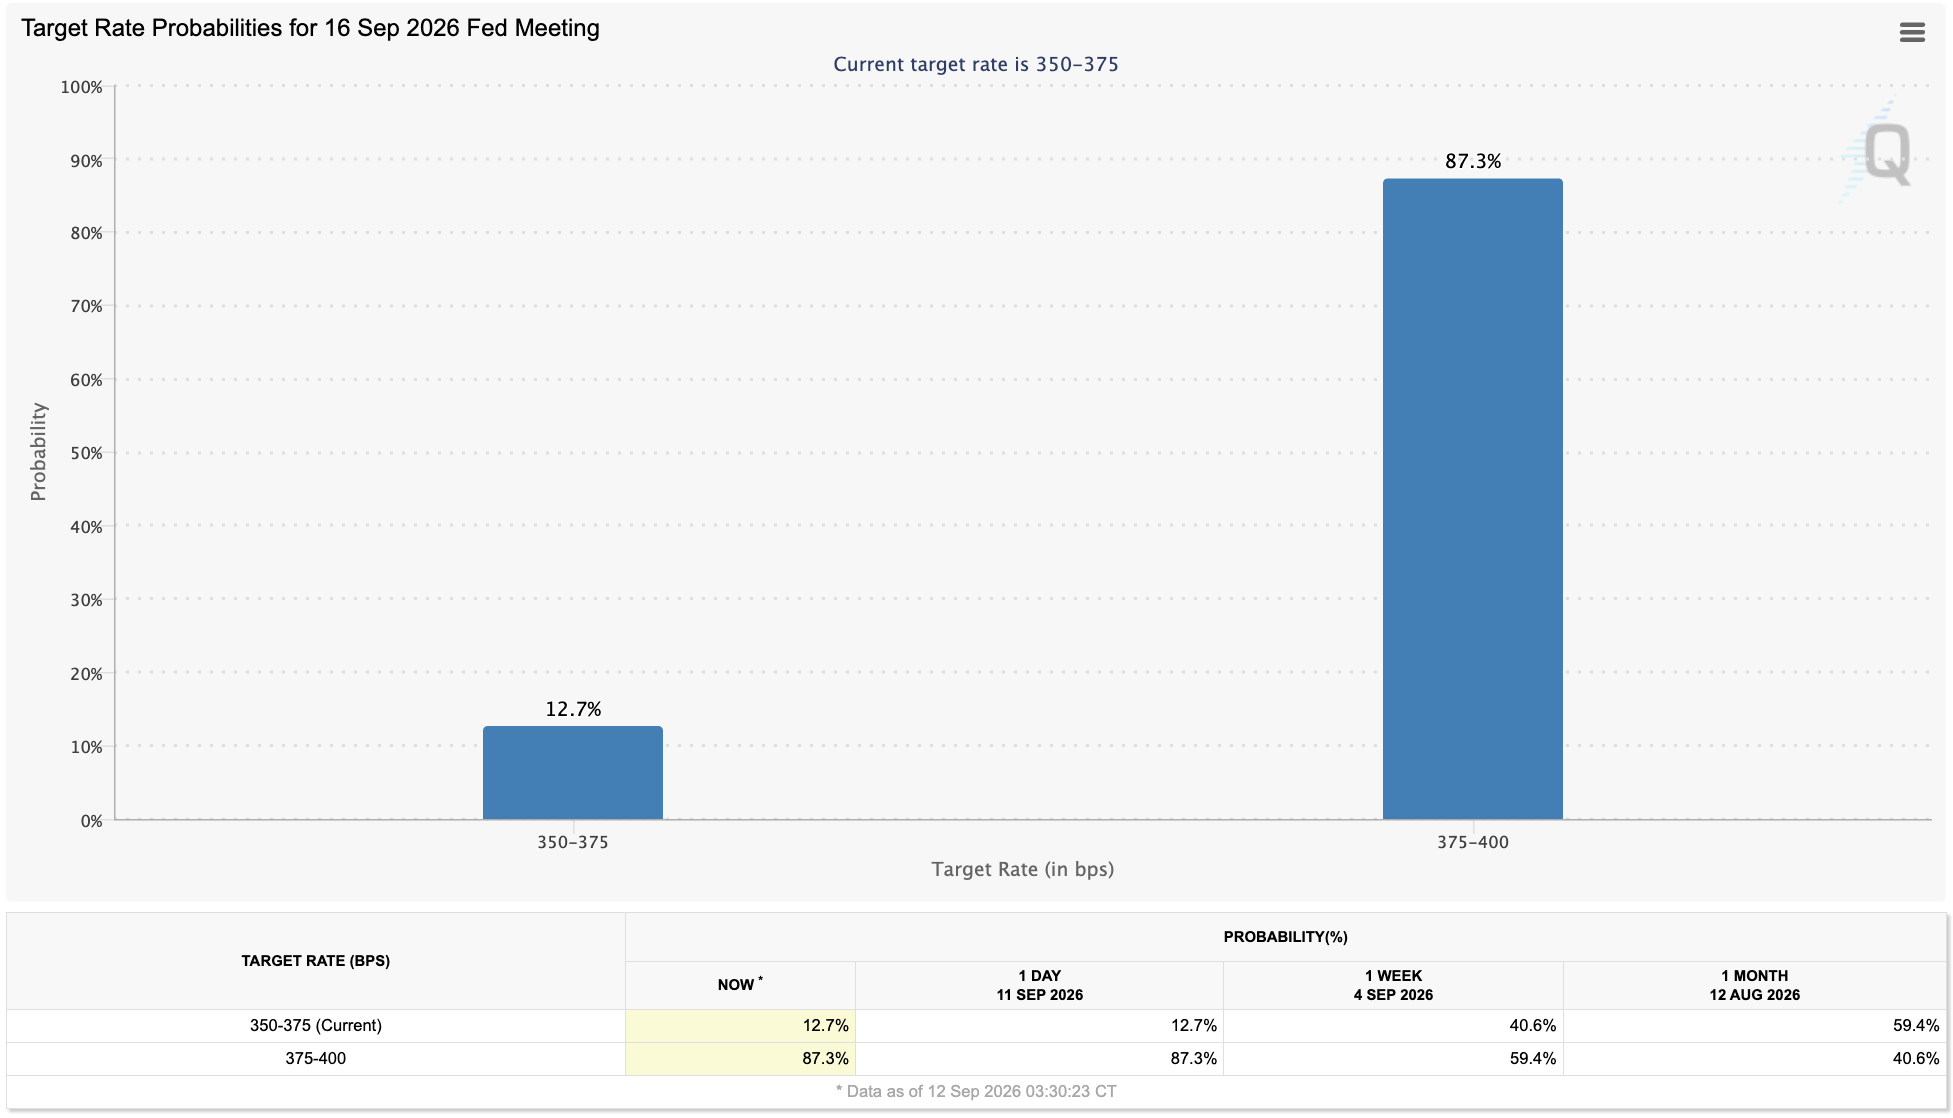
Seven sessions have passed since the August payrolls report. Bitcoin has spent this period giving back most of the ground it took on 3 September after reaching a $82,320 high, 42.4 percent off the bear market lows. The payrolls report was the first catalyst to send the rate hike odds for this week’s 16 September FOMC from a coinflip to 88.5 percent currently.
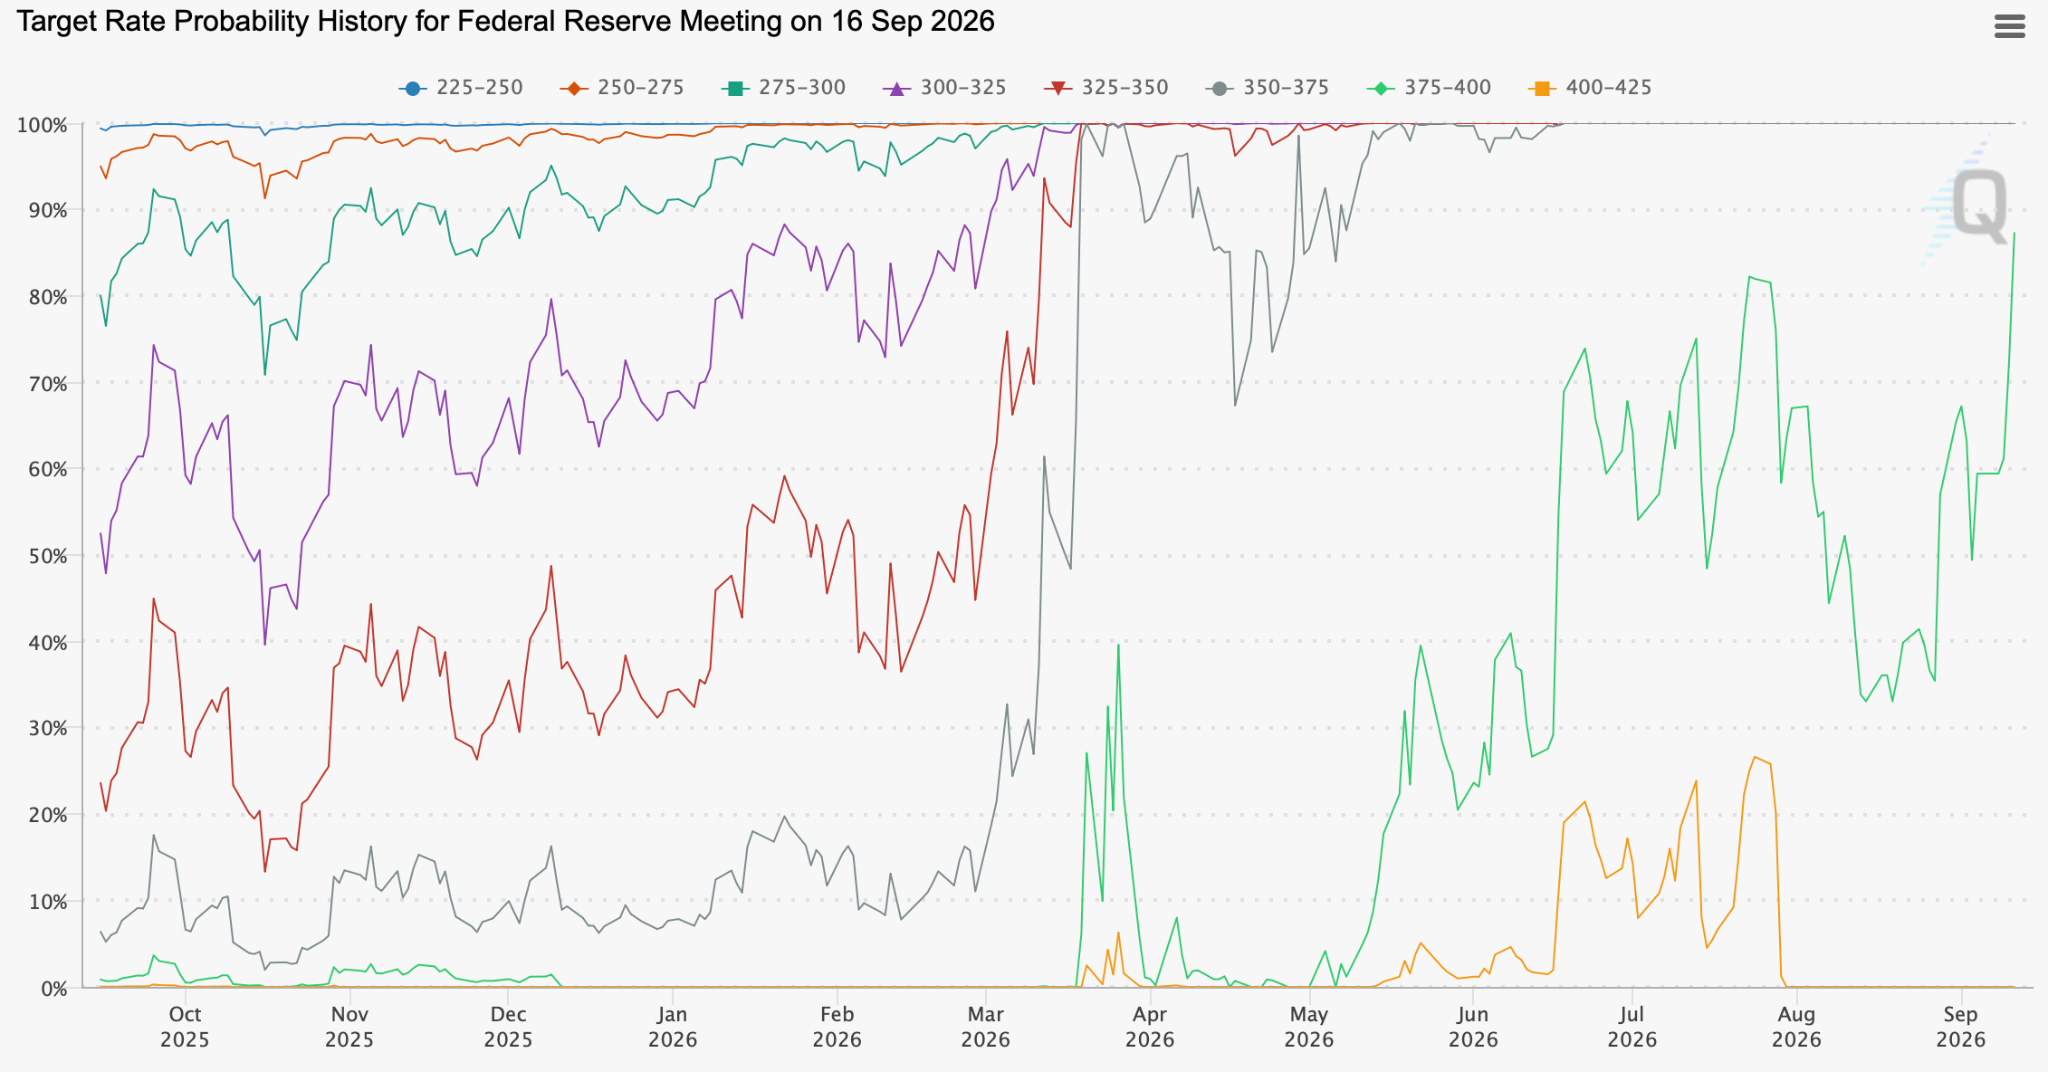
The 375-400 bps line metric above represents a 25 bps hike scenario and the spike in expectations post 3 September is noticeable.
Last week, BTC continued to trade within a 5.5 percent band, between levels we have defined as our lower timeframe range between $77,100 and $81,300. The weekly close sits on the $77,100 range low we set out in last week’s Bitfinex Alpha Intelligence Update as the level the mid-timeframe uptrend has to hold. Thursday’s close at $76,648 was the first daily close below our range floor since the range formed on 21 August, which happened in the final two hours of the session on under 40 BTC of spot volume on Bitfinex. Friday and Saturday closed back above this range marginally, indicating that while there is definite underlying weakness, the range lows are being defended. Deviations under it have been accompanied by very low volume, which is not typically how a range breakdown occurs on BTC.
Most of the selling behind the move came from US spot Bitcoin ETFs, which recorded redemptions in all four trading sessions last week totalling $462.7 million. By contrast, spot Ether funds took in $196.9 million.
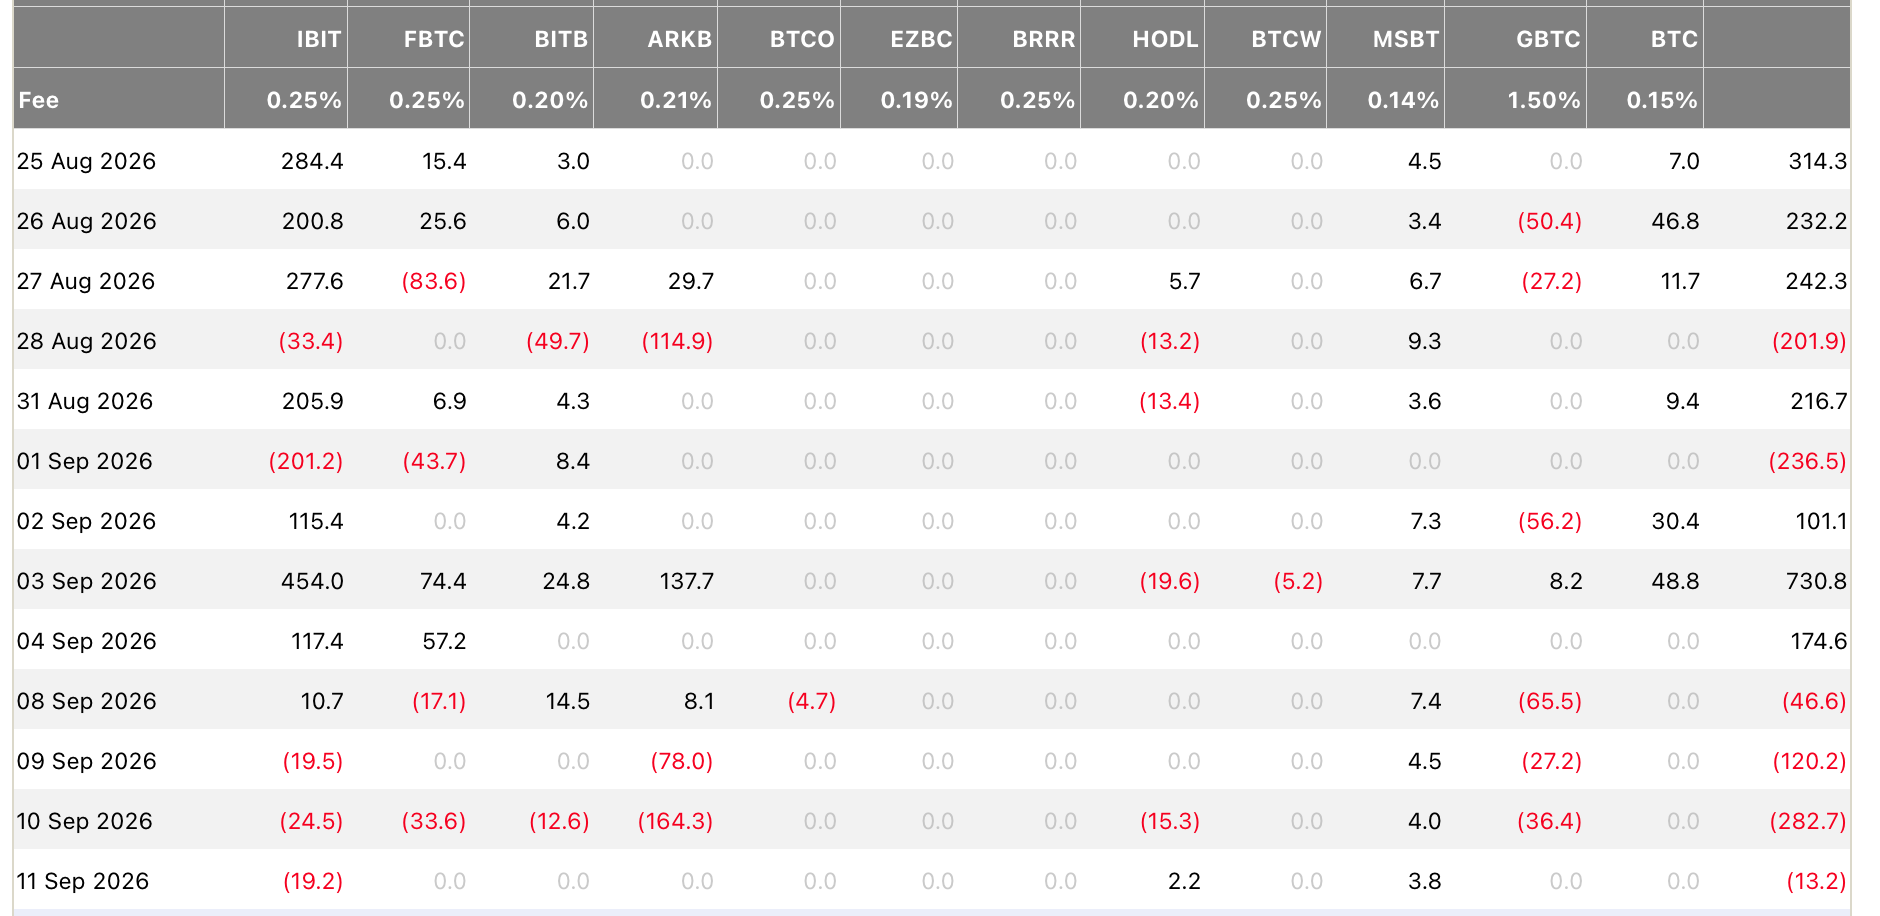
After serving as the primary buyer for three consecutive weeks — including during BTC’s August breakout, which triggered the largest short-side liquidation event on record — spot Bitcoin ETFs shifted to become the dominant source of selling last week (see Figure 12 above).
This four-day total of $462.7 million in net redemptions snapped the most aggressive three-week streak of inflows observed so far in 2026. At average weekly pricing, institutional funds divested nearly 5,900 BTC, representing roughly 1.9 times the 3,150 BTC mined weekly. Just one week prior, these vehicles were absorbing nearly 12,300 BTC, or 3.9 times newly issued supply, marking a massive $1.45 billion swing in weekly wrapper demand.
The positive sign was that the BTC ETFs sustained minimal capital flight, with IBIT only shedding $52.5 million and FBTC giving back $50.7 million. September’s month-to-date net flows also remain in positive territory at $307.3 million, preserving the monthly bid despite the weekly retracement. Ether assets continue to grow
Institutional capital did not exit crypto heavily on aggregate. Spot Ether funds continued to benefit from flows, including $216.4 million last Friday alone. The inflows came as Ether jumped 8.3 percent, triggering nearly $255 million in short liquidations, the third highest since 10 October 2025. Ether’s current price movements can be considered as being analogous to BTC’s 19 August move, when the asset spiked following the US Treasury’s bond buy-back announcement.
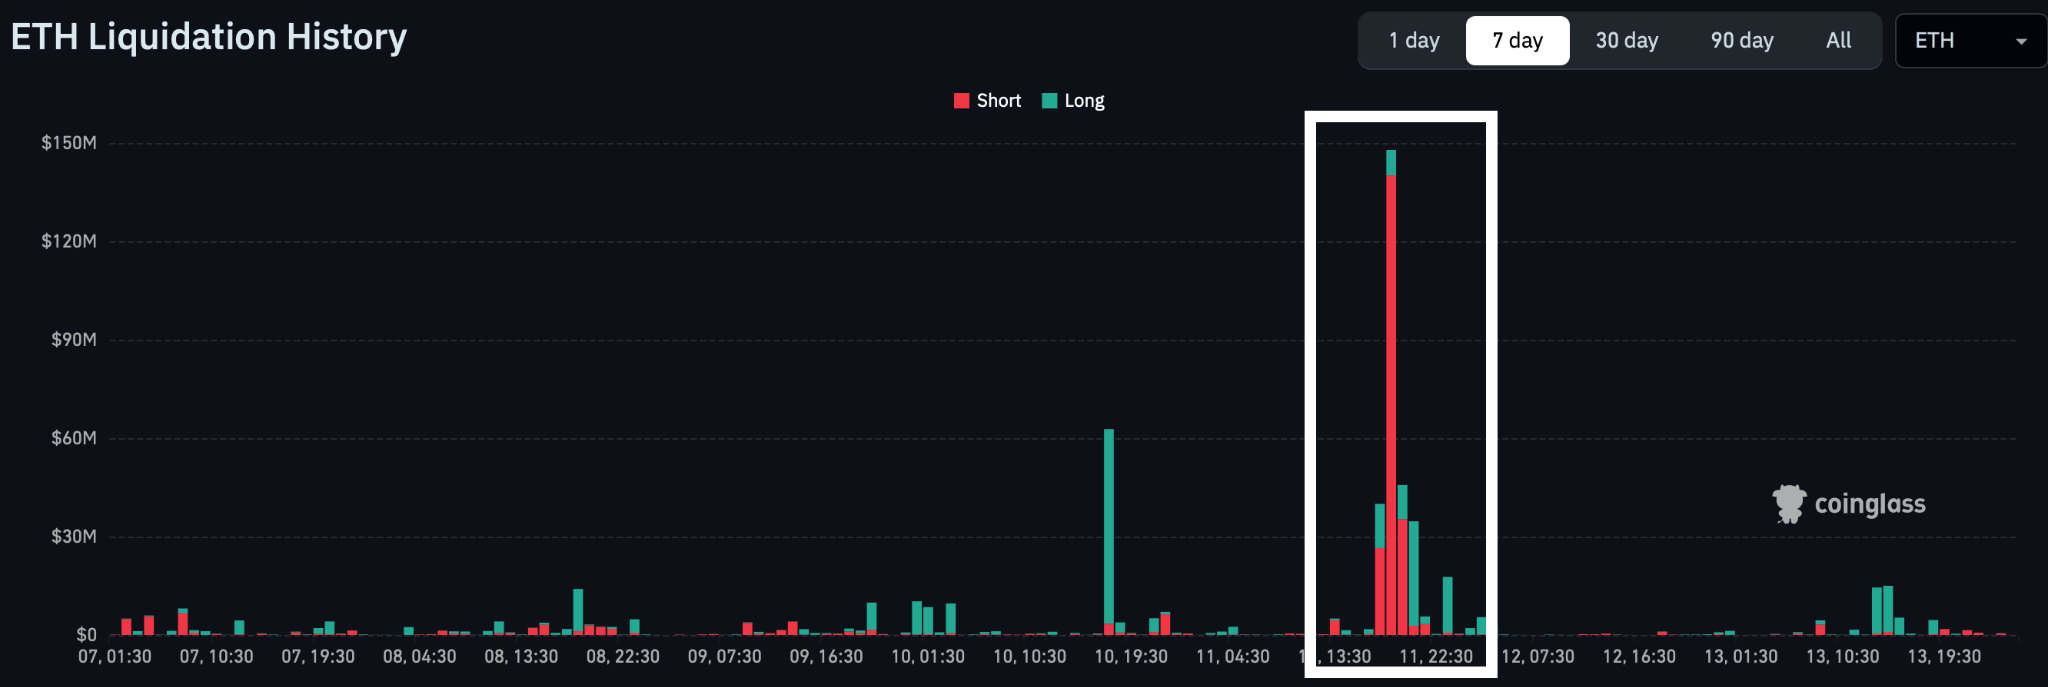
We expect Ether to hold the daily lows of $2,432 reached on 11 September as support on any pullbacks. If upwards momentum is to continue, the lows established before such an explosive move would typically be expected to hold, particularly if much of the supply above them has already been absorbed.
Month-to-date, Ether vehicles have accumulated $324.4 million, outpacing Bitcoin’s $307.3 million despite operating on an asset base roughly one-sixth the size. On regulated derivatives markets, the latest futures positioning report as of 12 September indicated that leveraged traders expanded both long and short exposure as open interest rose seven percent.
This points toward a rebuilt cash-and-carry posture ahead of the rate decision rather than outright directional positioning. Traders are building ETH ETF positions to use as collateral to trade CME futures, while earning yield. It explains the more robust interest in Ether ETF products relative to Bitcoin ETFs since they provide a higher basis rate and a potential yield from Ether staking. Additionally, corporate balance-sheet buying into BTC paused last week, with Strategy’s Monday filing confirming no new bitcoin buys.
On 11 September, Ether experienced a major short squeeze because it carried the more crowded short book, with roughly $255 million in shorts liquidated against $172 million in BTC shorts which were also on a larger open-interest base. That makes the Ether bid more of a positioning event, rather than a reallocation until we see more evidence of spot buying without a short-squeeze backdrop.

General Macro Updates
Energy Costs Lift Inflation Ahead of September Rate Decision
Interest rate futures imply an 88.5 percent probability that the Federal Reserve will raise interest rates by 25 basis points on 16 September, according to CME FedWatch. The 2-year Treasury yield, which tracks policy expectations more closely than any other maturity, rose from 4.39 percent on 8 September to 4.63 percent on 11 September.
Both consumer and producer inflation rose during August due to higher energy costs. Wednesday’s decision is now close to being settled. What the August data have changed is the question of what comes next.
The August Consumer Price Index (CPI), released on 11 September 2026, showed that consumer prices rose 0.4 percent from July. Annual inflation held at 3.4 percent. Core inflation, which excludes volatile food and energy prices, rose 0.3 percent over the month, although its annual rate eased from 2.5 percent to 2.4 percent.
It is an important distinction because prices increased faster during August, but annual inflation did not accelerate. The two figures answer different questions. The monthly number compares August with July, and July was unusually quiet at 0.1 percent, making the 0.4 percent monthly rise look like a sharp jump.
The annual number compares August with the same month last year when prices also rose 0.4 percent. One strong month replaced another in the annual comparison, leaving the year-on-year rate unchanged at 3.4 percent. Core prices also rose 0.3 percent in August last year, which helps explain why the annual core rate barely moved, easing to 2.4 percent from 2.5 percent. The Fed watches the monthly figures for precisely this reason, as the annual rate can remain stable even while near-term price pressures accelerate.
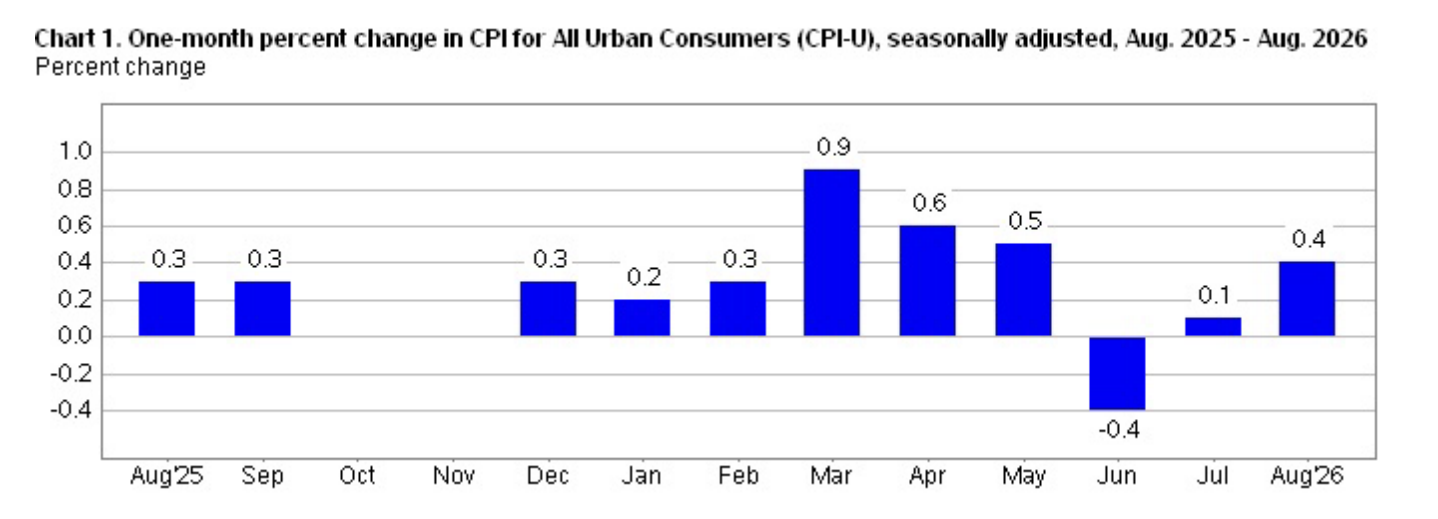

Energy prices rose 2.1 percent during the month, after falling 1.5 percent in July. Gasoline increased 3.9 percent and accounted for more than one-third of the overall monthly CPI rise. Airfares also climbed 2.7 percent, but food prices increased a more modest 0.1 percent. Shelter, which carries the largest weight in the core index, rose 0.3 percent, but is still up 3 percent over the year. These figures show that fuel drove much of the immediate pressure, although the increase in shelter means the pressure was not confined to energy.
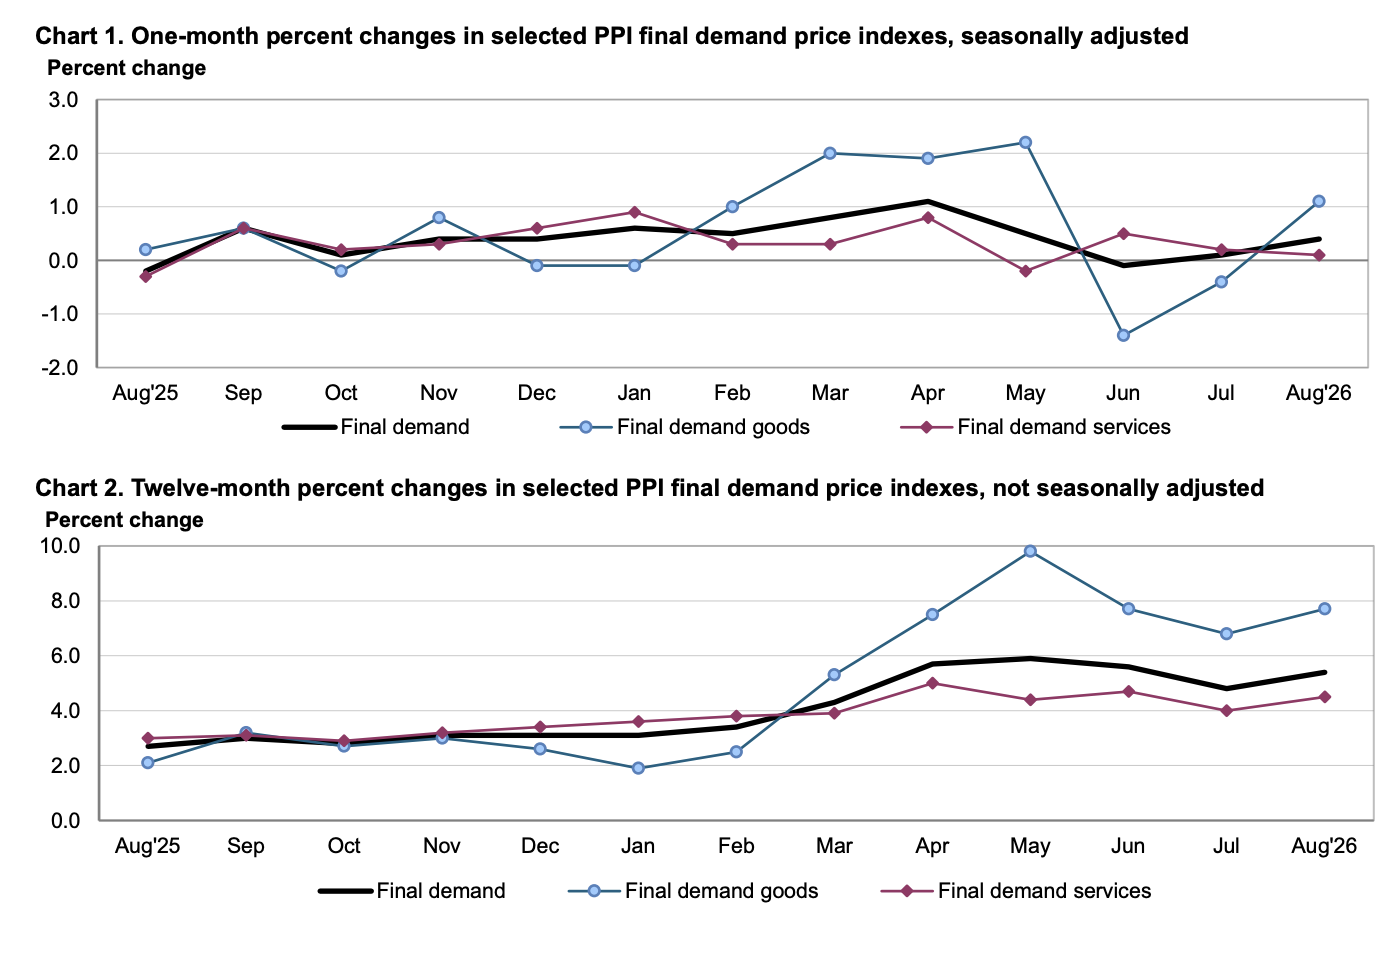
Producer inflation also showed a 0.4 percent monthly increase in prices received by domestic producers, with prices now up 5.4 percent on a 12-month basis. Goods prices increased 1.1 percent, mostly due to energy costs, which increased 4.2 percent. Diesel fuel alone jumped 24.1 percent. Excluding food, along with energy and trade services, producer prices were up 0.3 percent over the month and 4.7 percent over the year.
Conditions are Already Tight
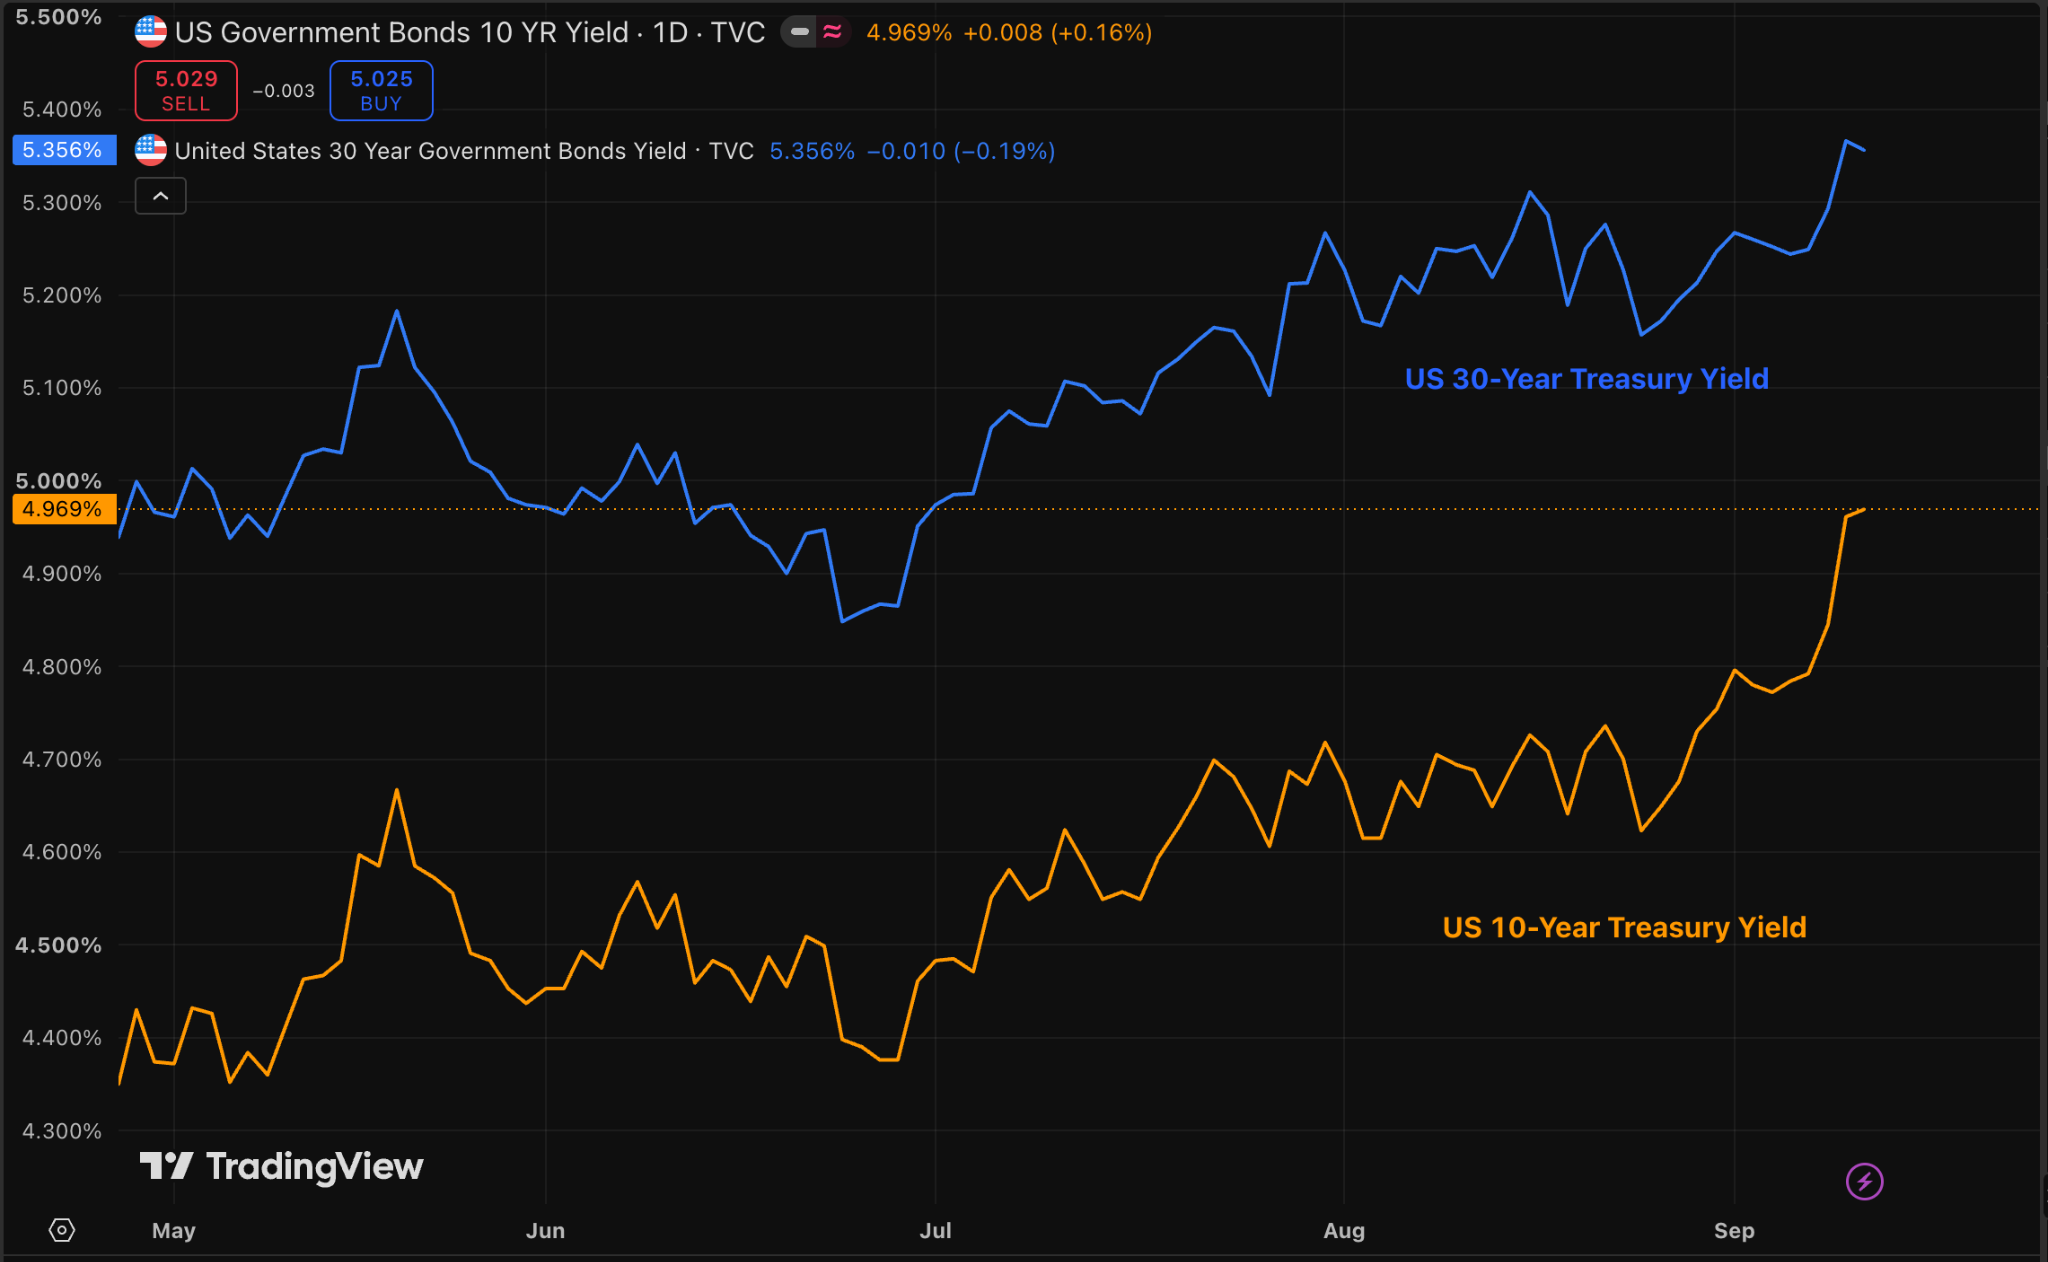
The market has already started tightening financial conditions. The 10-year Treasury yield closed the week at 4.96 percent and the 30-year at 5.36 percent. Meanwhile, the 10-year inflation-indexed yield, which strips expected inflation out and shows the real return demanded on a decade of lending, rose from 2.43 percent on 8 September to 2.55 percent on 10 September. Borrowing costs across the economy are therefore rising before the Fed has moved. While higher borrowing costs can slow spending and limit a business’ ability to pass on rising costs, they cannot restore disrupted oil supplies, which leaves a rate increase as a matter of policy judgement rather than an automatic response to expensive fuel.
The projections that will be published alongside Wednesday’s decision will carry more information than the decision itself, since they will show whether policymakers expect just one increase or a sequence of rate rises. The August reading of the price index the Fed actually targets, Personal Consumption Expenditures, does not arrive until 30 September, two weeks after the vote.
Why This Matters for Bitcoin
For bitcoin, the most important indicator of monetary policy decision making is the real discount rate. At 2.55 percent, the 10-year inflation-indexed yield sets a rising risk-free hurdle that any asset paying no yield has to clear. It has been consistently rising in advance of any rate increase.
This has pinned BTC at around $77,000. The marker to watch after Wednesday is whether that real yield holds above 2.5 percent into October. If it does, the asset is likely to see any price appreciation capped.

Energy Shock Leaves Households More Exposed
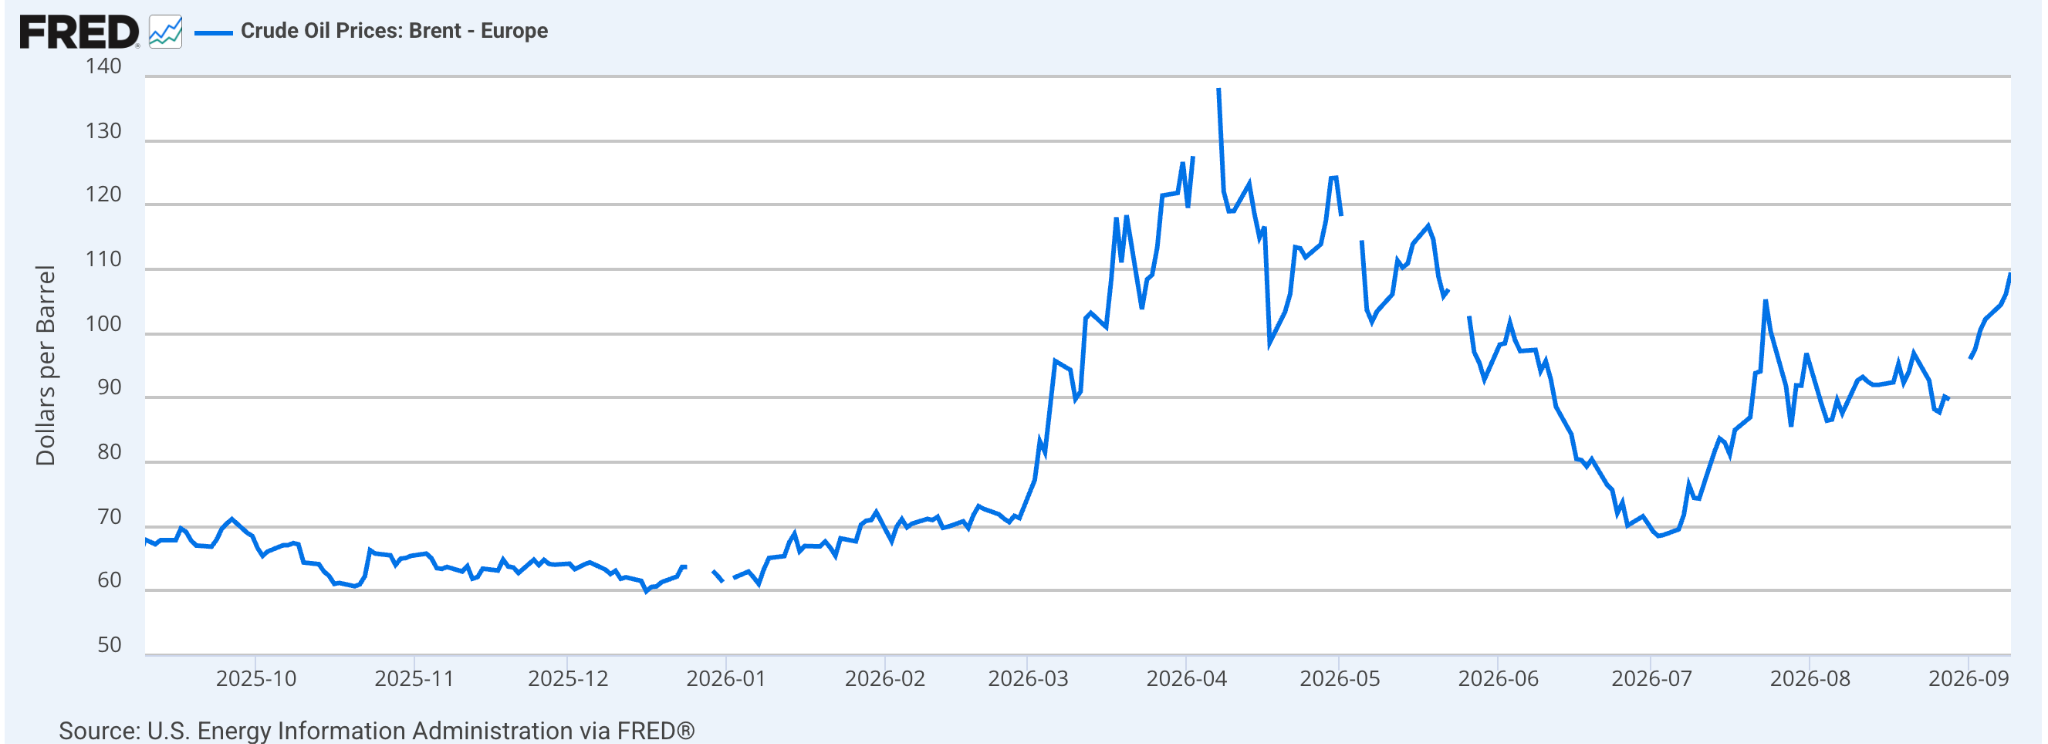
Brent crude settled at $109.51 per barrel on 9 September, up from $100.52 on 3 September, while West Texas Intermediate crude reached $97.26, as renewed Middle East hostilities continued to disrupt supply. Emergency reserves offer a smaller cushion than they did in the spring, and consumer confidence weakened sharply in early September as households raised their inflation expectations. The energy shock has moved out of the futures market and into the household budget, which is where it starts to constrain the Fed.
The pressure is concentrated in diesel rather than in petrol, and that distinction carries most of the argument. Retail diesel averaged $5.65 per gallon in the week to 8 September, an increase of 36.8 cents on the week and $2.201 on the year, while retail petrol averaged $4.157, up 8.6 cents on the week. Petrol is a household expense — and a painful one. Diesel is an input cost, and it enters the price of everything that is grown, moved or stored. This means it reaches consumers through food and freight some months later, rather than at the pump today. The timing compounds the problem because the harvest season and the winter heating build draw on the same barrel, and farms, freight operators and households need those fuels at the same time.
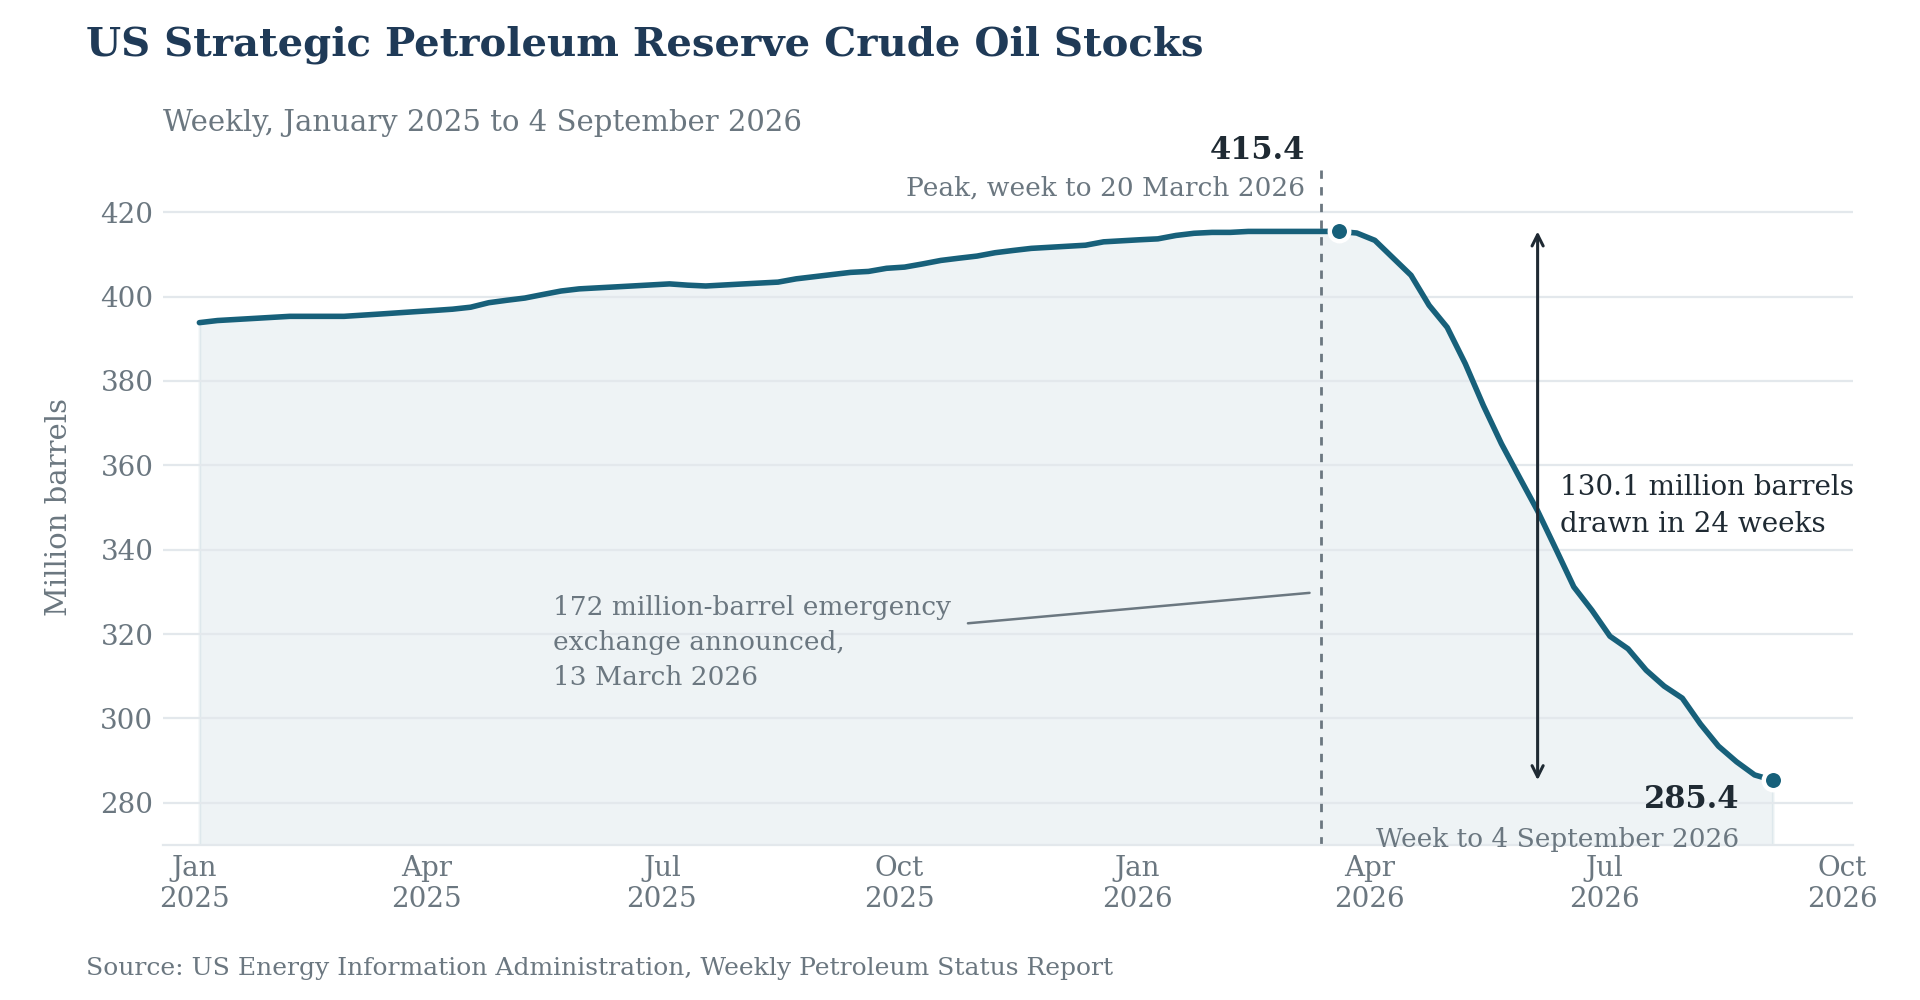
Emergency supplies also offer a smaller cushion. The Department of Energy announced a 172 million-barrel emergency exchange on 13 March 2026, the first tranche covering 86 million barrels, as part of a coordinated release with other International Energy Agency members. The US Strategic Petroleum Reserve has since fallen by about 126 million barrels, from 411 million at the end of 2025 to 285.4 million in the week to 4 September. Improved flows through the Strait of Hormuz have slowed the drawdown, which ran at 6.1 million barrels in the week to 7 August and at 1.2 million barrels in the week to 4 September. The reserve can soften a supply disruption, but rebuilding it takes time, and the barrels are returned to the department on a schedule rather than a fixed date.
Households were already becoming more cautious. The University of Michigan’s preliminary September Index of Consumer Sentiment fell to 47.8 from 51.7 in August. The decline centred on expectations: that component dropped to 45.8 from 51.5, while the current conditions measure slipped only slightly, to 50.9 from 51.9. Consumers were more concerned about their future finances and business conditions than about a sudden deterioration in the present.
Year-ahead inflation expectations rose from 4.0 percent to 4.6 percent. These figures describe what households expect prices to do, rather than measured inflation, and year-ahead expectations tend to track the pump and to fall back with it. The longer-run measure is the one that should concern the Fed and it moved in the same direction, rising from 3.3 percent to 3.4 percent. An expectation that far out is supposed to be anchored regardless of what fuel costs are doing this month.
The survey therefore sharpens the policy dilemma. Households expect their budgets to face more pressure, yet higher interest rates would also raise
borrowing costs and restrain demand. The combined evidence points to a difficult period in which the Fed must judge whether energy costs are creating lasting inflation pressure, while consumers grow less confident about their ability to absorb the strain.
Why This Matters for Crypto
The transmission runs through the Fed’s room to manoeuvre rather than through risk appetite. An energy shock that lifts long-run inflation expectations, rather than the year-ahead measure alone, is one the central bank cannot look through — an important assumption behind many macro arguments for a higher bitcoin price.
Higher rates tighten liquidity without restoring a barrel of supply, so the shock and the policy response press in the same direction for a while. The markers to watch are the weekly EIA retail diesel price and Brent, where a settlement back below $90 would relieve the expectations channel faster than anything the Fed says on Wednesday.
What Would Prove This Wrong
Two calls sit behind these articles. The first is that the increase on 16 September is the start of a sequence rather than a single insurance move. The second is that the August inflation impulse is energy-led, still passing through, and now leaking into household expectations. Both are testable within weeks.
The Federal Open Market Committee leaves the target range at 3.50-3.75 percent on 16 September, or the projections published the same day show a median of no further increase beyond September.
Brent crude settles below $90 per barrel for five consecutive sessions, or retail diesel falls below $5.50 per gallon in two consecutive weekly EIA reports.
September core CPI comes in at 0.2 percent or less on the month with the energy index negative, which would mean the August acceleration did not broaden.
The 10-year Treasury inflation-indexed yield falls back below 2.40 percent and holds there for two consecutive weeks, removing the real-rate tightening this argument rests on.
The University of Michigan long-run inflation expectation returns to 3.3 percent or below in the final September reading or the October preliminary, which would mean the anchor held.
The 30-year Treasury yield falls below 5.20 percent while the enlarged long-end buybacks continue, which would say the long end is being cleared rather than repriced.
