

Issue #230:
After the Equity Rout, CPI Sets Direction
Bitcoin Follows the Nasdaq into a CPI Test
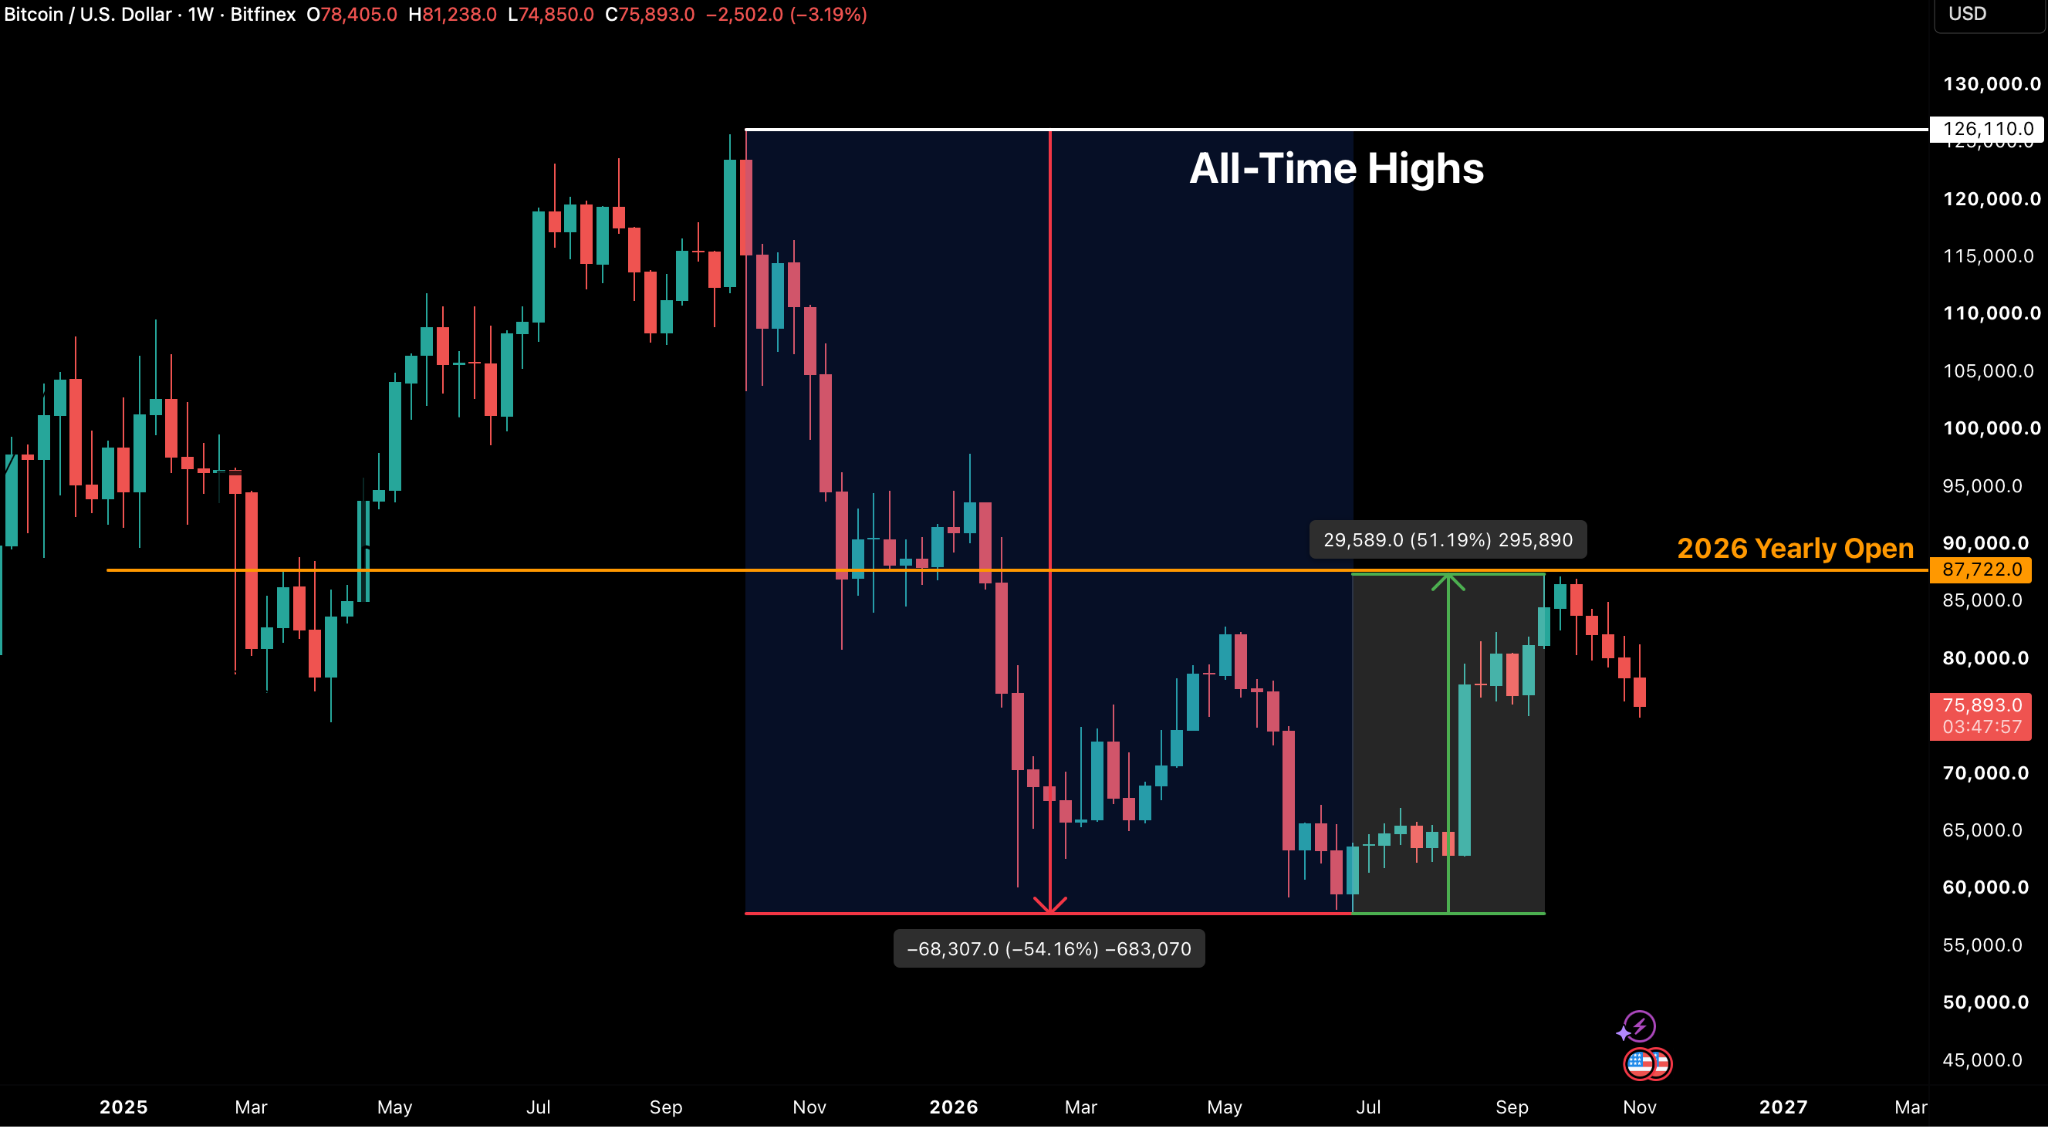
Bitcoin closed its fifth consecutive red week at $74,834 on 8 November, down 4.5 percent on the week. The Sunday low of $73,470 marked a 15.9 percent decline from the 21 September high, the deepest pullback of the uptrend that began in July. Five-week losing streaks are rare, and the five earlier instances in our record all belonged to bear markets or capitulations and lost roughly 30 to 38 percent. This one has lost 13.5 percent, which is why we still read it as a correction. The week’s only rally, the post midterm bounce to the key $81,300 level, was sold into within a day by October buyers sitting at breakeven, and Sunday’s close took price below the short-term holder cost basis at $75,893 for the first time in this uptrend.
The correction remains orderly but is being held up primarily by perpetual futures buyers, potentially creating a weak basis for price. Funding, long/short account ratios and taker flow all show that the bid under $77,000 was driven by leveraged longs opening into the fall, for the fifth time in a month, while spot ETFs recorded net outflows of $1.28 billion over the week, the largest outflow since June. The outflow run ended with a single inflow day. On-chain, short-term holders are realising losses at a measured pace and supply in profit is sitting under the 58.3 percent line that has separated corrections from deeper resets in every cycle since 2017. That line, and the ETF tape, will help determine the week.
The US midterm elections, rather than the Federal Reserve, were the key driver of bitcoin’s performance last week.
With Democrats taking both chambers of Congress on 3 November, and subsequent calls from Democratic lawmakers to pause advanced AI development and put a moratorium on new AI data centres, investors finally had a reason to sell companies that build AI capacity — providing a near-direct impact on BTC. The Nasdaq Composite fell 5.5 percent on 5 November, its worst session since April 2025. Bitcoin fell with it through the $77,000 floor of its support band.
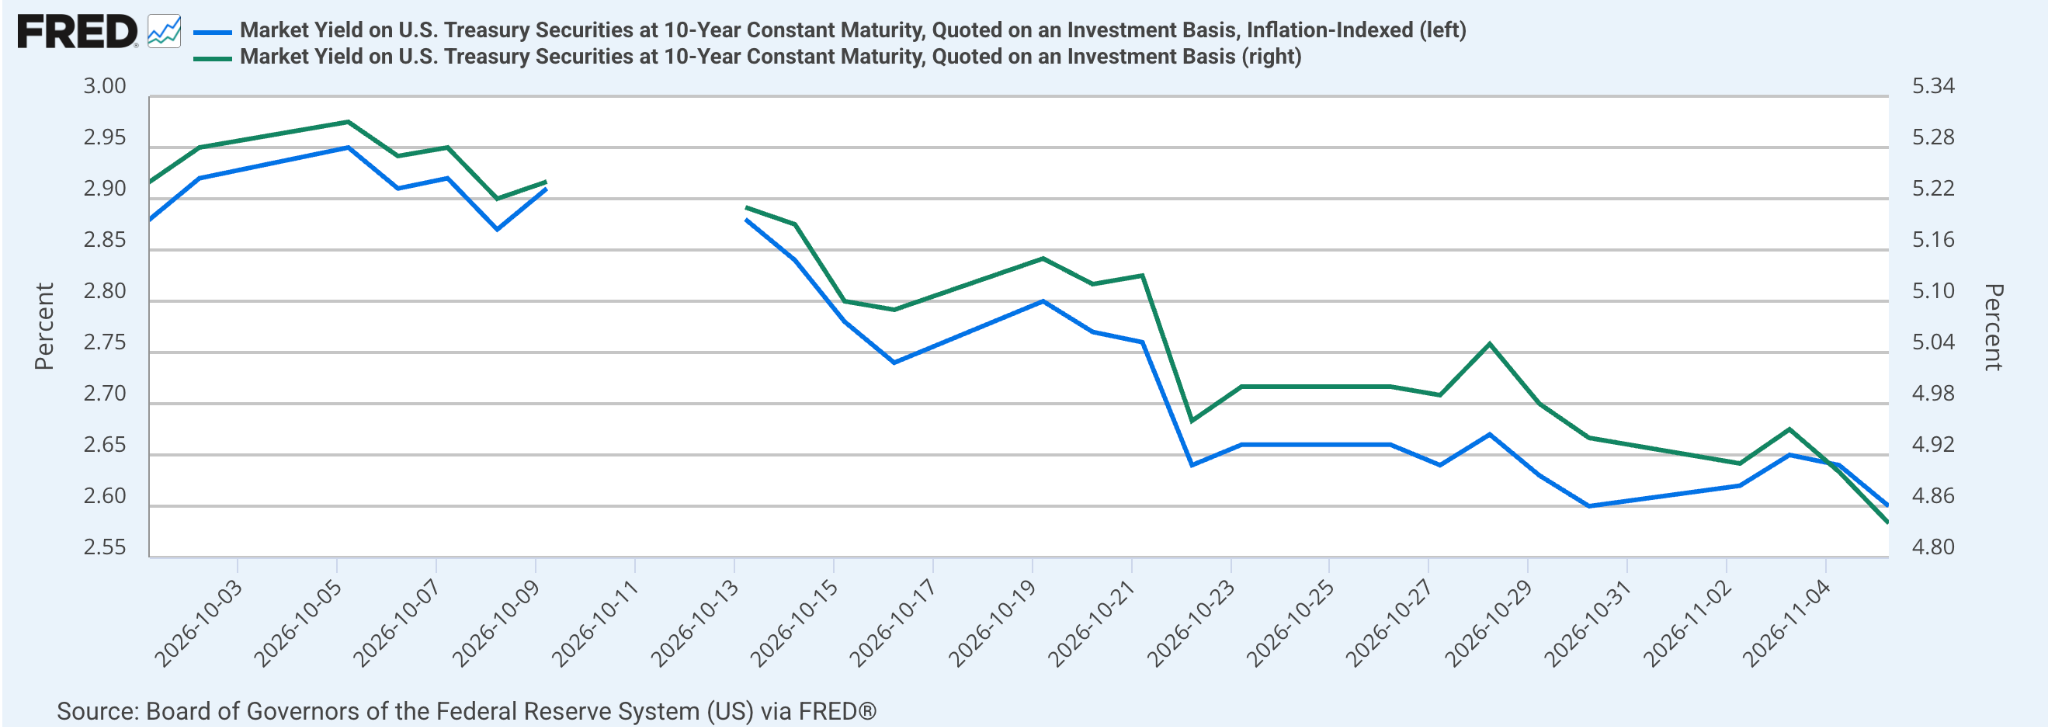
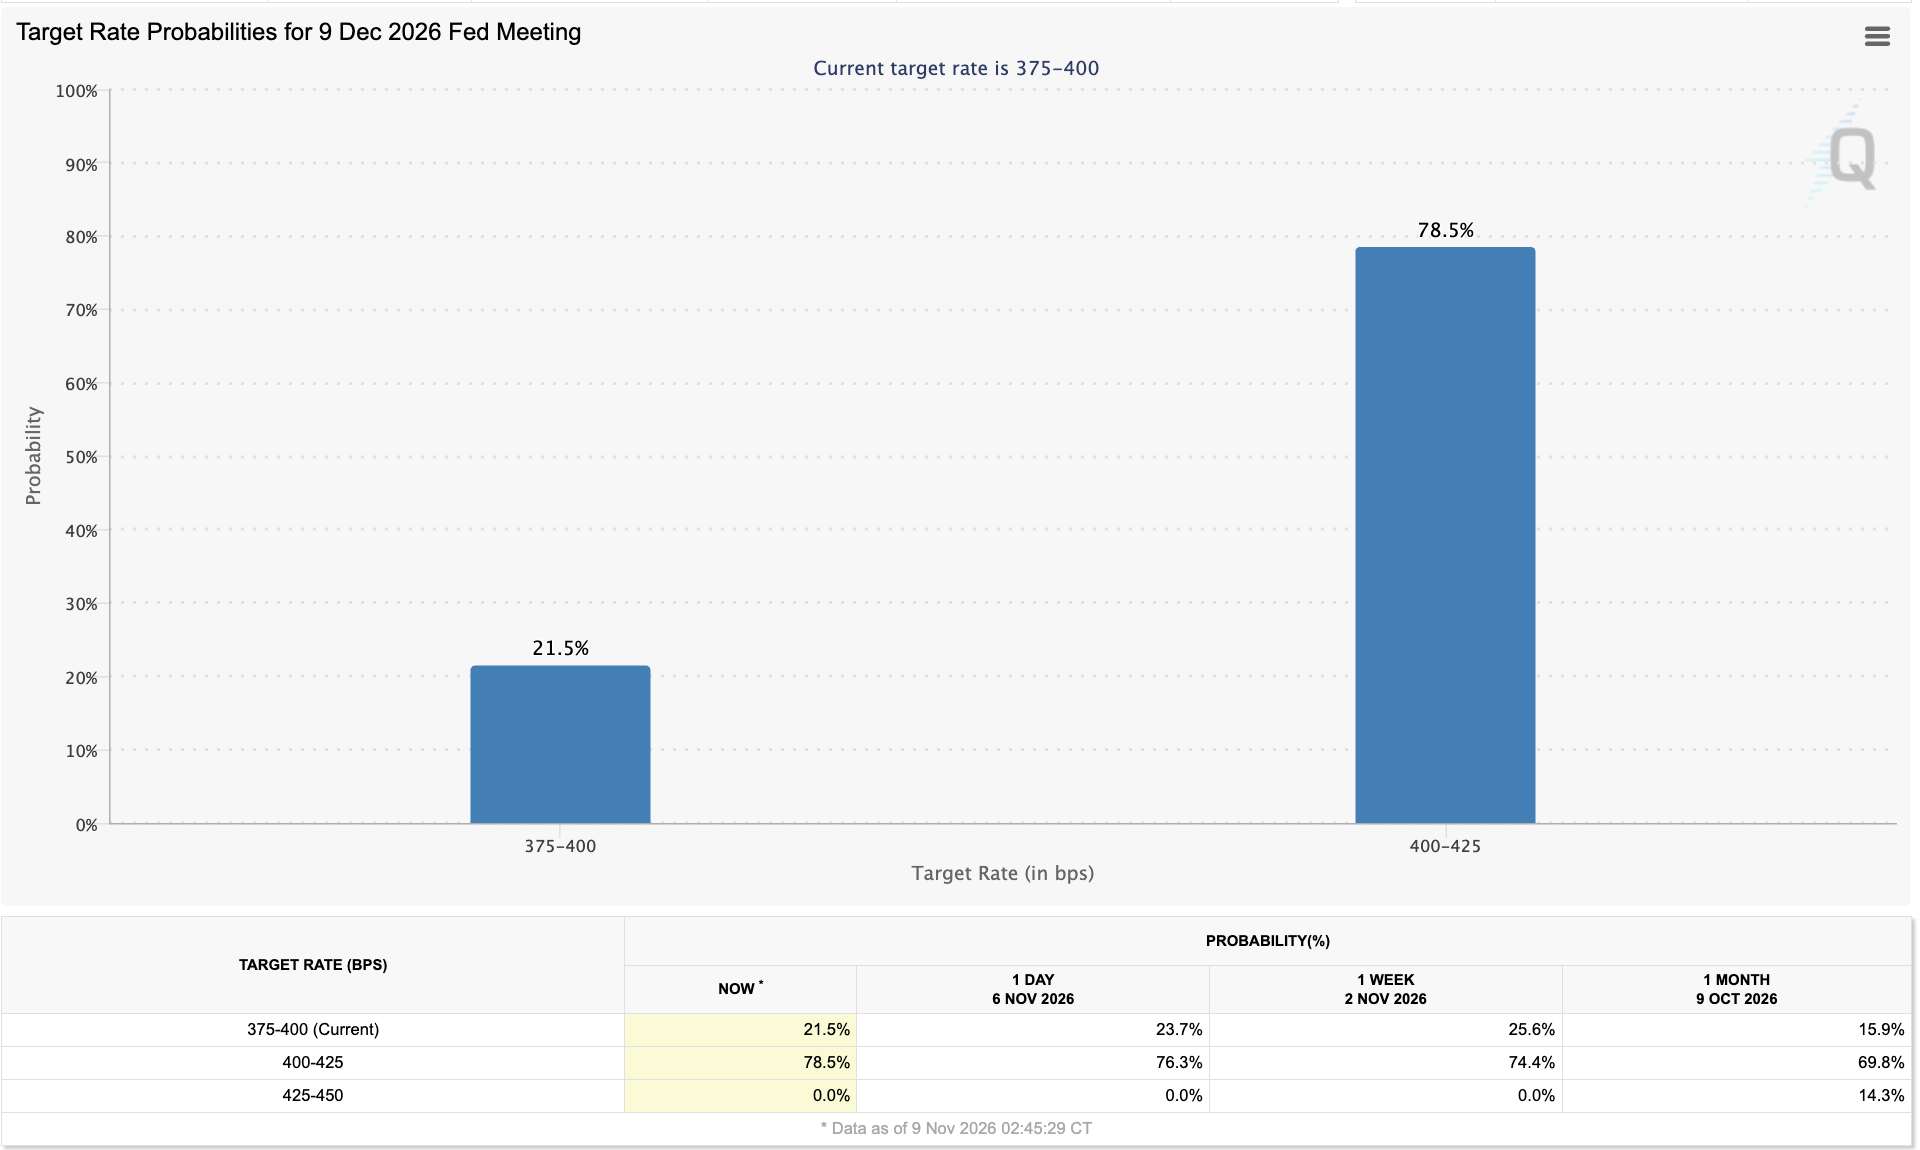
In contrast, the macro channel we treat as the hurdle for bitcoin did not tighten: the 10-year real yield sat at 2.64 percent on 4 November, and was basically unchanged, even after a 165,000 October payroll gain was reported on 6 November, lifting the implied probability of a December rate hike to about 78.5 percent.
Bitcoin’s downside last week was therefore driven primarily by its tight correlation to equities, rather than its sensitivity to rates. The next major inflection point is the October Consumer Price Index data, due on 10 November, with the potential to change BTC’s current close correlation with equities.

Market Signals
Post-Mid-term Equity Cascade Drags Bitcoin Below the STHCB
Bitcoin closed a fifth consecutive red week, 4.5 percent lower on the week and 13.5 percent below the close of 4 October — the last green week. Five-week losing streaks are rare. Since 2013, there have been only five occurrences of such streaks, and every one belonged to a bear market or capitulation, losing between 29.7 and 37.6 percent over the course of the entire move. BTC has declined 12.2 percent over the past five weeks, representing a considerably shallower decline.
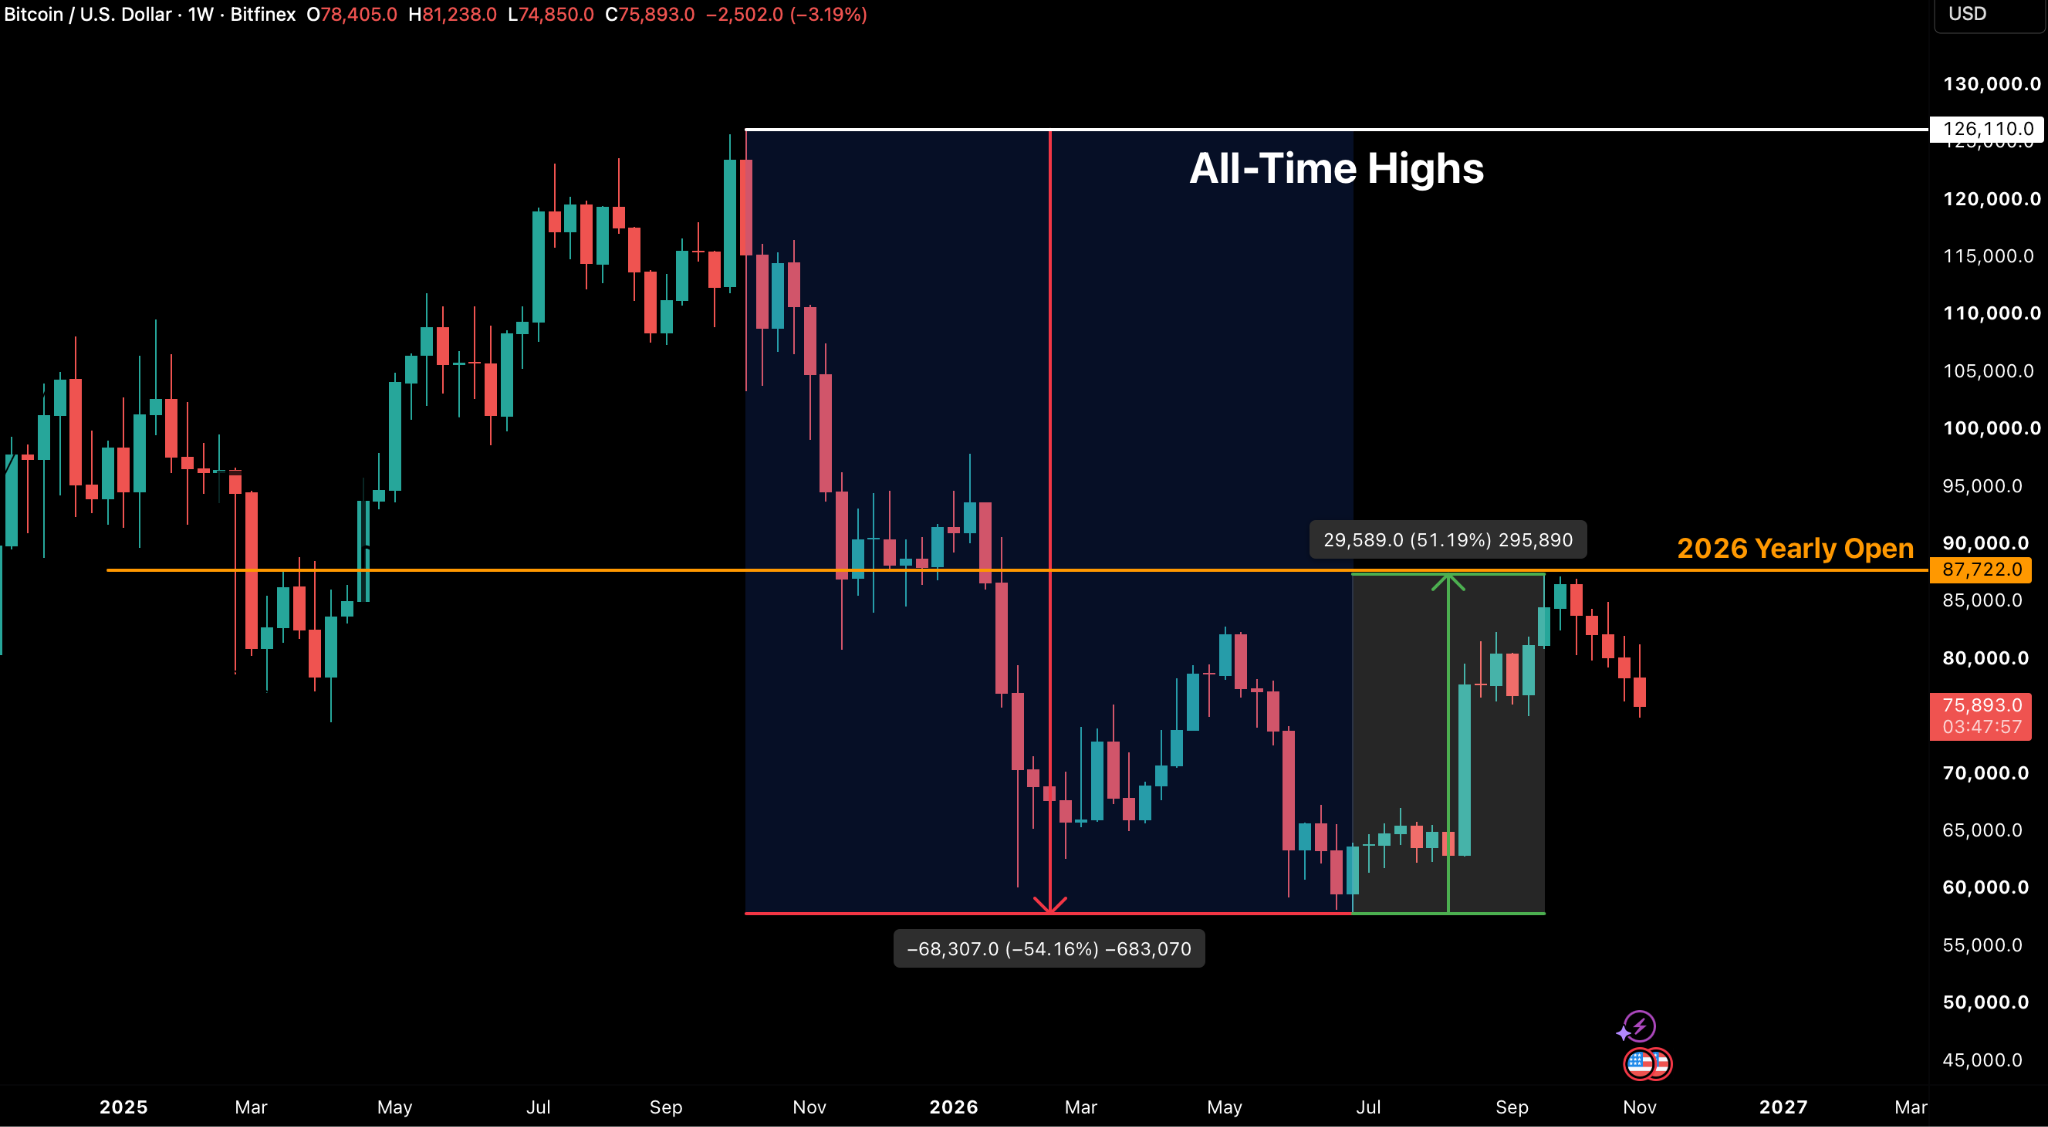
Historically, four weeks after those losing streaks ended, the median return was negative (-ve) 14.1 percent, with only two of the five periods recording positive returns. Twelve weeks after the streak, the median return was +1.5 percent, with three of five positive. In three of the five cases, the low of the following quarter was 20 to 35 percent below the streak’s close. These precedents suggest that a losing streak of this length is more likely to be followed by further downside or a period of consolidation than a V-shaped recovery and that a recovery, when it does come, will be slow.
The 8 November low of $73,470 took the pullback from the 21 September high of $87,392 to 15.93 percent, the deepest of the uptrend that began at the 1 July low of $57,803, and under key support band and cost basis levels. In every earlier five-week streak, the fifth red week closed well below the short-term holder cost basis (STHCB), with short-term holders (STHs) already underwater and contributing to selling pressure. This time, the cohort was at breakeven as the fifth week began, and the Spent Output Profit Ratio (SOPR) data indicates that selling pressure from STHs has been relatively low.
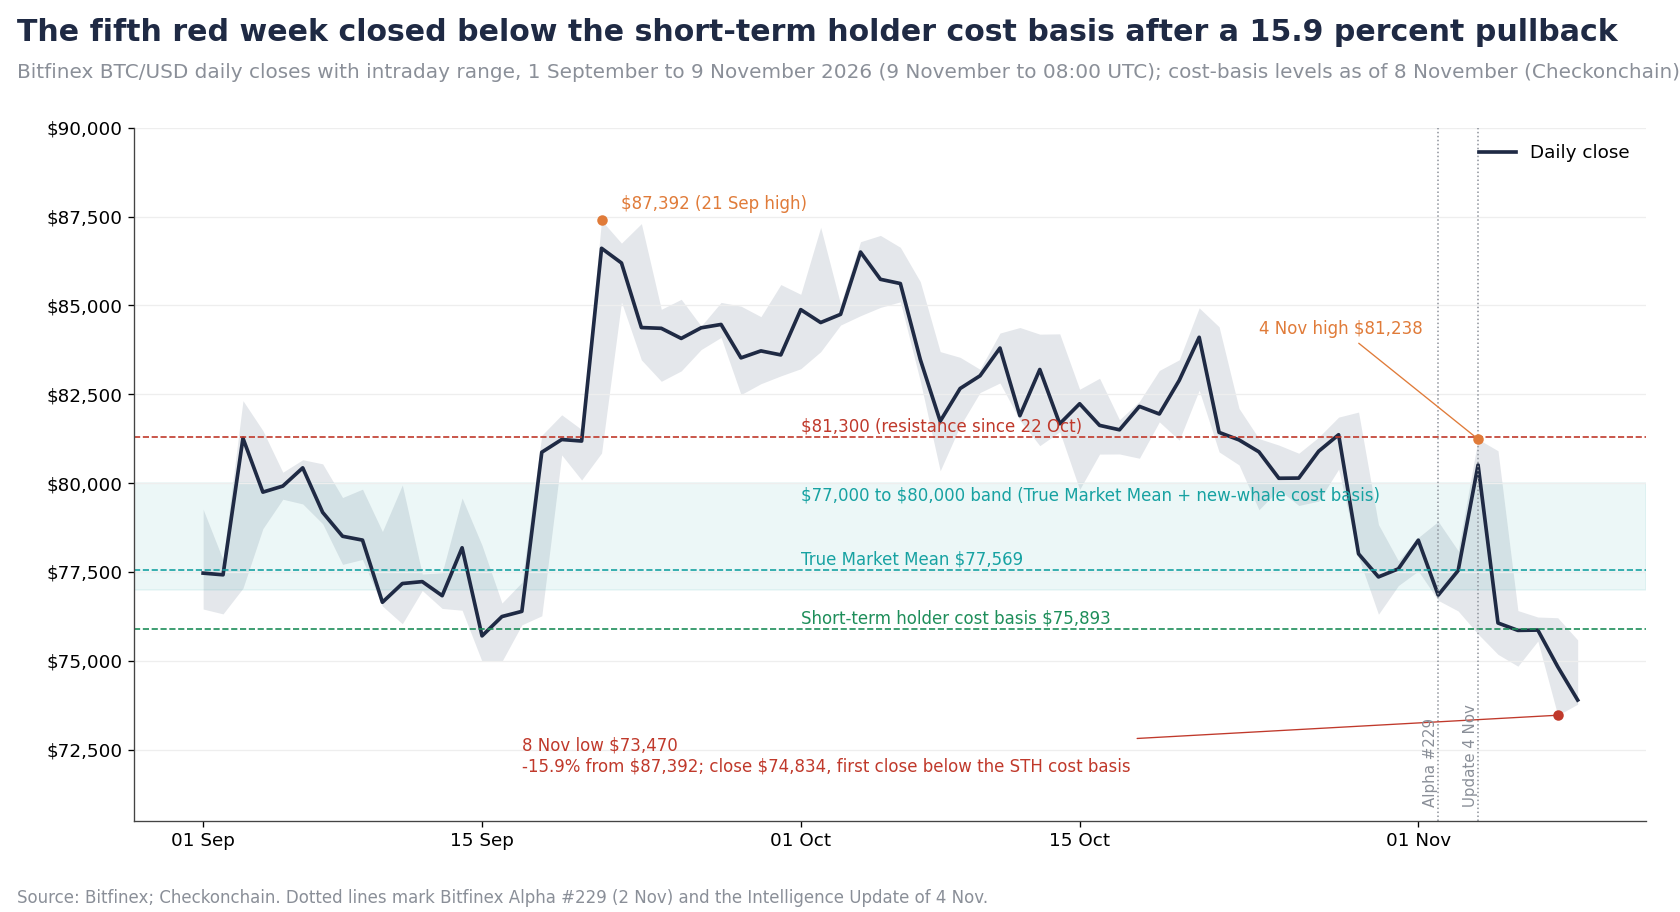
There was a brief post-midterm rally, lifting bitcoin from an election-night low of $75,754 to a high of $81,238 on 4 November, within $62 of the $81,300 support-turned-resistance level that has capped every recovery since 22 October. That level is where the largest block of October buyers has their cost basis and coincides with the highest volume node (the price level where the most trading volume was transacted). Having spent three weeks underwater, these buyers sold into the rally as price approached breakeven. The upward move was built on short liquidations and the unwinding of event-based hedges rather than new demand, with ETFs recording just $74.6 million in inflows that day. Rallies without aggressive spot demand rarely sustain themselves.
The fall that followed was bigger than the bounce. The Nasdaq 100’s 6.4 percent drop on 5 November saw bitcoin give back the entire election move, and Friday’s strong jobs report pushed it towards the STHCB. Selling continued into Sunday. The 8 November close of $74,834 was the first daily close below the cost basis of this uptrend. The STH cohort is now underwater and, historically, this adds to selling pressure and downward momentum.
Whether that happens again is the question for the week, and the on-chain data suggest that a more aggressive sell-off is not yet inevitable. Selling pressure so far has been absorbed in an orderly manner. Coins bought in late October at $77,000 to $80,000 have moved into new hands $2,000 to $5,000 lower, with approximately 268,000 BTC changing hands since 4 November. Losses meanwhile are being realised at roughly a quarter of the daily pace seen in the May to July capitulation.
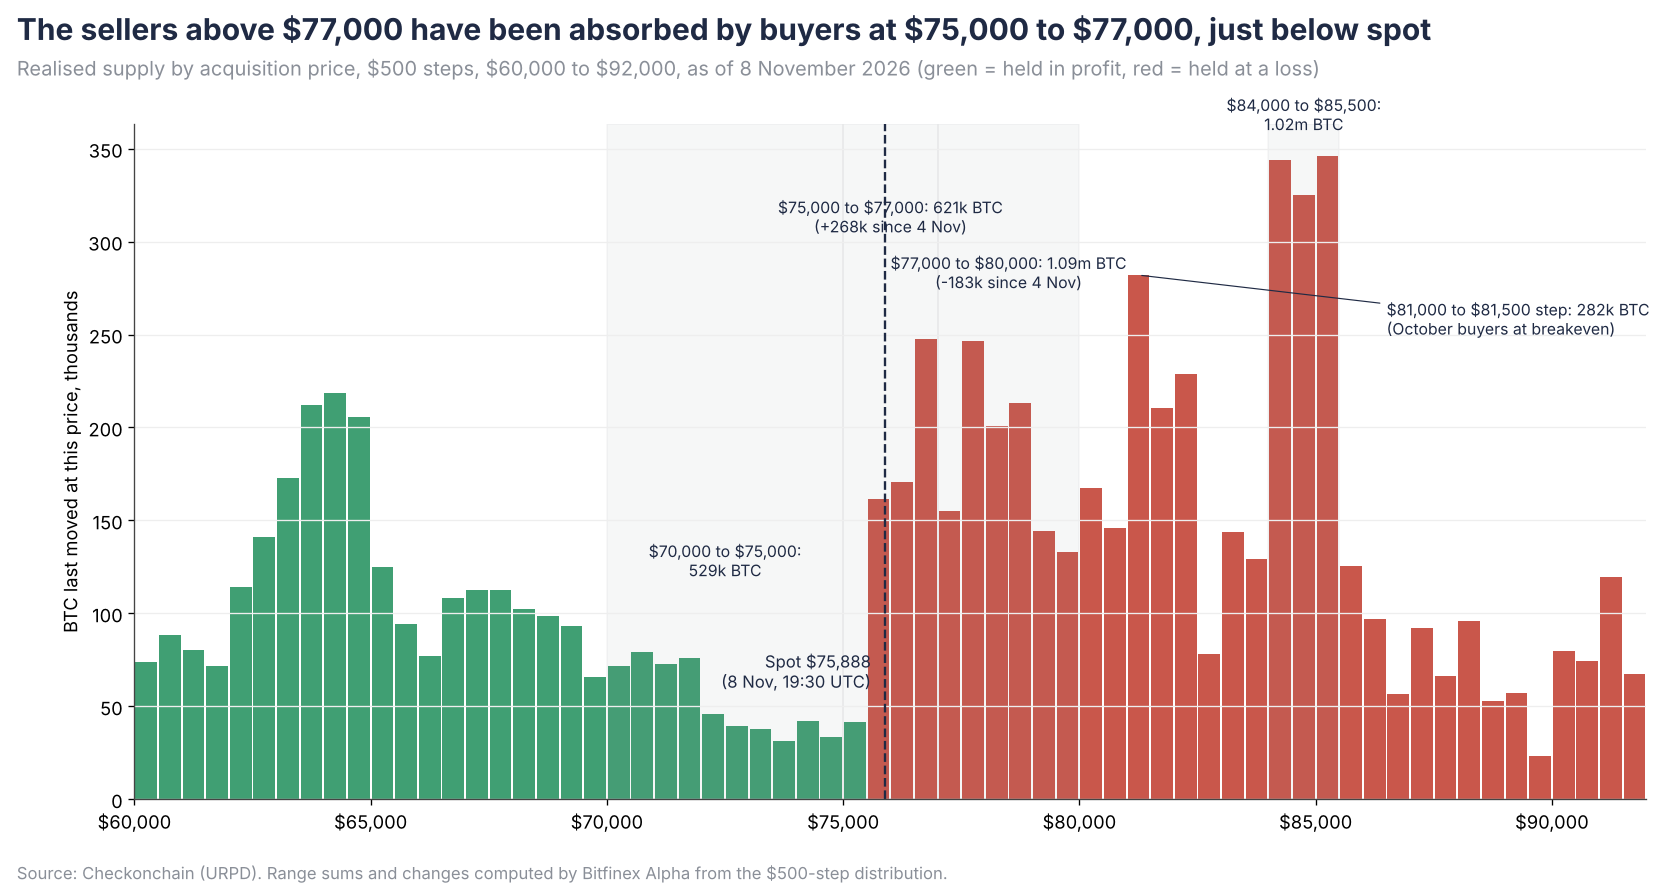
The problem is what this implies for the recovery. Supply is thin beneath the market and heavy above it. Any rally into $77,500 to $78,500 is likely to meet a wall of breakeven sellers, while a loss of $73,000 opens the way to $71,355, the lower cost-basis band, with little on-chain support in between. The path of least resistance remains lower until spot demand returns.
Spot Holders Realised Losses for 10 Straight Days
Spot buyers typically tolerate larger drawdowns than perp or futures traders. Last week’s bid under $77,000 was from the latter. Aggregate futures open interest fell as the election rally forced shorts out, then rose 3.5 percent through the 5 November drop even as price fell 5.5 percent. The spot cumulative volume delta (CVD) remained relatively flat and the spot orderbook remained thin. This is the fifth time since early October that traders have added leverage into a fall. Each of the four previous instances ended in a long liquidation event of more than $800 million, and each time open interest was higher afterwards than before.
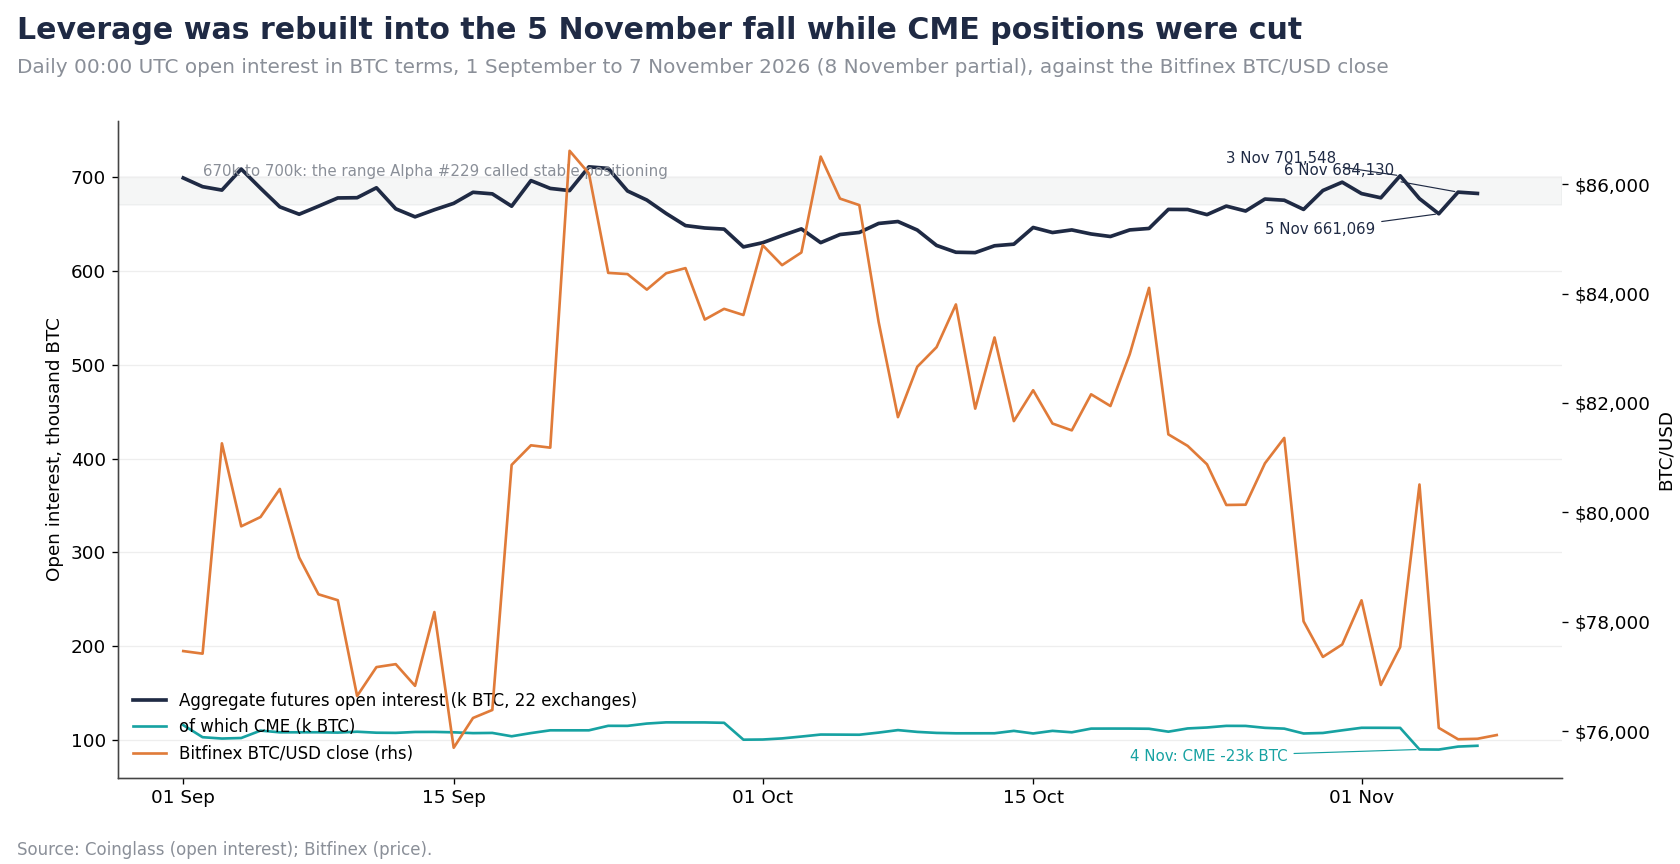
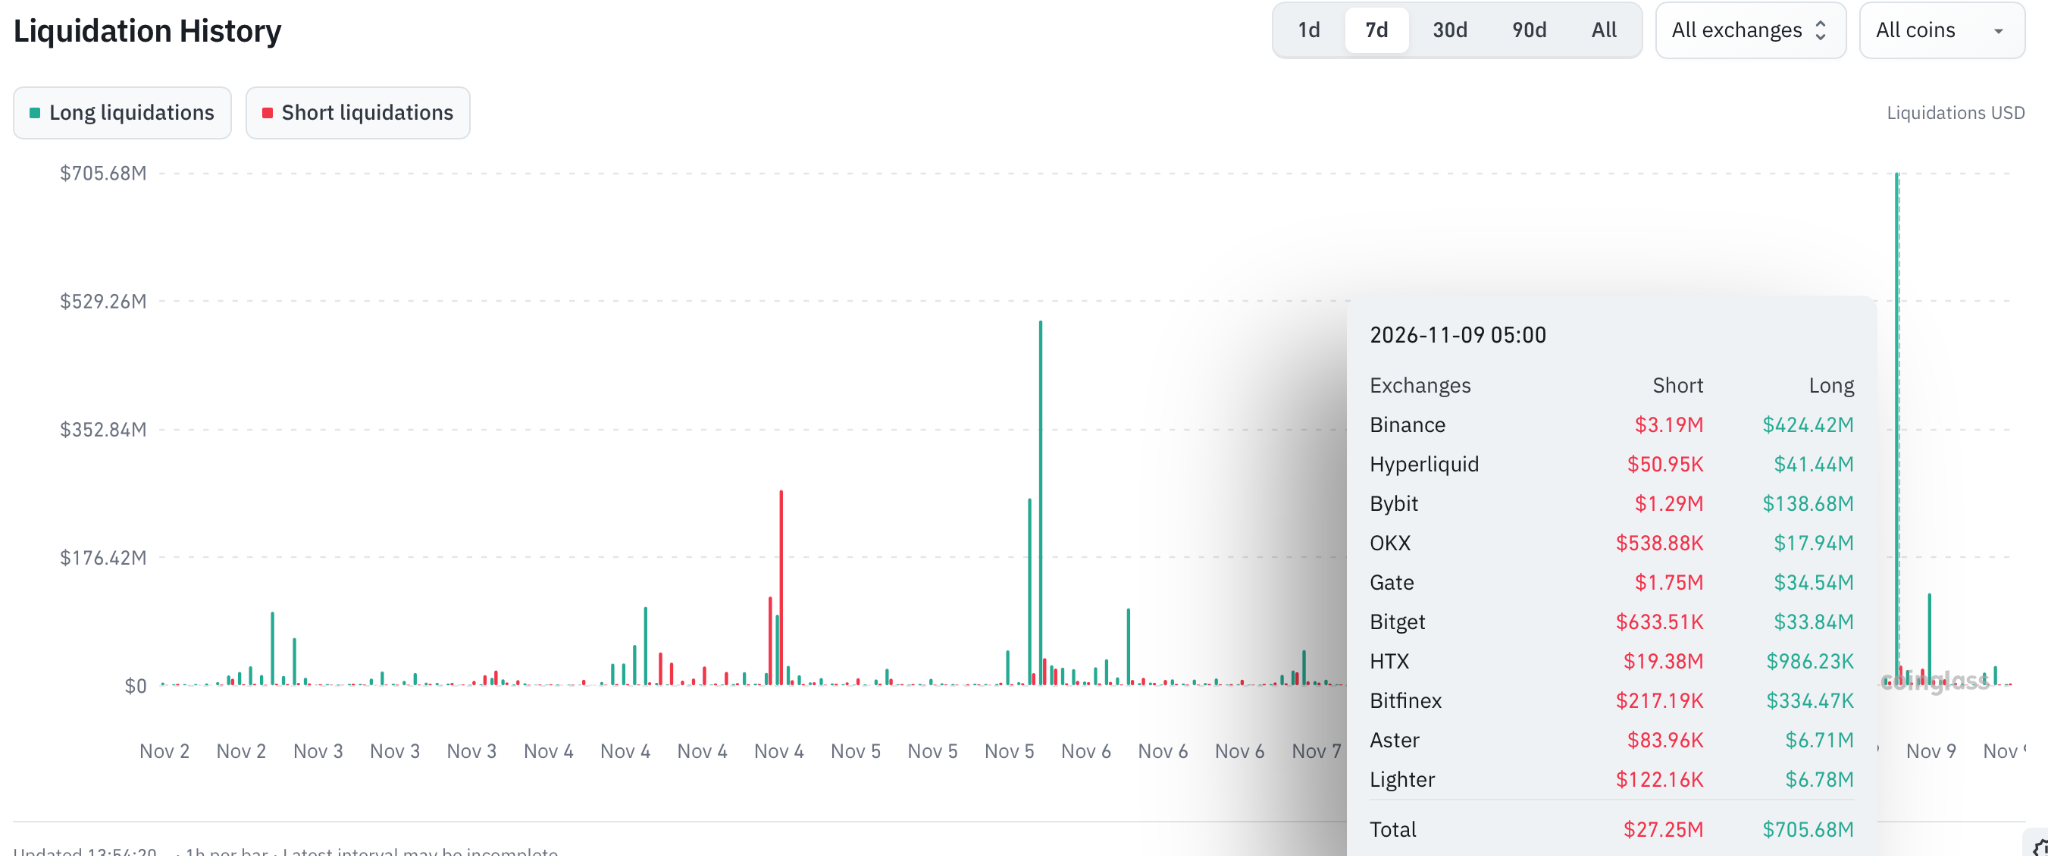
The consequence is already visible. Thursday’s liquidations were about $1.24 billion across all coins and $327 million in bitcoin, nine-tenths of them longs. Open interest was higher the following day — the fifth time in a month that pattern has repeated. Regulated venues did not join in. CME open interest fell by about 15 percent between 3 and 8 November while the offshore aggregate rose, suggesting that the re-leveraging is retail and offshore rather than institutional. A market held up by perpetual longs rather than spot bids tends to break levels in cascades rather than grind through them, and that is how the cost basis was lost on Sunday.
Funding is the one improvement. Perpetual rates stayed positive through election week and spiked to 18.7 percent annualised at the peak of the move around $81,300. They faded to near zero by Sunday. That meets the first of last week’s conditions, but it is a necessary rather than a sufficient one. Cheap leverage tells us longs are no longer crowded, not that anyone is buying.
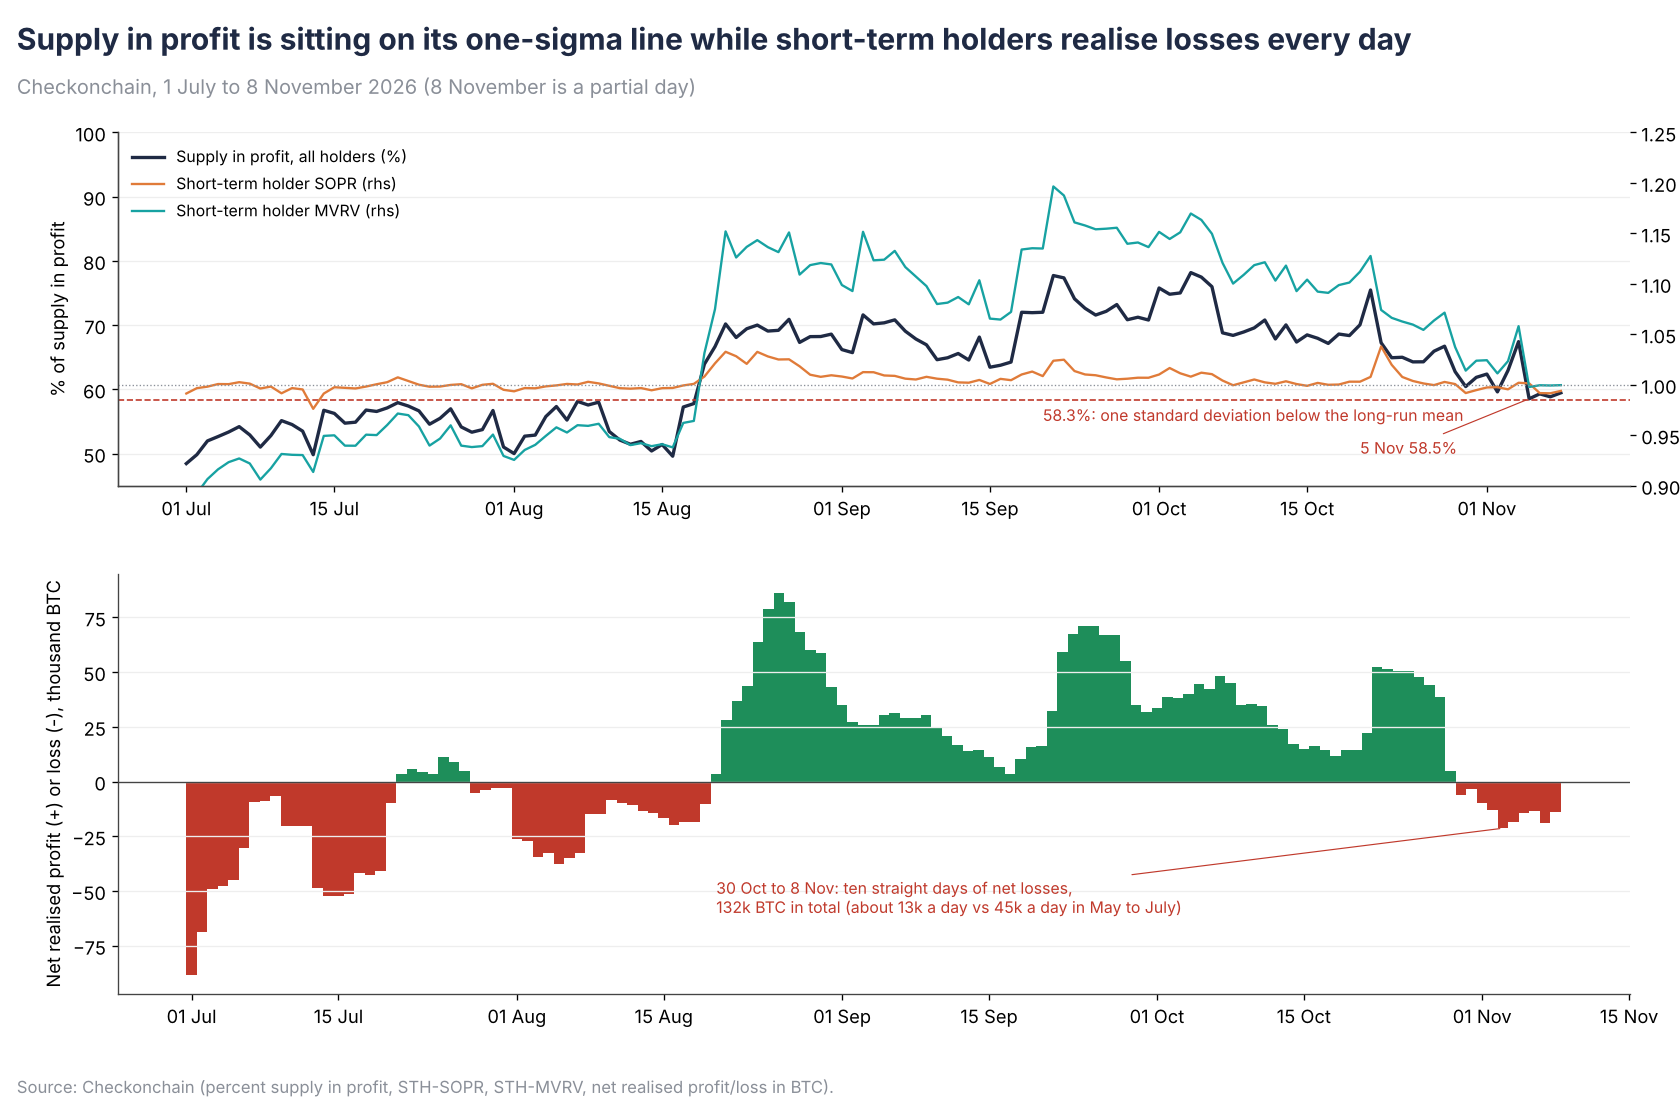
STHs have sold at a loss on nine of the last 11 days, and the market as a whole has realised net losses for ten consecutive days, the longest run since August. Two details lead us to conclude that this is a correction rather than a capitulation.
Firstly, the daily pace of losses is about a quarter of the May to July washout. Secondly, the share of total supply held above the 58.3 percent line that has separated corrections from deeper resets in every cycle since 2017. The ratio is currently touching 54 percent. That line is now the single most important on-chain number in this report.A sustained break would mean the October buyers have stopped absorbing and started distributing.
The demand that has historically absorbed selling pressure has not arrived. US spot bitcoin ETFs saw a $1.28 billion net outflow last week — the largest weekly outflow since June and the sixth largest of the year. Net ETF flows for 2026 turned negative on 3 November.
The treasury complex offered no offset, with Strategy adding only 811 BTC. Trump Media moved 4,259 BTC out of wallets labelled as collateral for its 2028 convertible notes and sent them to Crypto.com, one of its two named custodians, on 5 November. On 30 November, holders of those notes can make the company buy them back for cash at par.
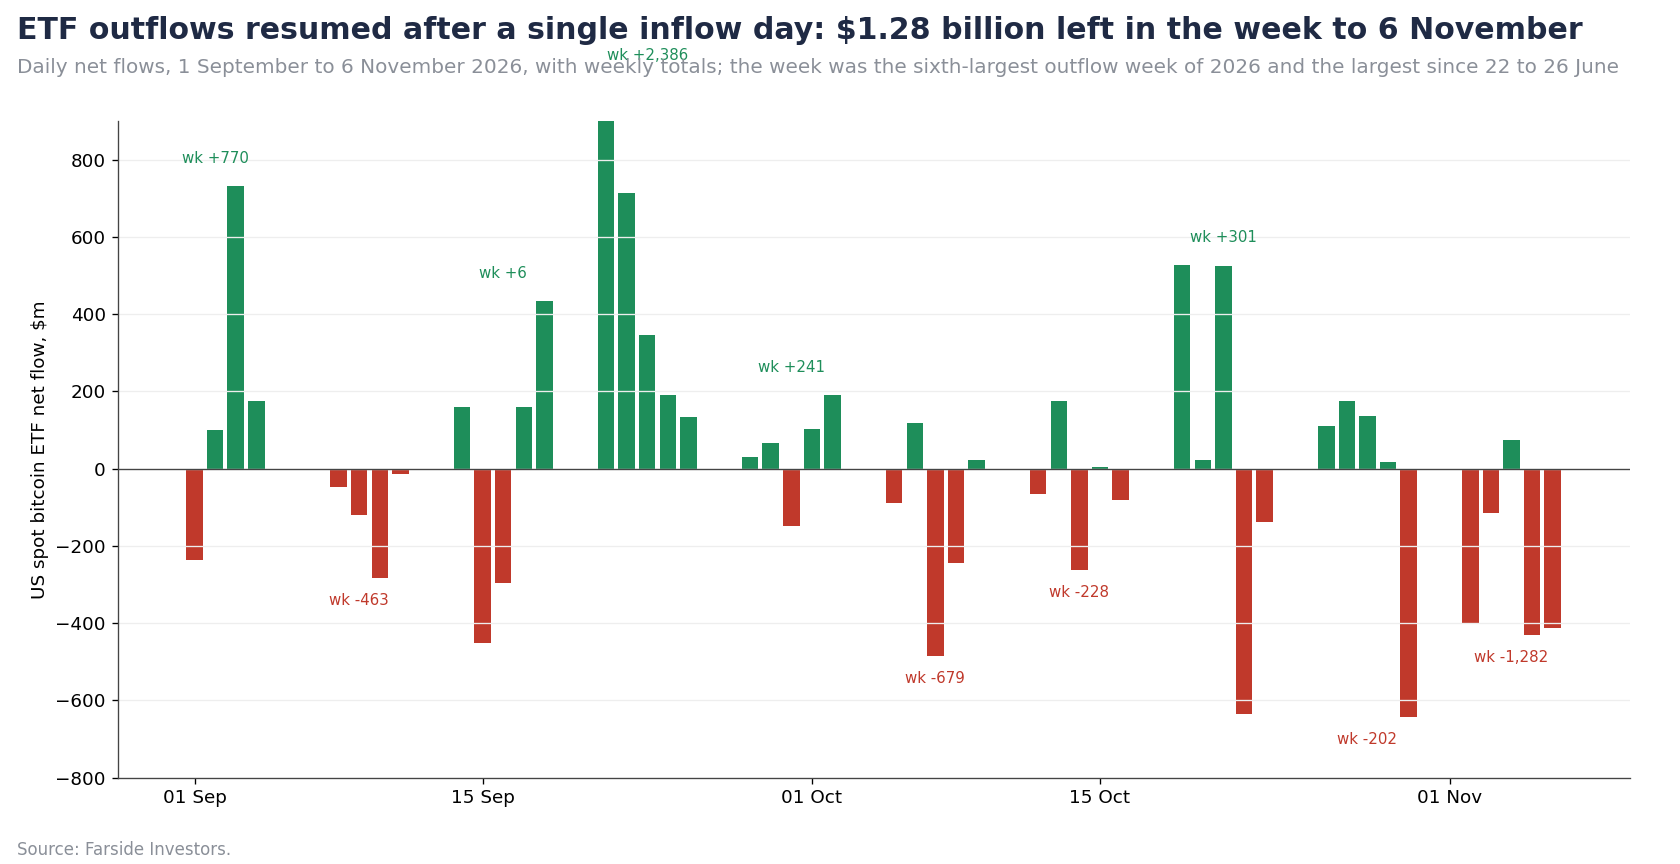
Our 4 November Bitfinex Alpha update set a test for this week. Of the 13 ETF outflow runs lasting at least three days earlier in 2026, five ended with three or more consecutive inflow sessions, after which bitcoin gained a median 6.4 percent over the next ten sessions. The other eight ended with just one or two inflow sessions and were followed by a median decline of 1.2 percent.
This run ended with a single inflow day, and bitcoin fell 5.8 percent in the two sessions after it. Until ETFs record three consecutive inflow sessions, rallies are more likely to represent mechanical bounces than a sustained recovery in spot demand.
The average ETF buyer is 10.5 percent underwater against a cost basis of $84,652, which sits above the $84,000 to $85,500 overhead supply of 1.01 million BTC. A recovery would face two layers of breakeven selling before any new high.
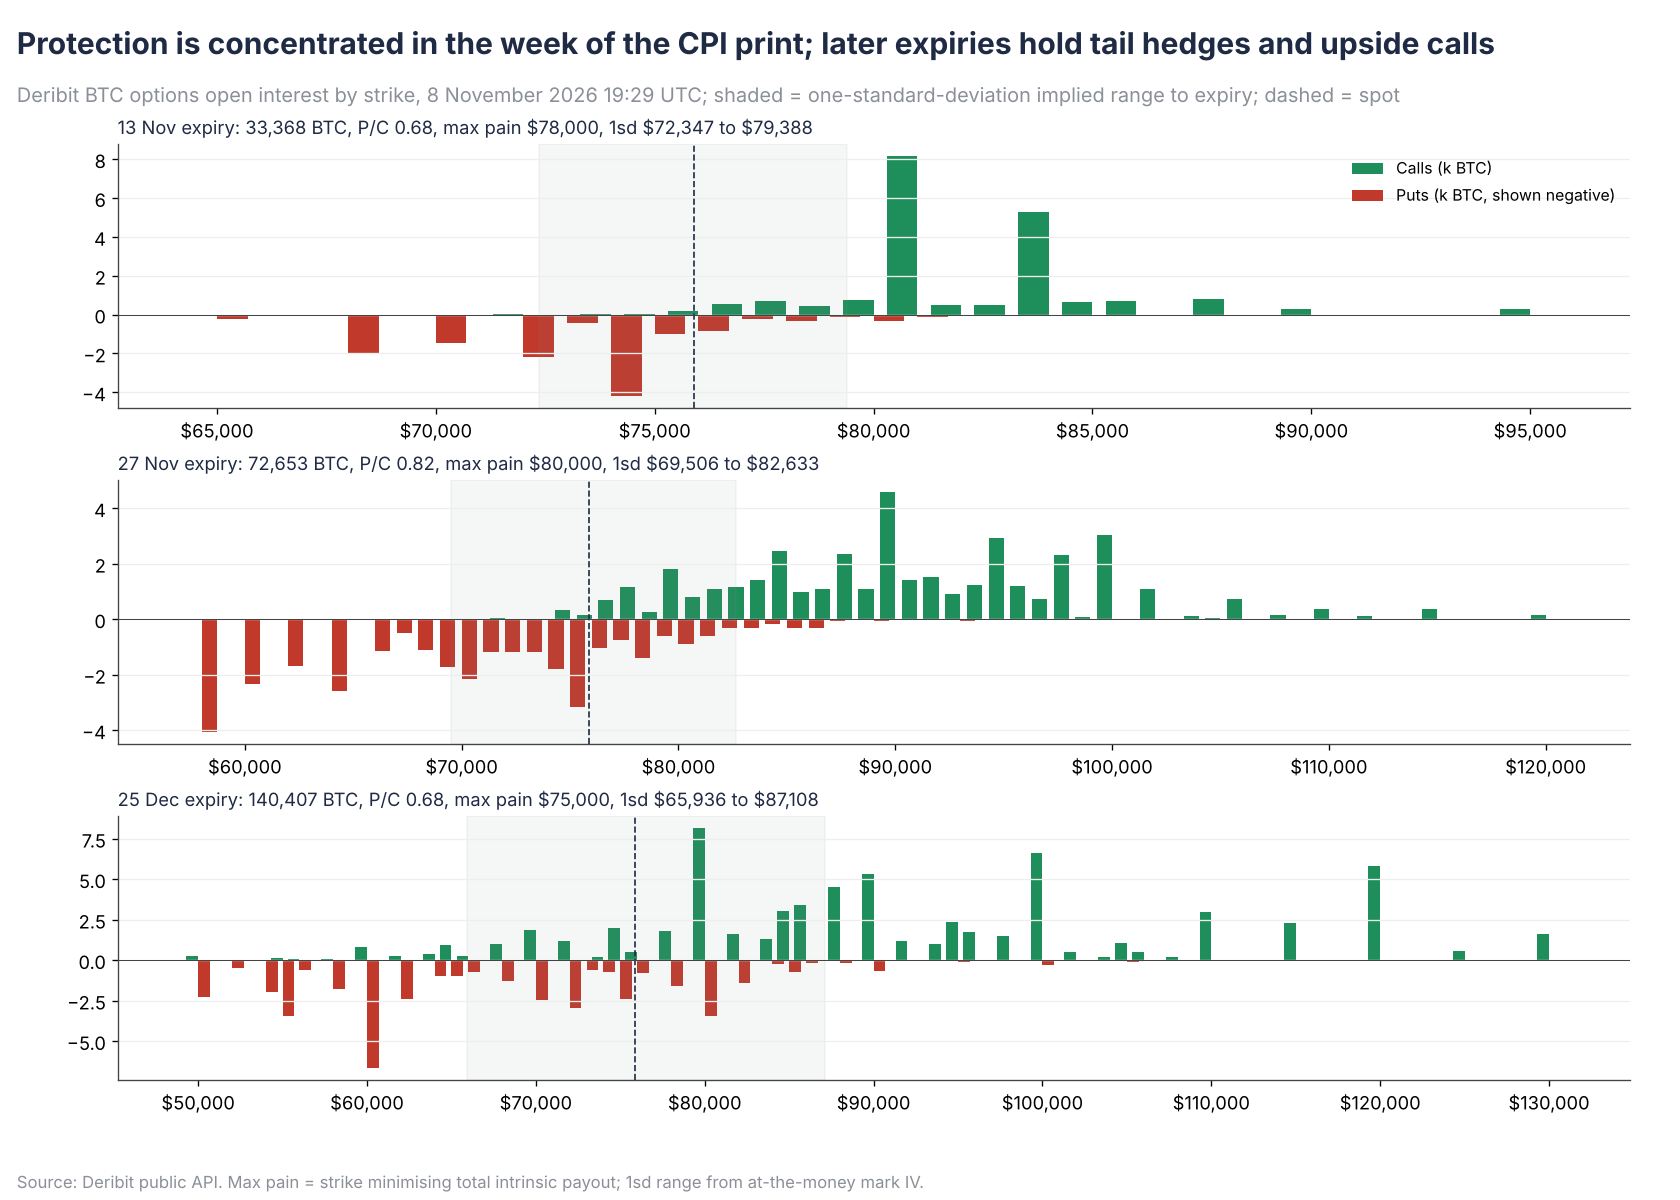
The options market agrees. Implied volatility on the 13 November expiry climbed over the weekend ahead of Tuesday’s CPI print, lifting the front of the curve above the 27 November tenor. Puts are stacked at $74,000 and $72,000, just below spot.
Further out the curve, put demand skips the strikes near spot and clusters at $58,000 to $64,000, consistent with demand for tail insurance. Traders are positioned for a rough week and are paying little for near-spot protection beyond it. The one-standard-deviation range to Friday’s expiry runs from $72,350 to $79,400. With price already in the lower third of that band, the burden of proof sits with buyers.

Catalysts and Risks
The Election Result Hit the AI Trade and Bitcoin
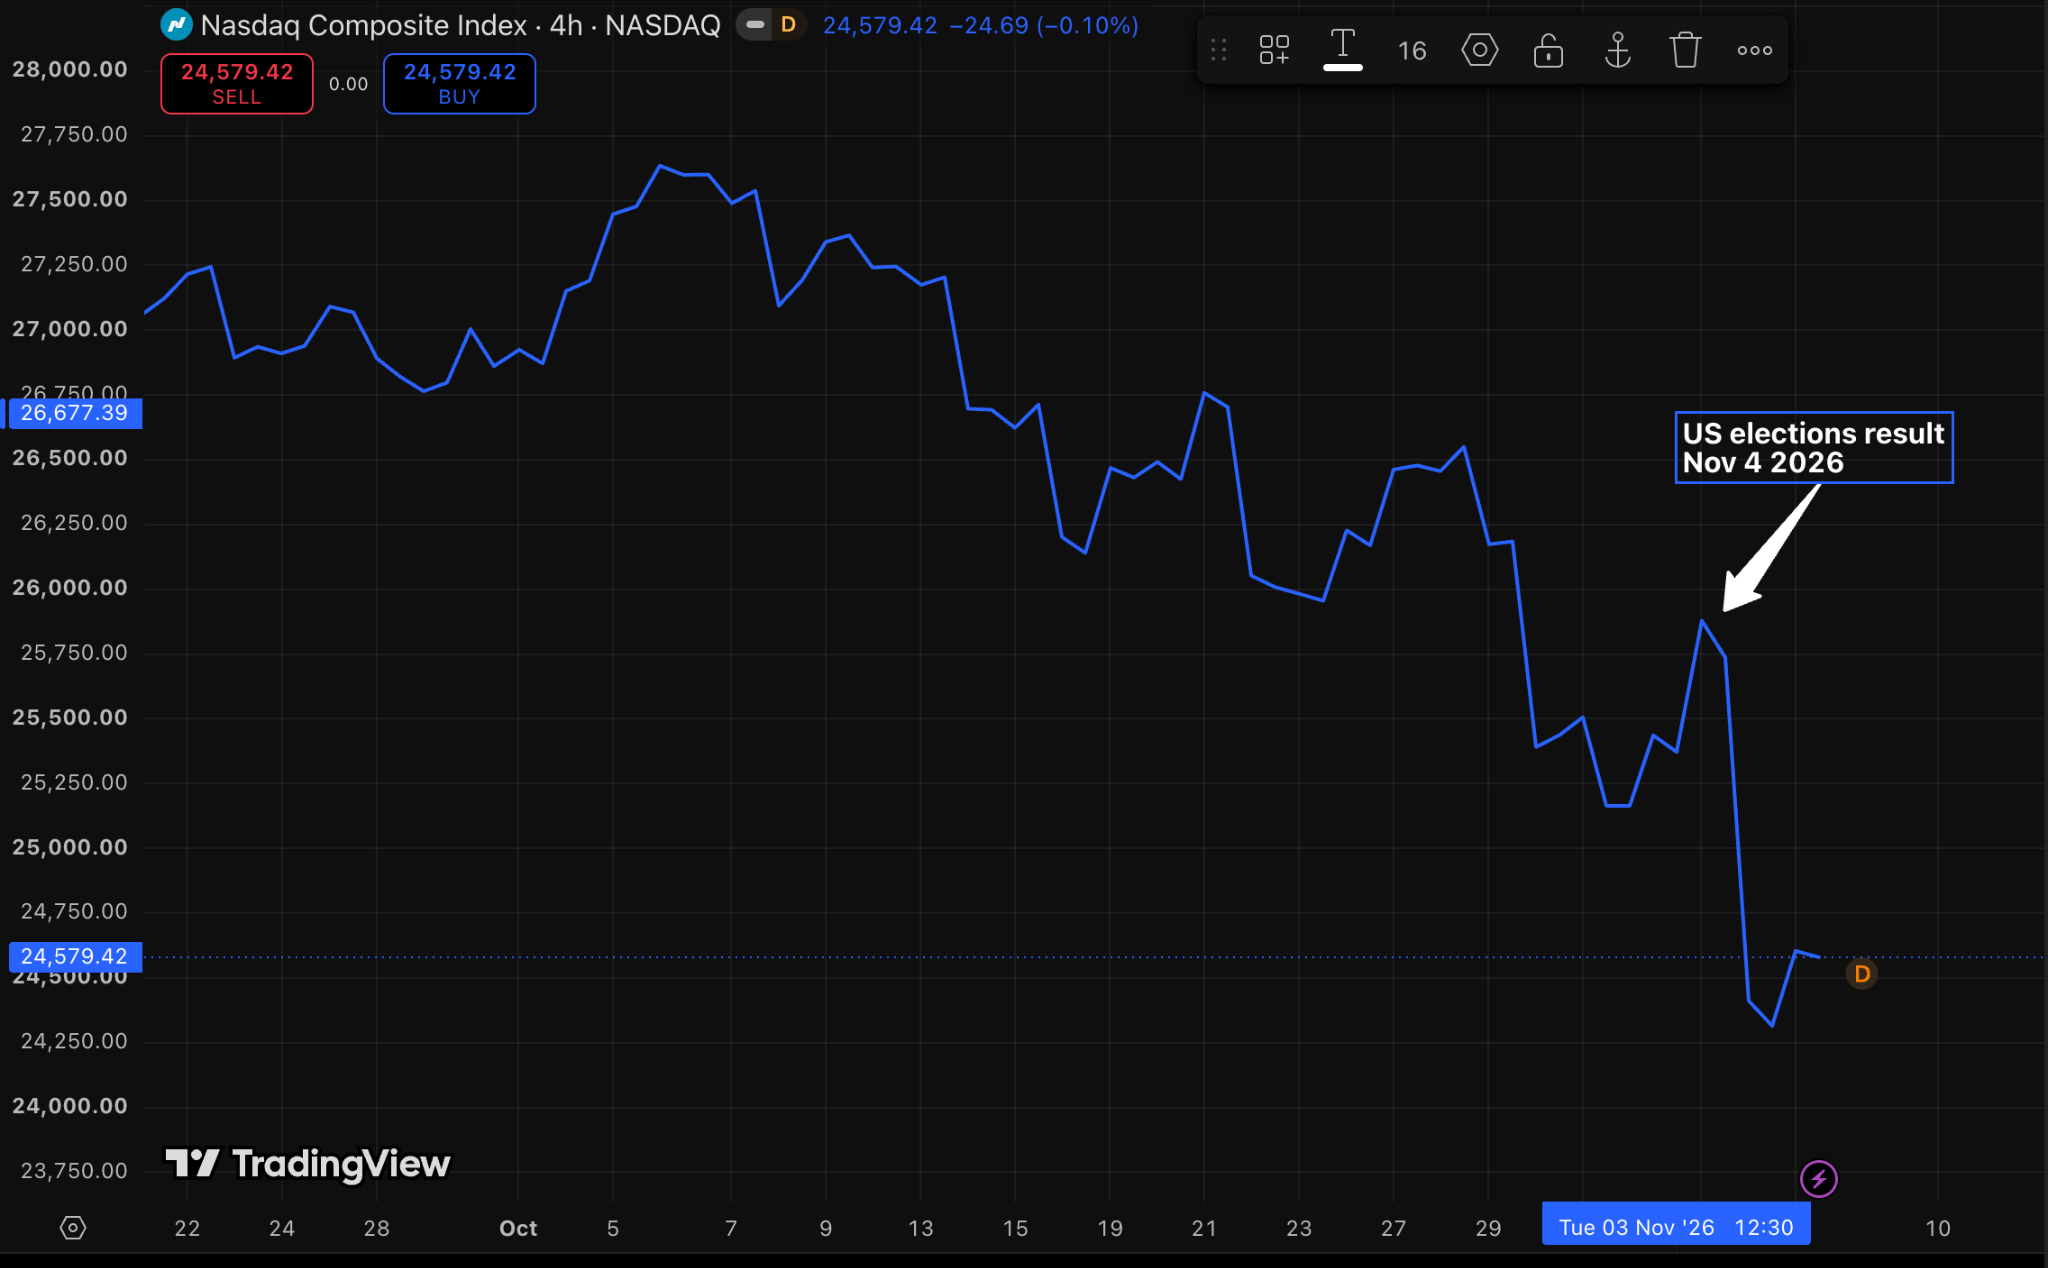
Democrats won control of the House and the Senate in the 3 November US midterm elections, a larger swing than polling had implied. Equities initially rose following the result, but subsequently reversed course after statements from Democratic lawmakers calling for a pause on advanced AI development and a national data centre moratorium. With new Democratic Party majorities in Congress and in state capitals across the country, including Texas, one of the largest data centre markets, investors began pricing in the risk of slower and more costly AI infrastructure development. The Nasdaq closed about 12 percent below its recent peak on 5 November, surpassing the 10 percent threshold that defines a correction, before a partial rebound on 6 November.
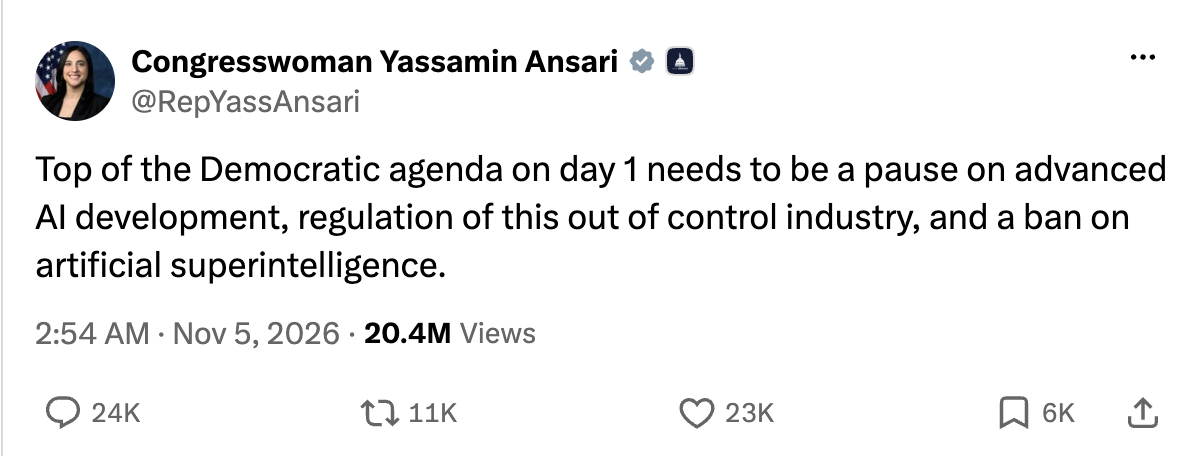
It is important to note, however, that nothing has been enacted, and legislation that limits AI would still require presidential approval or sufficient congressional support to override a veto. We see last week’s sell-off therefore as a repricing of policy risk within a capital-spending cycle funded by credit rather than cash flow, with bitcoin increasingly trading as part of that cycle over the past month.
Bitcoin’s 30-day correlation with the Nasdaq 100 rose to 0.72 by 6 November, placing it in the 98th of readings since 2020. With a beta of 0.79, bitcoin’s near-term outlook is closely tied to what happens next in equities.
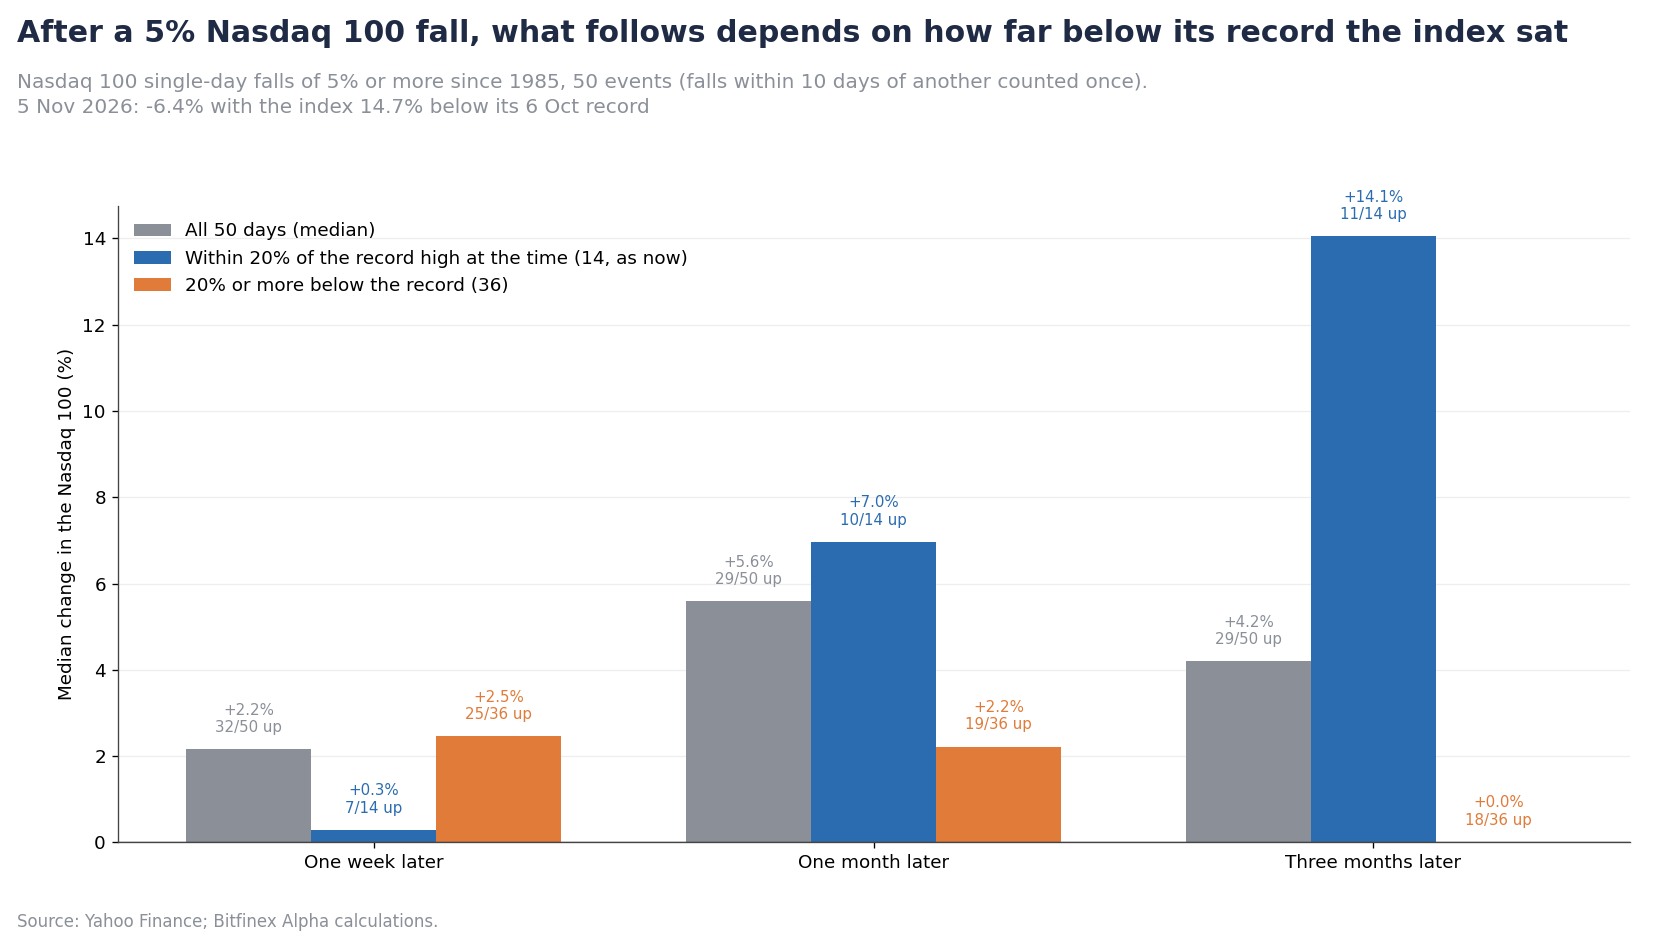
To assess the implications, we examined every single-day Nasdaq 100 decline of at least five percent or more since 1985. After grouping declines occurring within ten days of each other, the sample comprises 50 events. Across the full sample, the median return was a 2.2 percent gain one week later and 5.6 percent one month later, with 29 of 50 observations positive at both one and three months.
The results diverge considerably depending on the prevailing market regime. When the Nasdaq 100 was within 20 percent of its record high at the time of the decline, the median one-month return was 7.0 percent, with 10 of 14 observations positive. The median three-month return was 14.1 percent, with 11 of 14 positive. By contrast, when the index was already 20 percent or more below its record, the three-month median was zero, with only 18 of 36 observations positive. These events largely occurred during the 2000-2002 and 2008 bear markets.
History suggests that a five percent single-day decline when equities remain within 20 percent of their record high is more often followed by a recovery than further sustained weakness. The same decline occurring within an established bear market has provided little indication of subsequent direction.
Bitcoin’s own historical record is more limited and less encouraging in the immediate aftermath. Of the seven Nasdaq 100 declines of at least five percent since 2020, bitcoin fell on six occasions by a median of 6.3 percent on the day. Its median one-week return was negative 3.8 percent.
Over three months, however, the outcomes again diverged by market regime. The four instances occurring within corrections from record highs, in 2020 and April 2025, were followed by bitcoin returns ranging from +7 to +53 percent. The three instances during the 2022 bear market were followed by losses of 16 to 41 percent.
These precedents point to a potentially weak week for bitcoin but a stronger subsequent quarter if the equity correction remains contained. That puts particular importance on the Nasdaq 100’s 5 November low of 26,606. A break below that level would challenge the recovery scenario and increase the risk of a more prolonged equity-led decline in bitcoin.

Strong Hiring Locks in December
The latest economic data support the case for a rate hike at the next Federal Open Market Committee (FOMC) meeting in December. The Bureau of Labor Statistics (BLS) reported on 6 November that employers added 165,000 jobs in October, significantly above a consensus forecast of near 60,000, with August and September figures revised up by a combined 84,000. The headline October figure actually overstates the longer-term pace of growth, with employment gains averaging 83,000 jobs a month over the past six months. With labour force participation flat at 61.9 percent since January, the economy requires relatively modest job creation to keep unemployment steady, which is why the unemployment rate dropped marginally to 4.1 percent in October.
Wages however are not the main source of price pressure as average hourly earnings rose just 0.4 percent on the month and 3.1 percent on the year, below the 3.7 percent rate in September, suggesting that real wages are declining after adjusting for inflation.
CME FedWatch indicates a 78.5 percent chance of a quarter-point hike at the 8-9 December FOMC meeting.
The channel that matters most for bitcoin also did not tighten. The 10-year real yield is currently at 2.63 percent, while the nominal 10-year fell from 4.95 percent on 3 November to 4.86 percent on 6 November as the equity sell-off pushed money into Treasuries. The 2-year is now down to 4.51 percent, a level consistent with one more hike and little more after it.
What comes after December is the open question. One reading is that the economic expansion remains firm, and third-quarter growth of 3.4 percent carries into year end, with AI repricing doing little to push growth below trend. The other is that growth is peaking: a data centre slowdown removes one of the year’s main drivers, and fuel prices, with gasoline up 9.1 percent in September alone, are already weighing on demand. Under this scenario, the December hike is the last and the next move gets priced out.
This Tuesday’s October Consumer Price Index data, and the Real Earnings release that accompanies it, will decide which reading the market pays for.
If October core CPI, the monthly change in prices excluding food and energy, comes in at 0.3 percent] or more, inflation is holding and the market will keep pricing a quarter-point rate hike at the December meeting at roughly 78 percent odds. Treasury yields would rise in response, and the 10-year real yield, the return on Treasuries after inflation that bitcoin has to compete with, would move from about 2.6 percent towards 2.8 percent. A higher real yield will make holding the asset more costly relative to bonds.
If core CPI comes in at 0.2 percent or less and gasoline prices are falling, the market would start to doubt the hike. The odds of a December increase would likely drop below 60 percent, and the 2-year Treasury yield would fall back below the 4.46 percent it touched on 5 November. The 10-year real yield would move towards 2.5 percent. A lower real yield makes bitcoin cheaper to hold relative to bonds.

Outlook for the Week
Base Case
We expect bitcoin to trade within the $72,350 to $79,400 range implied by options for the 13 November expiry, and to spend most of the week in its lower half. The short-term holder cost basis at $75,893 was lost on Sunday’s close. The 10-year real-yield hurdle stays between 2.5 and 2.8 percent through the 10 November CPI, so bitcoin’s downside this week comes from the equity channel rather than the rates channel. If the Nasdaq holds its 5 November low, bitcoin can retest the $77,000 to $80,000 band it lost for an underside retest. Rallies into $75,900 to $77,500 are likely to be sold until spot demand returns, and a sustained reclaim of the STHCB is the minimum threshold for a recovery before the True Market Mean at $77,569 comes into view.

What Would Confirm It
On positioning, open interest holding between 670,000 and 700,000 BTC with funding near zero, supply in profit holding above 58.3 percent and no single long liquidation event above $500 million. Together, these would indicate that the leverage added during the fall is being worked off rather than forced out and that the correction remains orderly. On macro, October core CPI at 0.3 percent on 10 November, the December hike probability settling between 70 and 85 percent on CME FedWatch, and the 10-year real yield holding between 2.5 and 2.8 percent, with bitcoin’s daily moves continuing to track the Nasdaq 100 rather than Treasury yields.

What Would Invalidate It
Core CPI at 0.4 percent or more would likely lift the 10-year real yield above 2.8 percent and push the probability of a rate hike in December above 90 percent, with bitcoin falling on the day while equities are flat or higher. That would mean rates, not the AI repricing, have become the dominant influence again.
Supply in profit remaining below 58.3 percent.
Continued ETF outflows, particularly those exceeding $300 million per day
Core CPI at 0.2 percent or less that pulls the December hike probability below 60 percent and the 10-year real yield below 2.5 percent. That would remove the macro hurdle entirely; if bitcoin still fails to recover above $80,000 as the Nasdaq stabilises, spot demand rather than macro is the constraint.
A Nasdaq Composite close below its 5 November low while the real yield stays near 2.6 percent, accompanied by bitcoin remaining below the short-term holder cost basis.

What to Watch
October CPI and Real Earnings, Tuesday 10 November, 13:30 UTC: core CPI relative to 0.3 percent, gasoline relative to September’s 9.1 percent increase.
The Nasdaq 100 relative to its 5 November low, at each US market close.
CME FedWatch December rate-hike probability relative to 78.5 percent, with 60 and 90 percent as the thresholds that change the view.
The 10-year real yield relative to 2.5 and 2.8 percent, and the 2-year yield relative to 4.46 percent.
Chicago Fed National Financial Conditions Index, Thursday 12 November: the first reading to include the 5 November sell-off. The previous reading was minus 0.459 for the week ending 30 October, following weekly tightening since mid-September.
Freddie Mac 30-year mortgage rate, Thursday 12 November, following a reading of 7.18 percent on 5 November, its third weekly decline
The SEC’s crypto broker-dealer rule, logged with the White House regulatory office on 3 November and marked economically significant; text not yet public.