

Issue #231:
Bitcoin Back Where the Rally Began
Bitcoin Tests Its July Base
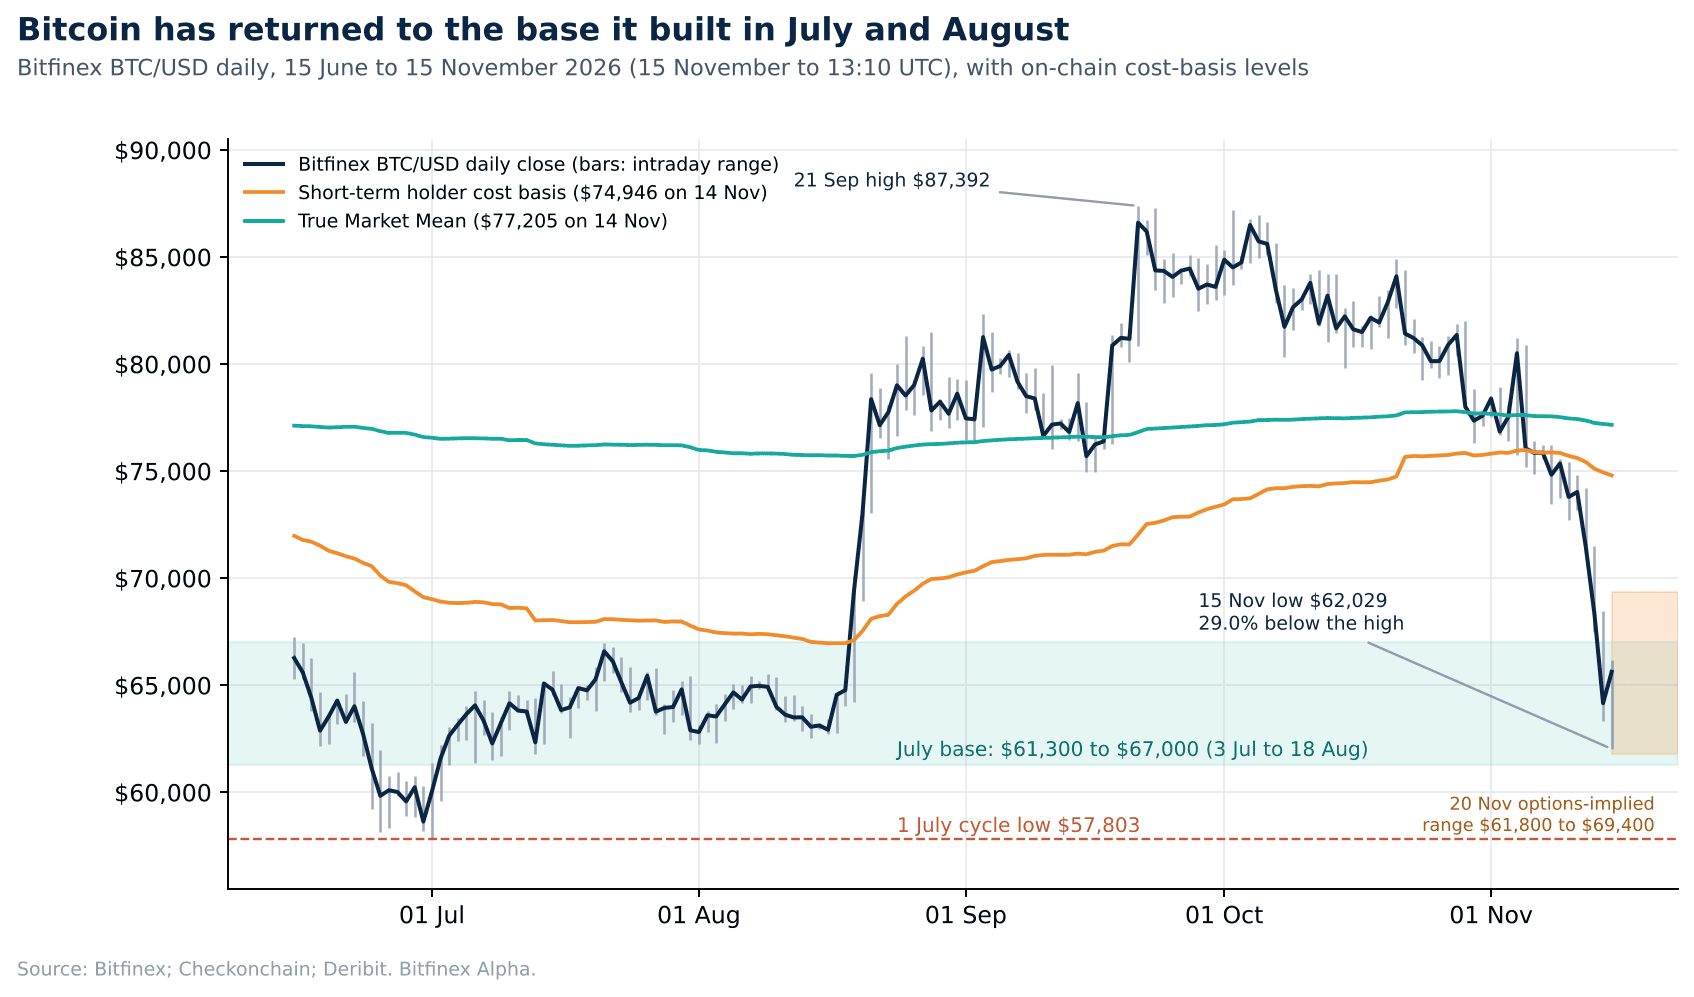
Bitcoin fell 12.6 percent last week, reaching a low of $62,029 on 15 November. It was the sixth consecutive weekly decline and the longest run of losses since 1 March 2025. The decline has returned BTC to a $61,300 to $67,000 range – which we call the July base – and is the range in which BTC traded for almost seven weeks after reaching the cycle low of $57,803 on 1 July. The market focus now is on where BTC trades from here. If a low forms above $57,803, it would preserve the sequence of higher lows established since July. If however, we return to this level, then it would suggest that the earlier rise in BTC from July to September, was simply a bear market rally.
Unlike the equity-driven decline we saw two weeks ago, rising real yields and dollar strength were the principal macroeconomic pressures on bitcoin. The US 10-year real yield rose from 2.63 percent on 6 November to 2.91 percent on 13 November, while the Nasdaq 100 gained 3.5 percent and bitcoin fell 9.9 percent over the same five sessions. Gold also fell more than 4.8 percent, suggesting that dollar strength was weighing on non-yielding assets more broadly, rather than bitcoin alone.
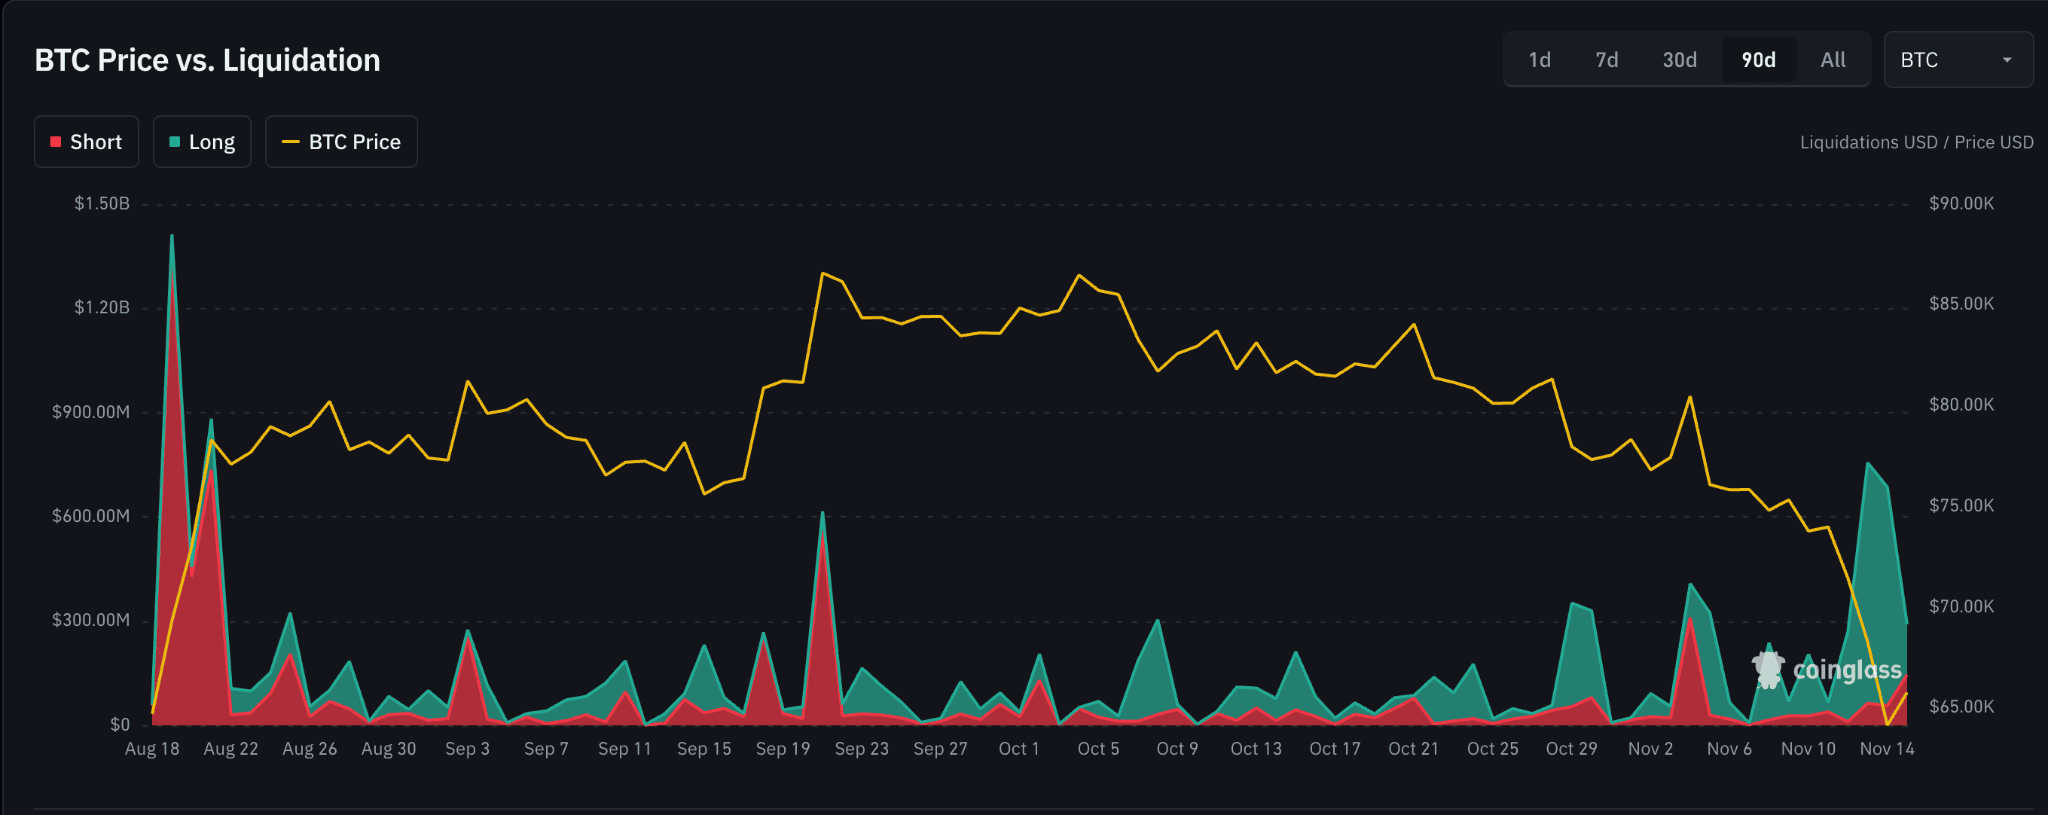
Positioning has only begun to adjust. Futures leverage began to unwind amid $2 billion of liquidations on 14 November. Recent buyers are realising losses at a pace last seen near the July low, and US spot bitcoin ETFs have recorded seven consecutive sessions of outflows. The rebound in the 24 hours from the $62,029 low appears to have been driven primarily by short covering, suggesting a mechanical bounce rather than a sustained recovery in demand.
The October Consumer Price Index (CPI), released on 10 November, showed core prices rising 0.3 percent for a third straight month. That was the level Federal Reserve Governor Christopher Waller had named, hours earlier, as grounds for considering a half-point rate hike in December. As of 15 November, CME FedWatch priced a 25 basis point hike at the December FOMC meeting at 92 percent, with a 8 percent probability of a larger move. The two-year Treasury yield rose from 4.51 percent on 6 November to 4.88 percent on 15 November, and the US Dollar Index traded above 103 its highest level since April 2025.
We expect bitcoin to trade between $61,800 and $69,400 this week, the range implied by options for the 20 November expiry, with risks skewed towards a retest of the $62,029 low. Nvidia’s earnings on 17 November, the Federal Reserve minutes on 18 November and the Anthropic listing on 19 November are among the key upcoming catalysts. Our near-term macro outlook remains cautious while the dollar holds above 103, with a close below that level suggesting that rate-driven demand for dollars is fading.

Market Signals
Price Structure: The July Base Decides Whether the Uptrend Survives
Bitcoin fell to a low of $62,029 on 15 November, placing the last week among the weakest of the year on three measures:
Depth: Bitcoin reached its lowest level since 13 July, sitting 29 percent below the 21 September high of $87,392.
Duration: It marked the sixth consecutive weekly decline, the longest run since 1 March 2025.
Size: It was the largest weekly fall since 1 June, with BTC closing the week at $65,386 on 15 November, down 12.6 percent.
The significance of the BTC price drop lies in the levels it has now reached. Bitcoin is now back inside the $61,300 to $67,000 range in which it traded for almost seven weeks, from 3 July to 18 August, after hitting the cycle low of $57,803 on 1 July. We refer to this range as the July base, because it is where the advance towards September’s highs began, following a recovery above multiple key cost-basis levels.
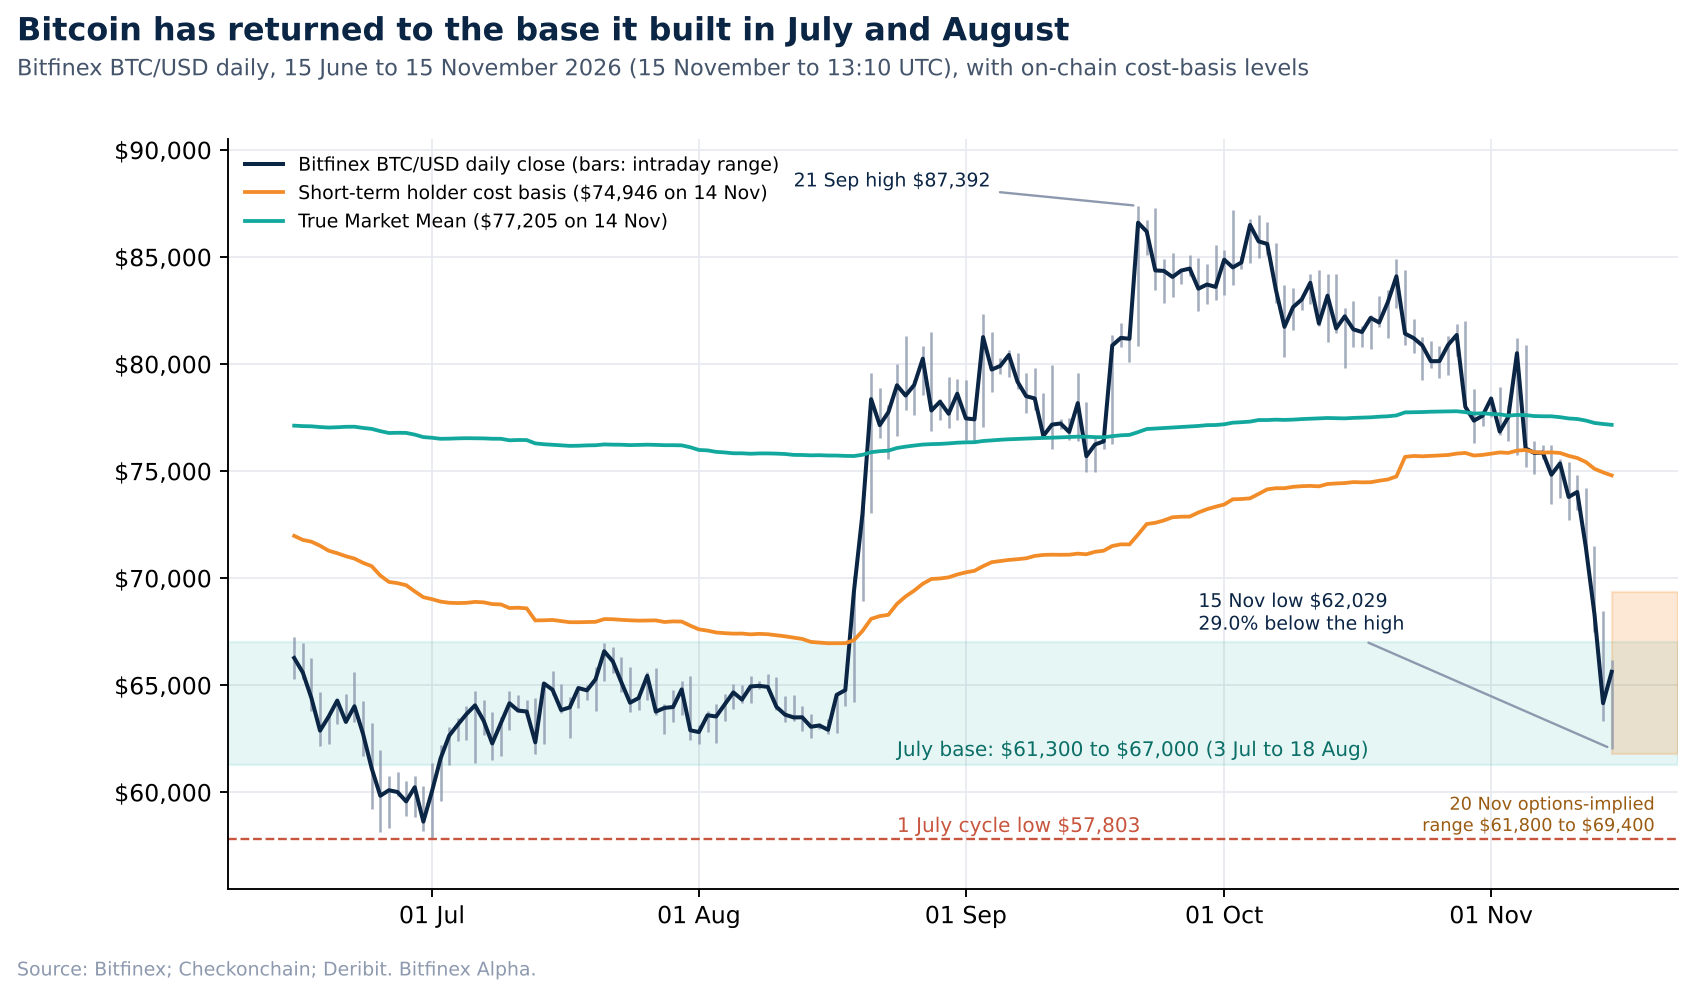
The base is therefore where the market answers the question we raised in last Wednesday’s Intelligence Update of whether the advance from July was the start of a new bull market or a recovery inside a longer bear market. We expected the decline, but it has been more extreme than anticipated. A low that forms above $57,803 would preserve the sequence of higher lows that a new uptrend requires, while a return to the cycle low would indicate that the July to September advance was simply a bear market rally.
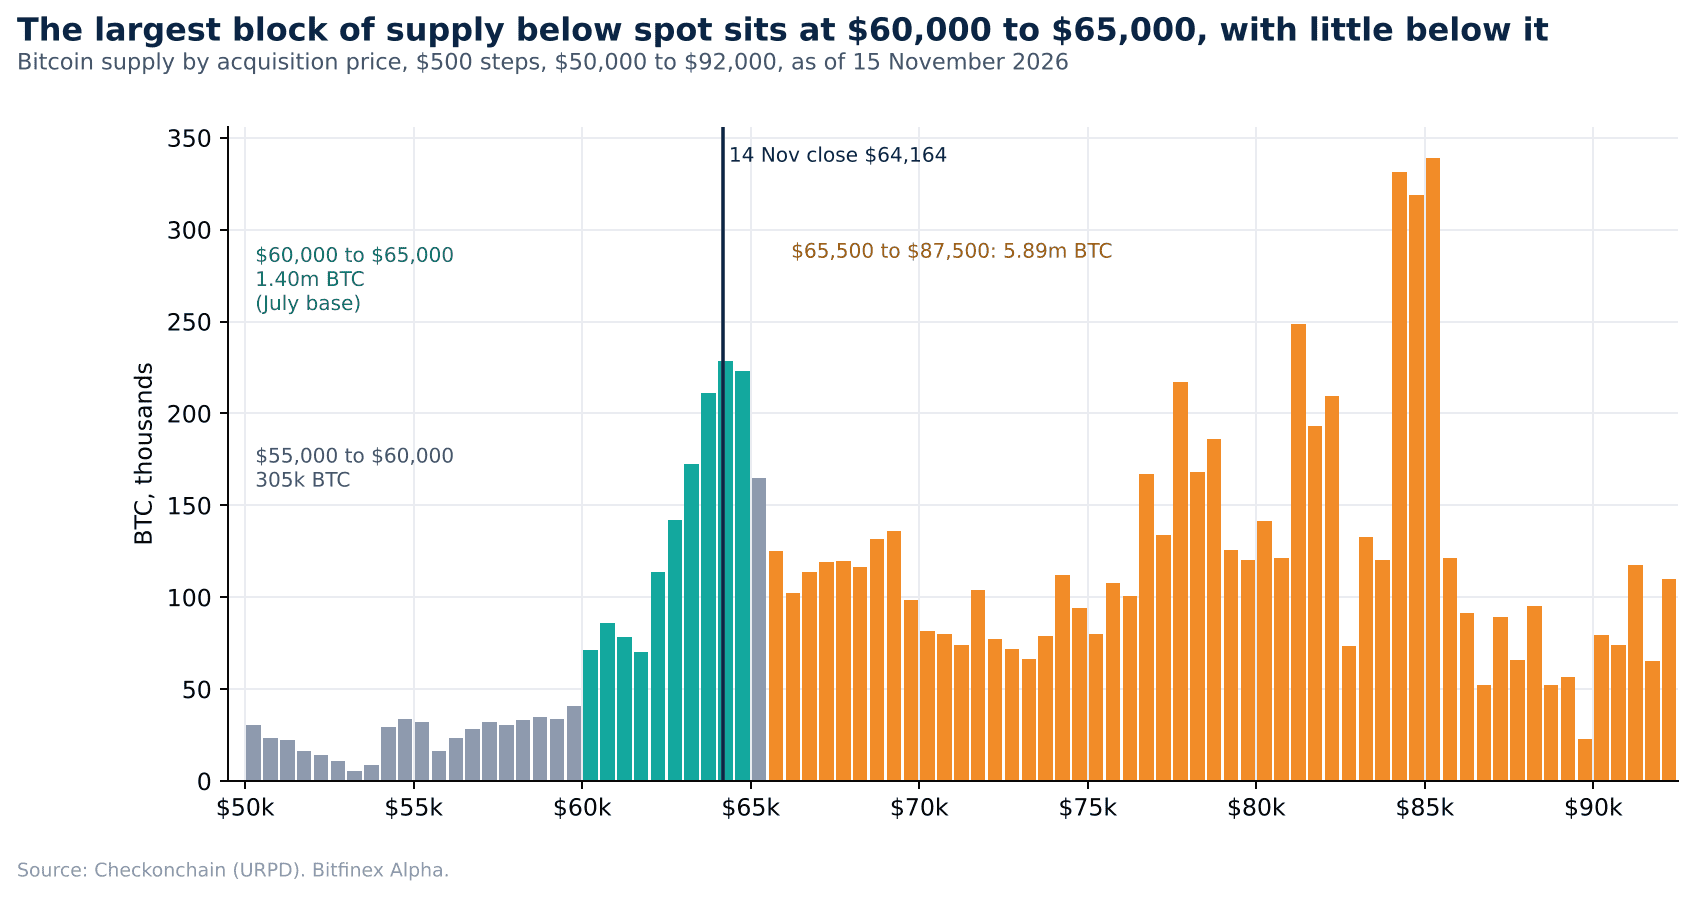
The supply data explains why the July base is so important. Coins acquired there form the largest block of supply, with about 1.40 million BTC carrying a cost basis between $60,000 and $65,000. Only about 305,000 BTC were acquired between $55,000 and $60,000, so there is little historical buying interest between the base and the cycle low. We would therefore expect a break of the base to result in a fast move towards the lower end of that band.
The length and depth of the current decline suggest that this is no longer a routine pullback. None of the pullbacks between July and early October exceeded nine percent in absolute terms, whereas the current decline has retraced 85.7 percent of the advance from $57,803 to $87,392. Historical precedent indicates that even when downside momentum of this kind ends, the repair tends to take weeks and even if we form a bottom above the July base we expect price to continue consolidating into the end of the year.
The levels that supported the market in October are now resistance. The short-term holder cost basis (STH-CB), the average price paid for coins that last moved within 155 days, stands at $74,712, and the True Market Mean (TMM), the average cost of actively traded supply, at $77,112. These have now become resistance levels for price on any recovery bounces and could potentially be the new range highs.
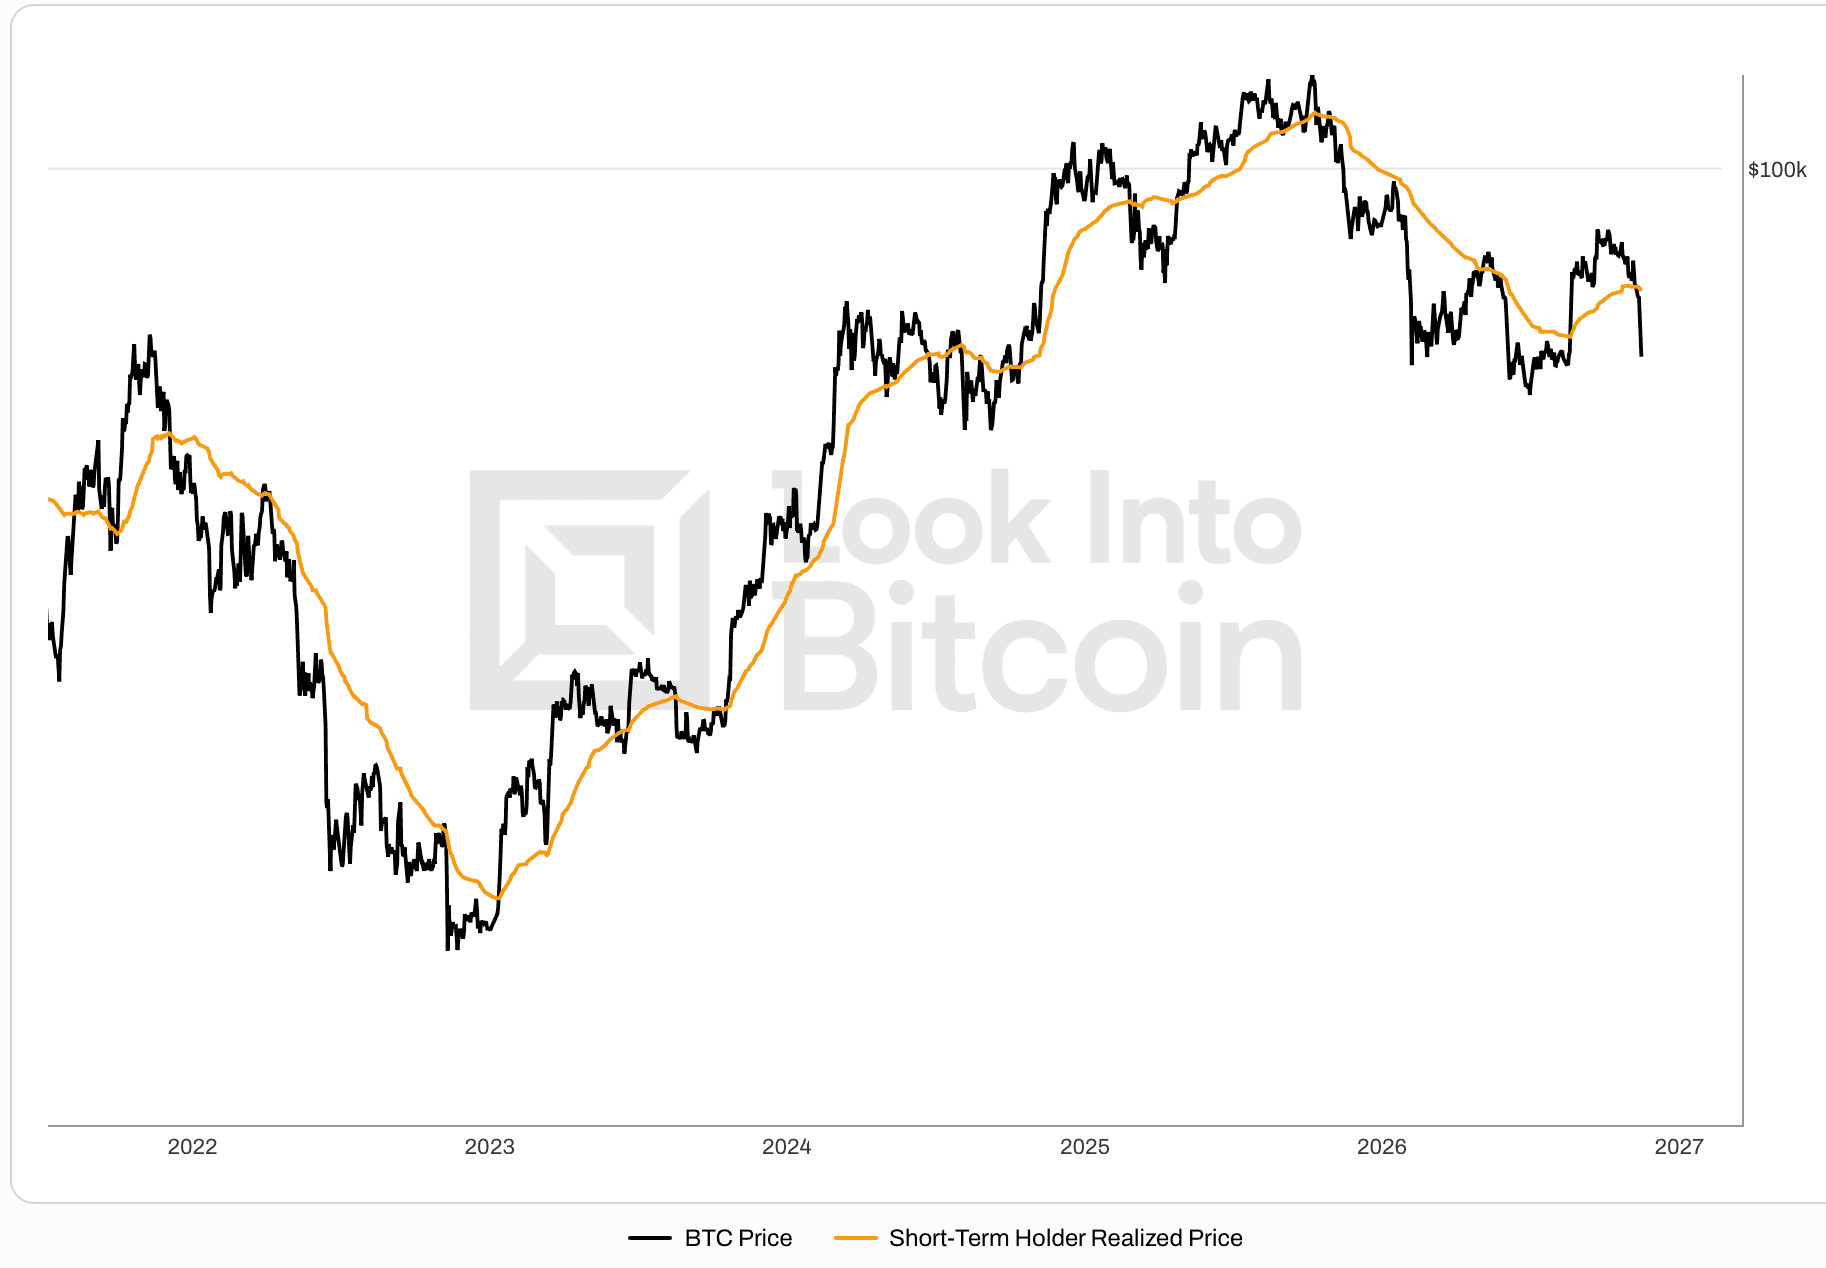
The 15 November weekly close was 12.5 percent below the STH-CB and 15.2 percent below the TMM. Last Wednesday’s Intelligence Update found that in 11 of the 14 earlier losses of the STH-CB since 2016, price reclaimed the level within two weeks, while in the three remaining cases price continued to decline for 90 days, reaching a low 17 to 35 percent below the STH-CB.
We will hit two weeks of trading below the STBH-CB on 22 November. A reclaim by then would require a price increase of about 14 percent from the 15 November weekly close. It is therefore likely that this current downturn joins the slower group in terms of recovery, with the 15 November low already 17.2 percent below the STH-CB. All that said, three cases are too few to develop a reliable forecasting model, but they are consistent with the view that the July base remains the key pivot level for bitcoin during this decline.

Positioning: Leverage and ETF Selling Yet to Clear
A peculiar feature of the current price decline is that there has been no single major news-based catalyst. We believe the July base is likely to hold only once three groups have finished selling: futures traders, short-term holders and BTC Exchange Traded Fund (ETF) investors. Currently, we see futures traders cutting leverage, recent buyers selling at a loss and ETFs facing substantial net outflows. We expect the 15 November low of $62,029 to be retested before that process is complete, and we set out below what would indicate that it is ending.
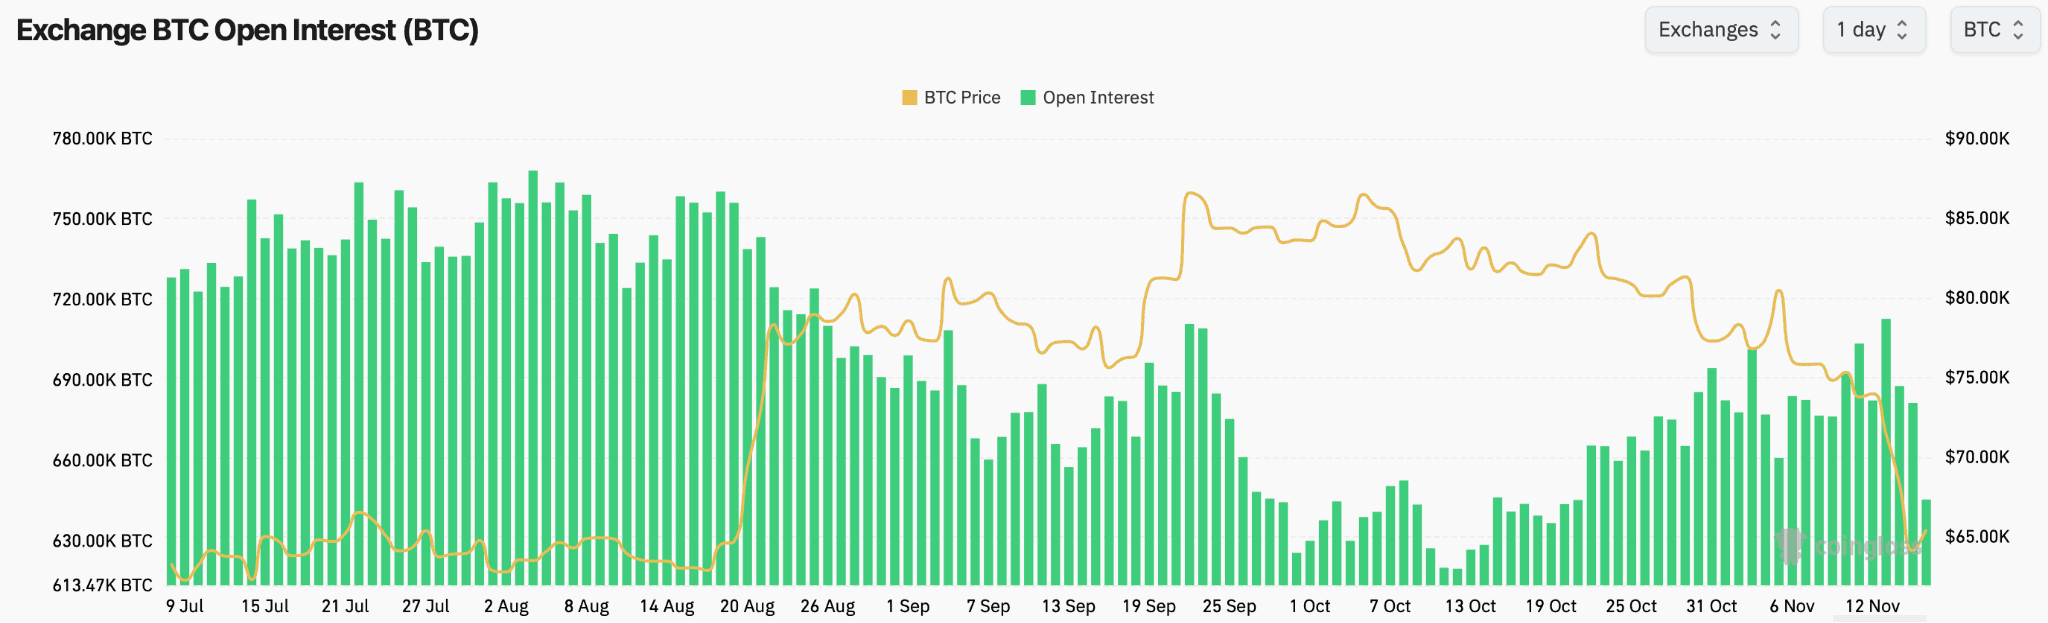
Until the weekend, open interest (OI) held near 700,000 BTC for most of the current decline, indicating that liquidated positions were quickly replaced by new ones. That changed on 14 and 15 November, when OI fell to 645,750 BTC, eight percent below its 11 November level, as $2.01 billion of positions were liquidated across all crypto markets in 24 hours, 83 percent of them long.
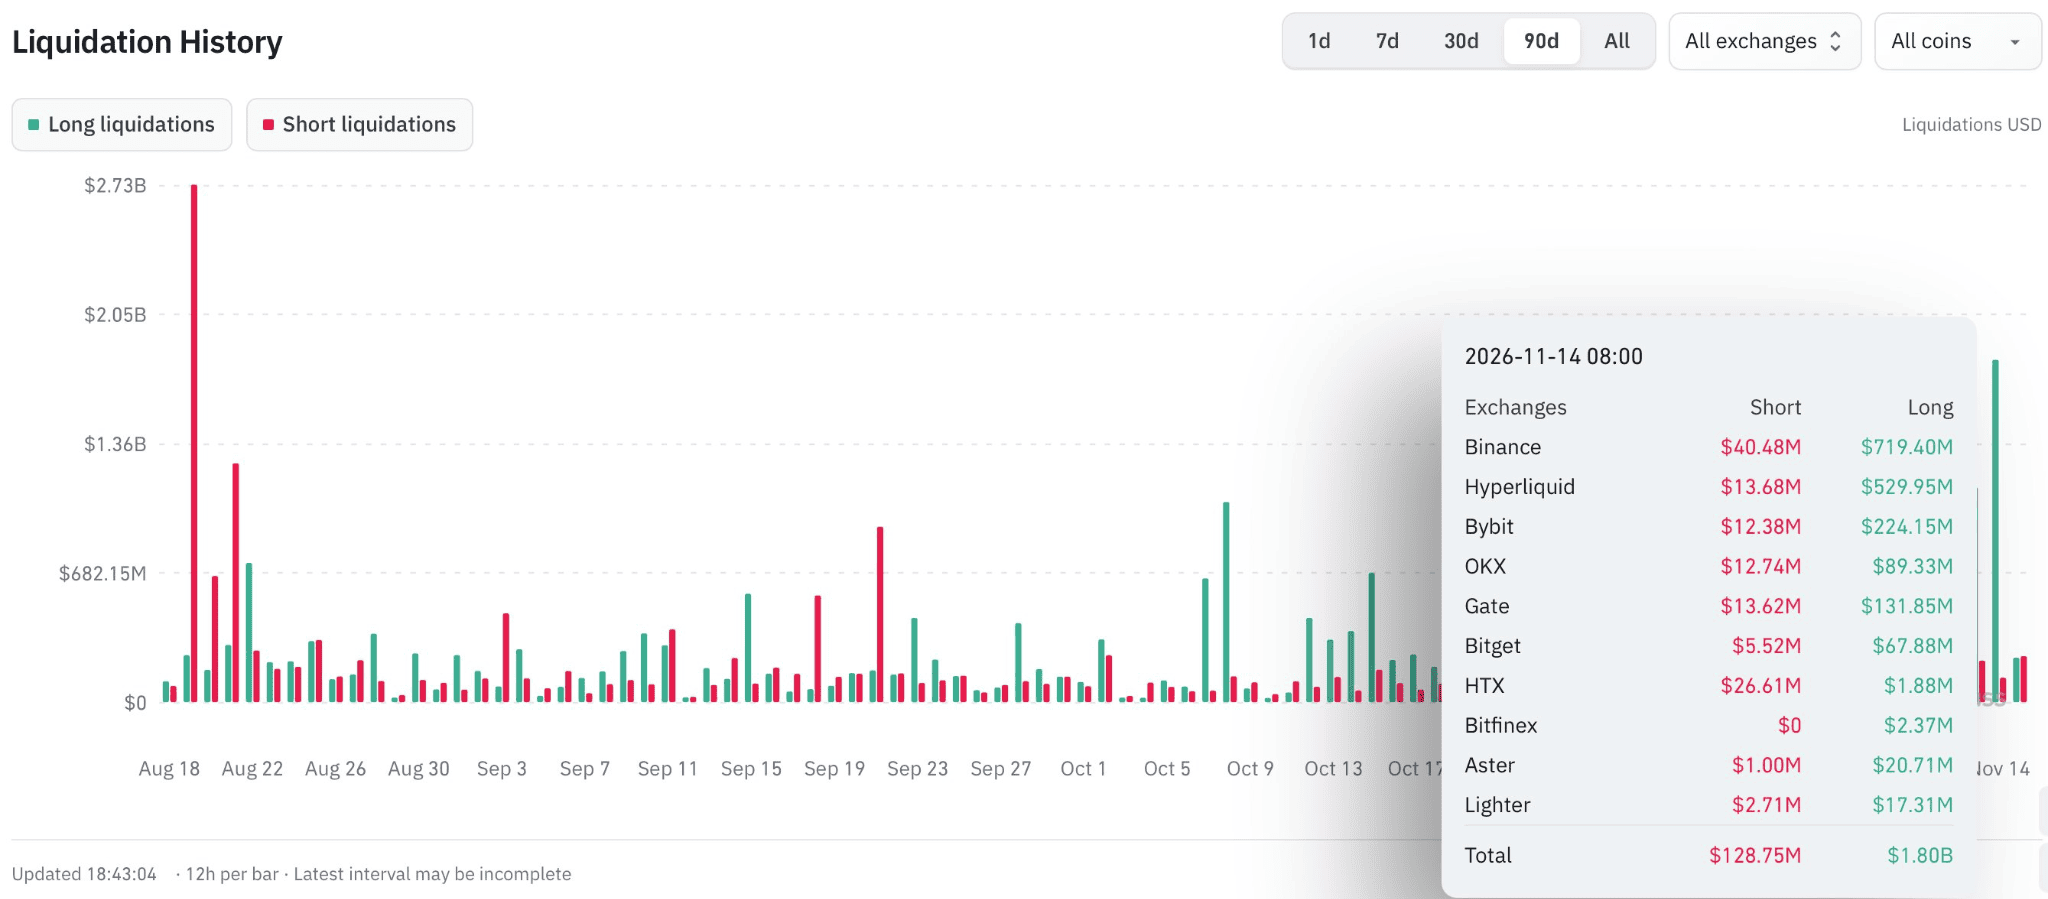
The current rebound from the low does not yet point to new buying. Lower-timeframe order flow at the time of the low on 15 November suggests that the move was driven by short sellers closing out positions, with OI falling as price recovered. We therefore regard it as a mechanical bounce.
A complete reset would show OI continuing to fall while funding rates head into negative territory. Funding has fallen from about 11 percent annualised (aggregate) on 10 November to between slightly negative and five percent across multiple venues, so the market has moved closer to reset levels, but has not reached them.
This decline in funding also points to a growing share of short positions, and it is notable that in the 12 hours after the 15 November low was reached, short liquidations of $228 million exceeded long liquidations of $122 million.
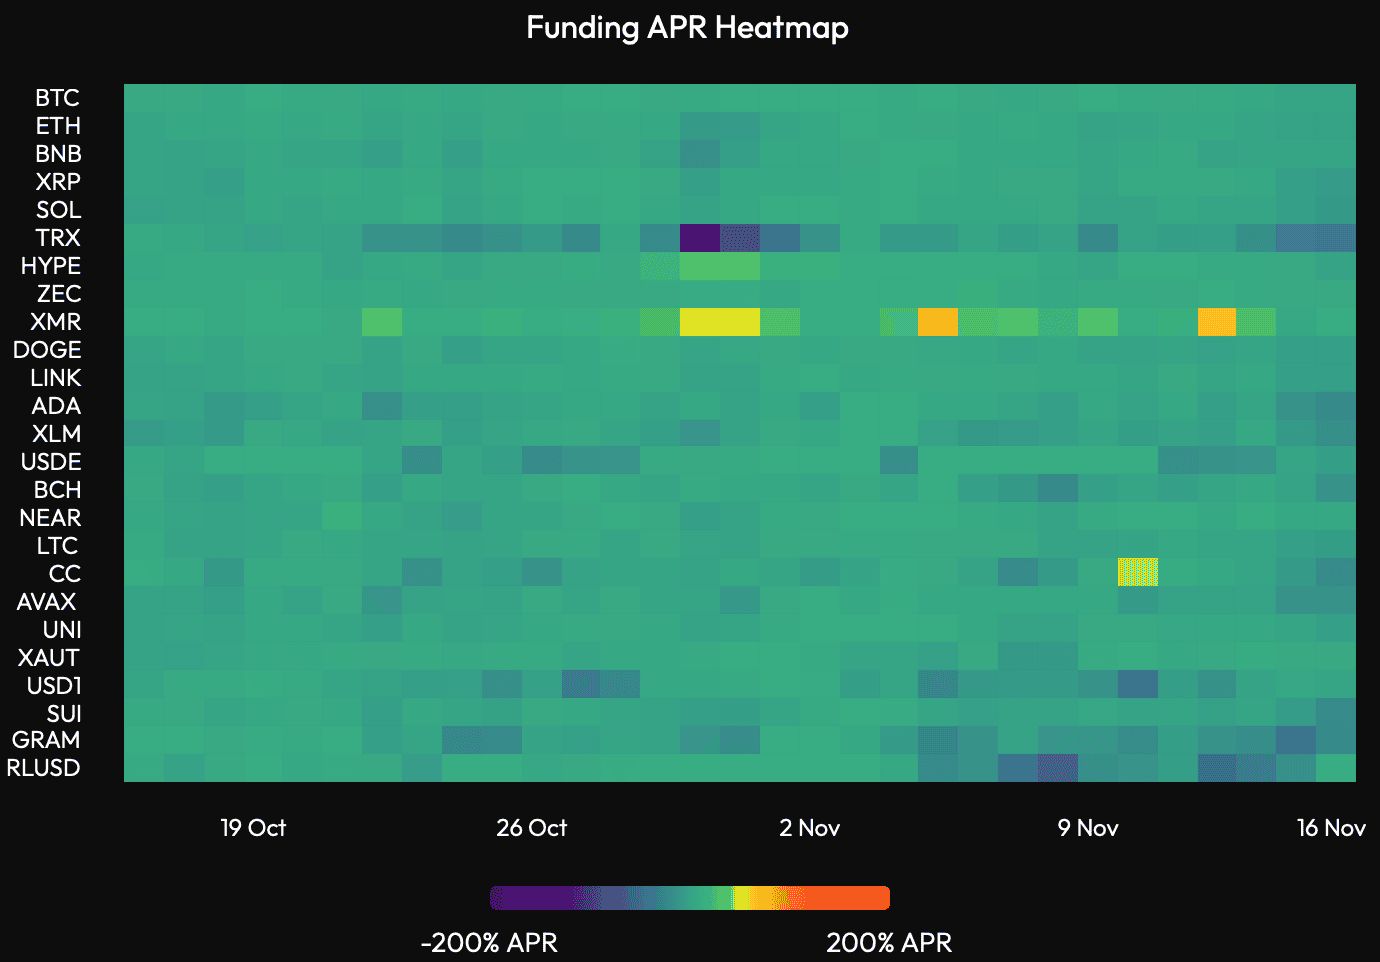
The rebound from the low therefore appears to have been driven by short covering. A complete reset of leverage has historically involved OI falling in BTC terms with funding at or below zero across venues.
On the other hand, CME open interest rose from 98,820 BTC on 11 November to 102,100 BTC by the November 13 close. This indicates that the aggregate drop in OI we have observed has come from offshore venues, while institutional accounts have not yet cut exposure, though CME OI is close to historical lows already.
Spot holder losses are as deep as at the July low.
The short-term holder Spent Output Profit Ratio (STH-SOPR), which compares the price at which coins younger than 155 days are sold with the price at which they were bought, reveals that selling is still taking place at a loss. STH-SOPR fell to 0.971 on 15 November, its lowest since 5 June, and remained below 0.98 until the weekly close (any reading below 1 indicates selling at a loss). In June and July these levels were only reached on days of heaviest loss-taking.
Net realised losses across all holders reached about 76,500 BTC on 15 November, the largest since 1 July, a significant increase from about 18,700 BTC on 10 November.
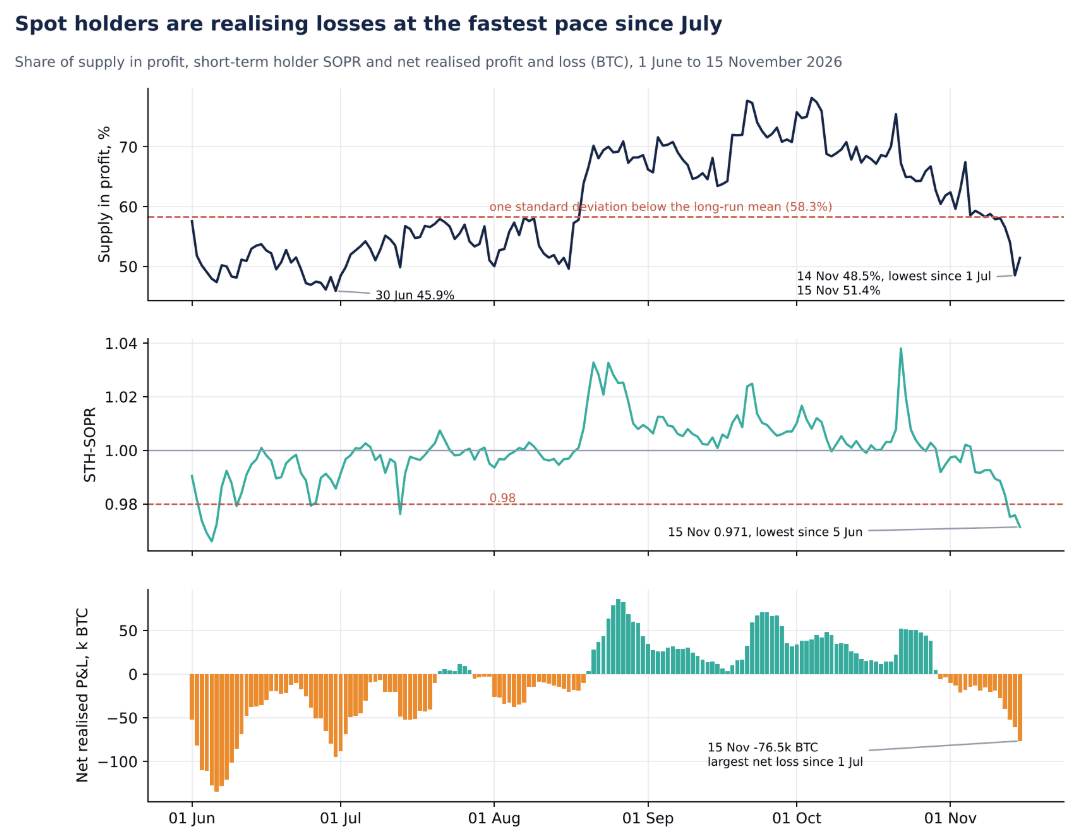
Unrealised losses tell the same story. The share of all bitcoin held in profit fell to 48.5 percent on 14 November, the same reading as on 1 July, before recovering to 51.4 percent on 15 November as price rebounded into the weekly close. Holders are therefore under as much pressure as they were at that low, with price about 11 percent higher.
Stress of this kind has been necessary for a durable low to form, but the timing is not exact. In June, STH-SOPR fell to these levels four weeks before the low eventually arrived. The signal to watch is a recovery in STH-SOPR towards 1, which would indicate that loss-driven selling is fading.
ETFs remain net sellers.
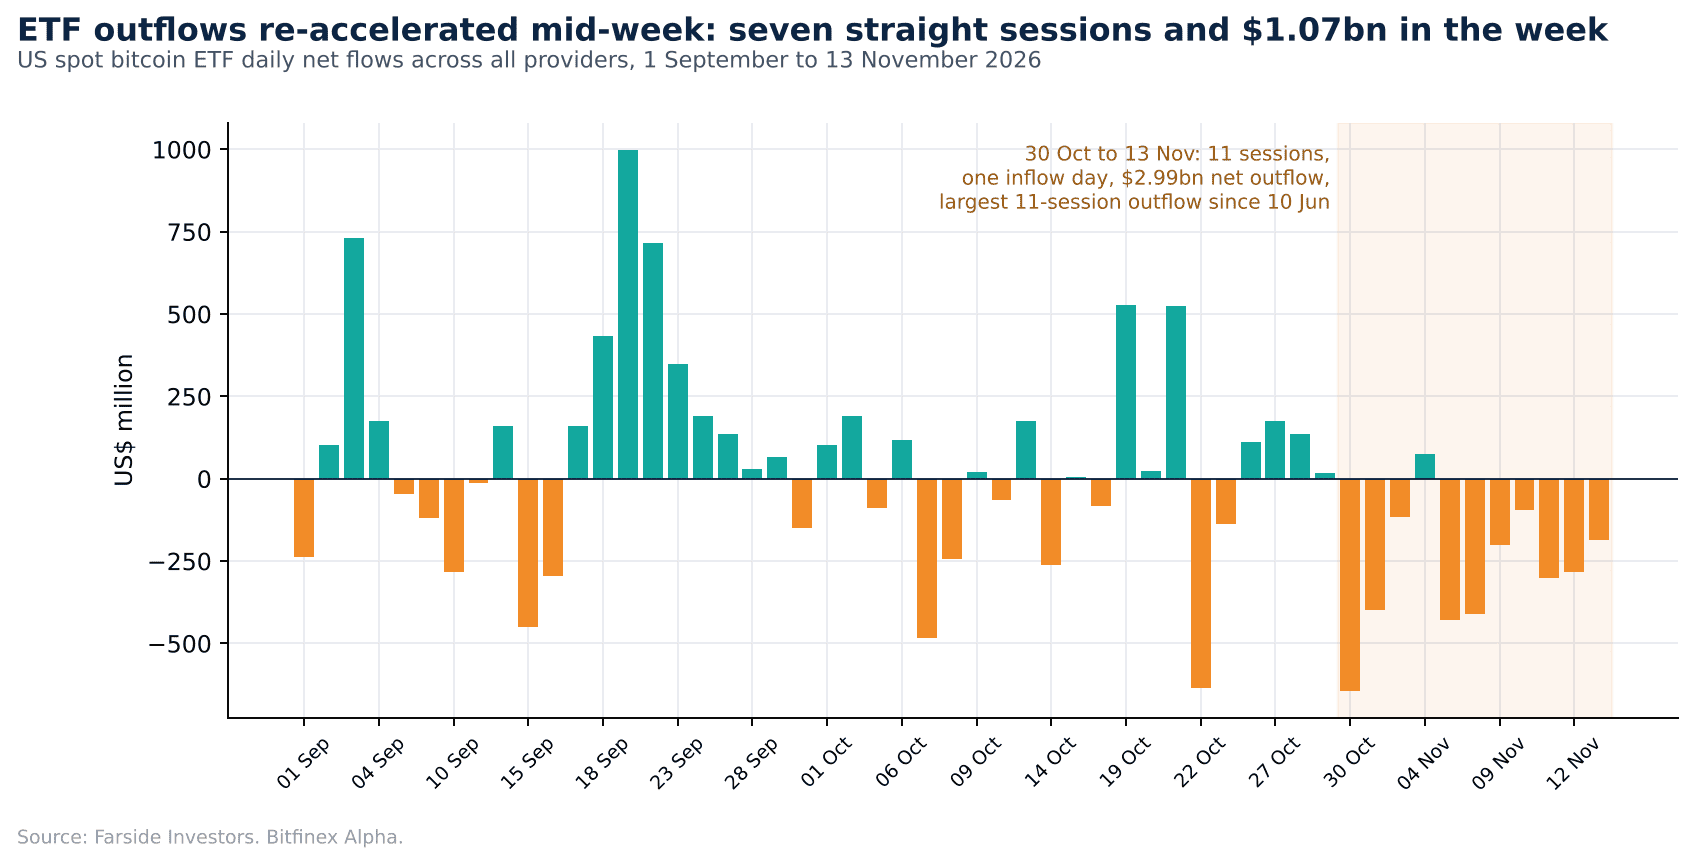
US spot bitcoin ETFs recorded net outflows of $1.07 billion last week. Two points stand out:
It was the second-largest weekly outflow since 22 June, following the previous week’s $1.28 billion.
The seven-session run of outflows is the longest since 1 July. Across the 11 sessions since 30 October, there has been only one inflow day and a net outflow of $2.99 billion, the largest over that span since 10 June.
How the ETFs respond this week (from 16 November) will help establish whether institutional demand is returning as bitcoin tests the July base. As we set out in the 4 November Intelligence Update, we would want to see three consecutive sessions of inflows, of a size comparable to the outflows, before concluding that demand has recovered.
BTC corporate treasury companies offer little support
The second main engine of BTC spot demand, corporate treasuries, is also not offsetting the current price decline. Strategy’s average cost of $75,456, as reported on 9 November, left its holdings about 13 percent underwater at the 15 November weekly close, and its shares fell 13.4 percent last week following reports that it would be excluded from the MSCI index.
Options are pricing the coming week as the period of greatest risk.
Implied volatility (IV), an annualised measure of expected price volatility, currently stands at 46.8 percent for options expiring on 20 November, against 40.2 percent for those expiring on 25 December. Shorter-dated options are normally cheaper of the two, suggesting traders are paying a premium for protection over the coming week, likely reflecting Nvidia’s earnings, the Federal Reserve minutes and the expected Anthropic listing.
That pricing implies a range for BTC between $61,800 and $69,400 into the 20 November expiry. The largest positions in put options, which pay out when price falls, sit at $63,000 for the 27 November expiry and $60,000 for 25 December, placing most of the hedging inside the July base ($61,300 to $67,000) and just below it.
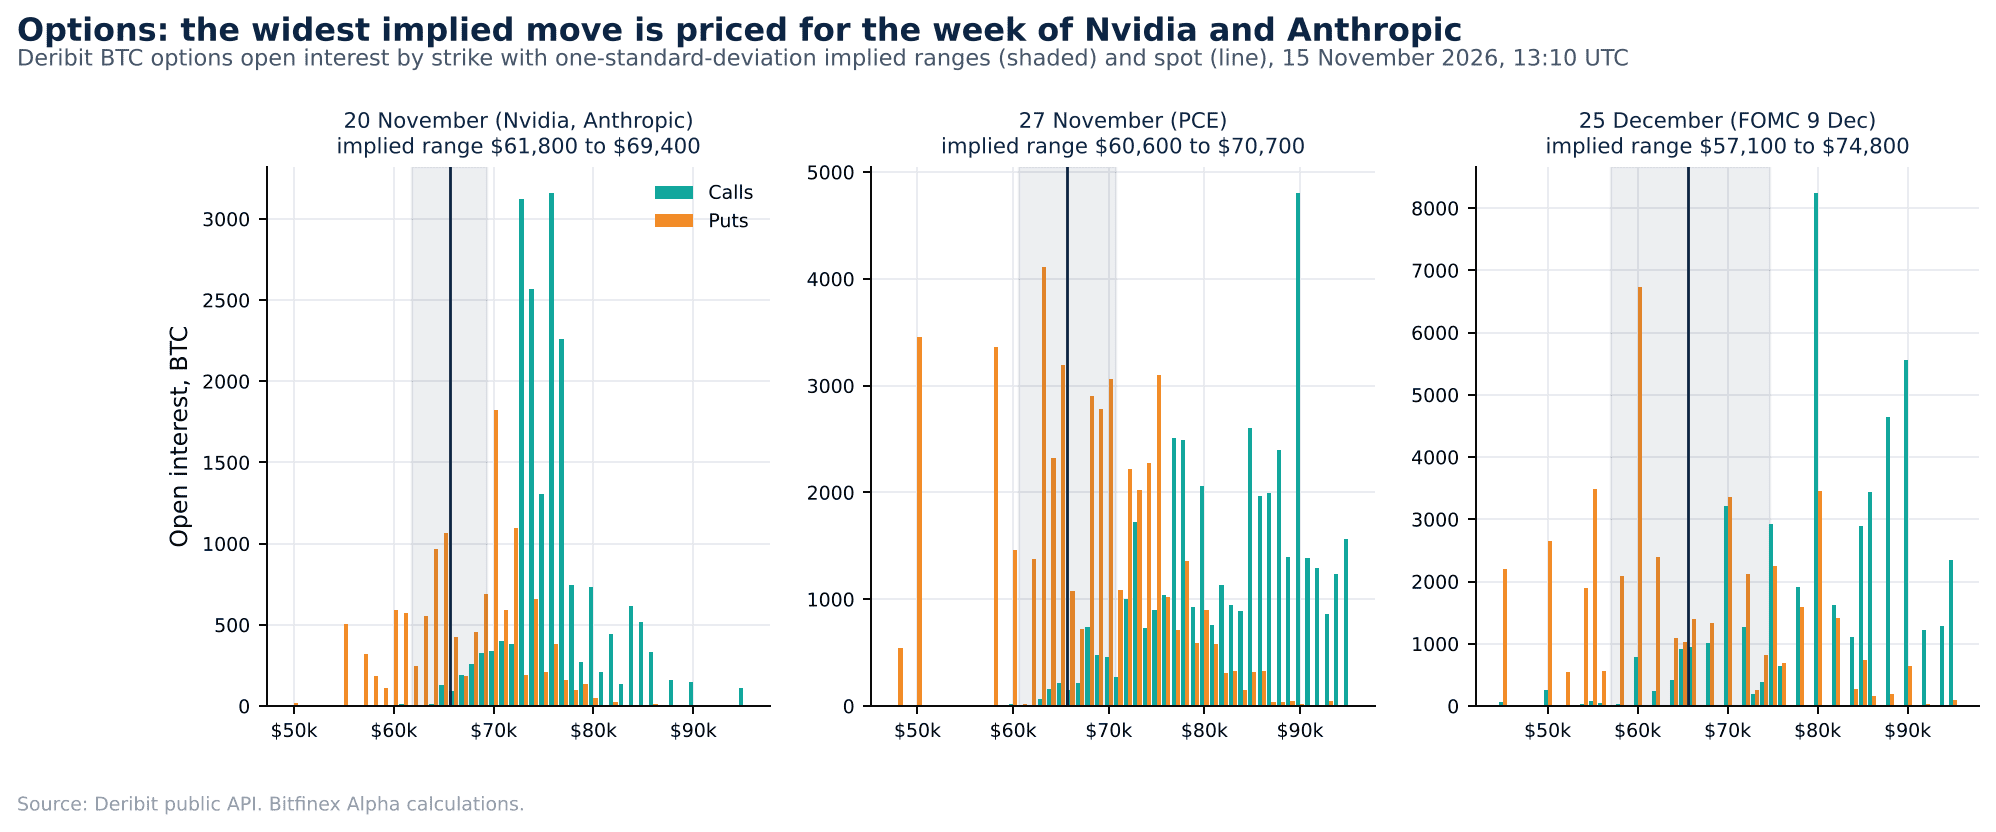
Demand is also concentrated in downside protection. For 20 November, puts about 8 percent below the market trade roughly 25 volatility points above calls the same distance above it, compared with about eight points for 25 December. This suggests options traders share the view that the July base is the level that matters.

Catalysts and Risks
Core Inflation Holds at 0.3 Percent
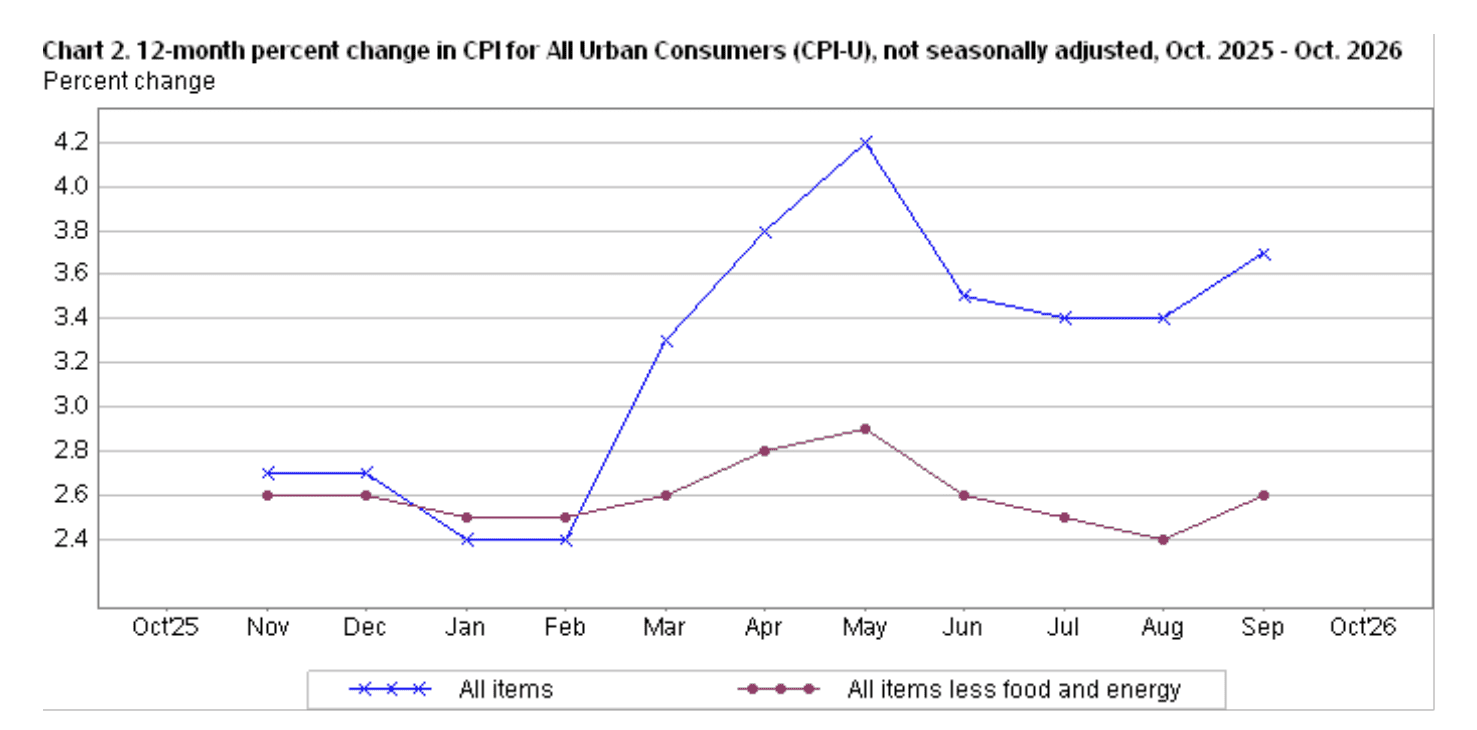
October inflation data suggest the Fed is set to raise rates in December, leaving only the size of the move as the open question. Core CPI, which excludes food and energy, rose 0.3 percent for a third straight month, the level Federal Reserve Governor, Christopher Waller, had named as grounds for considering a half-point move. Futures now treat a 25 basis point hike as highly likely, with about a 9 percent chance of the larger step.
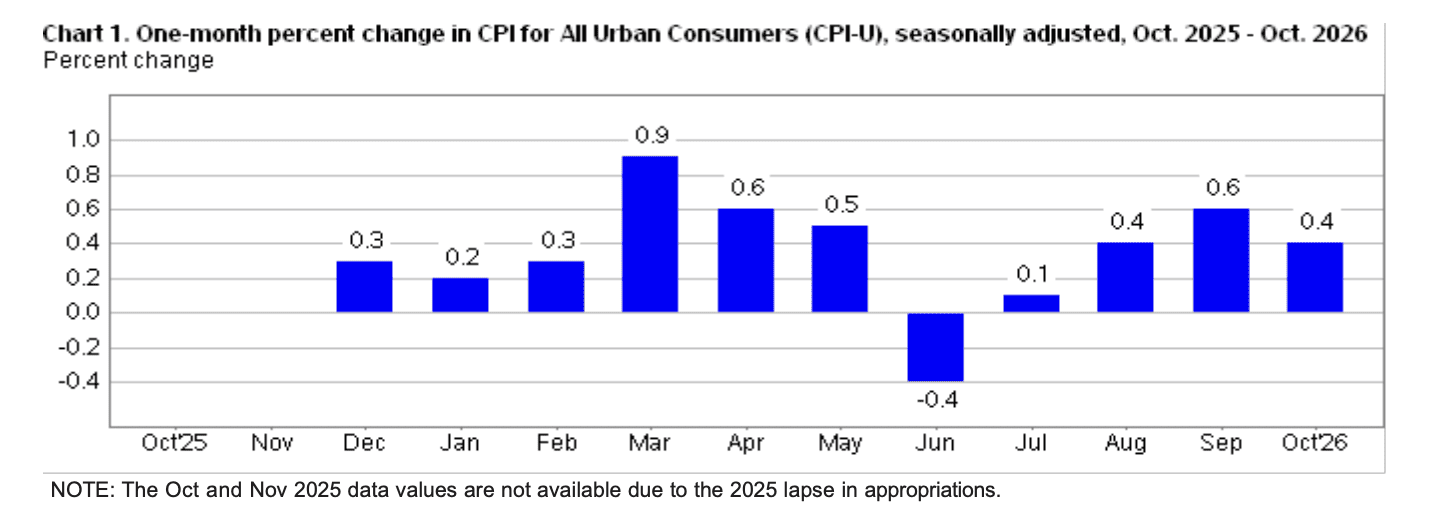
Headline CPI slowed to 0.4 percent from 0.6 percent in September, but both the headline and core readings beat forecasts of 0.3 and 0.2 percent respectively. The Bureau of Labor Statistics published no annual rate for the headline or core index because October 2025 prices were not collected due to the federal government shutdown. That leaves the three-month run in core CPI (see Figure 10 above) as the cleanest reading, and it shows no clear progress on tackling consumer inflation.
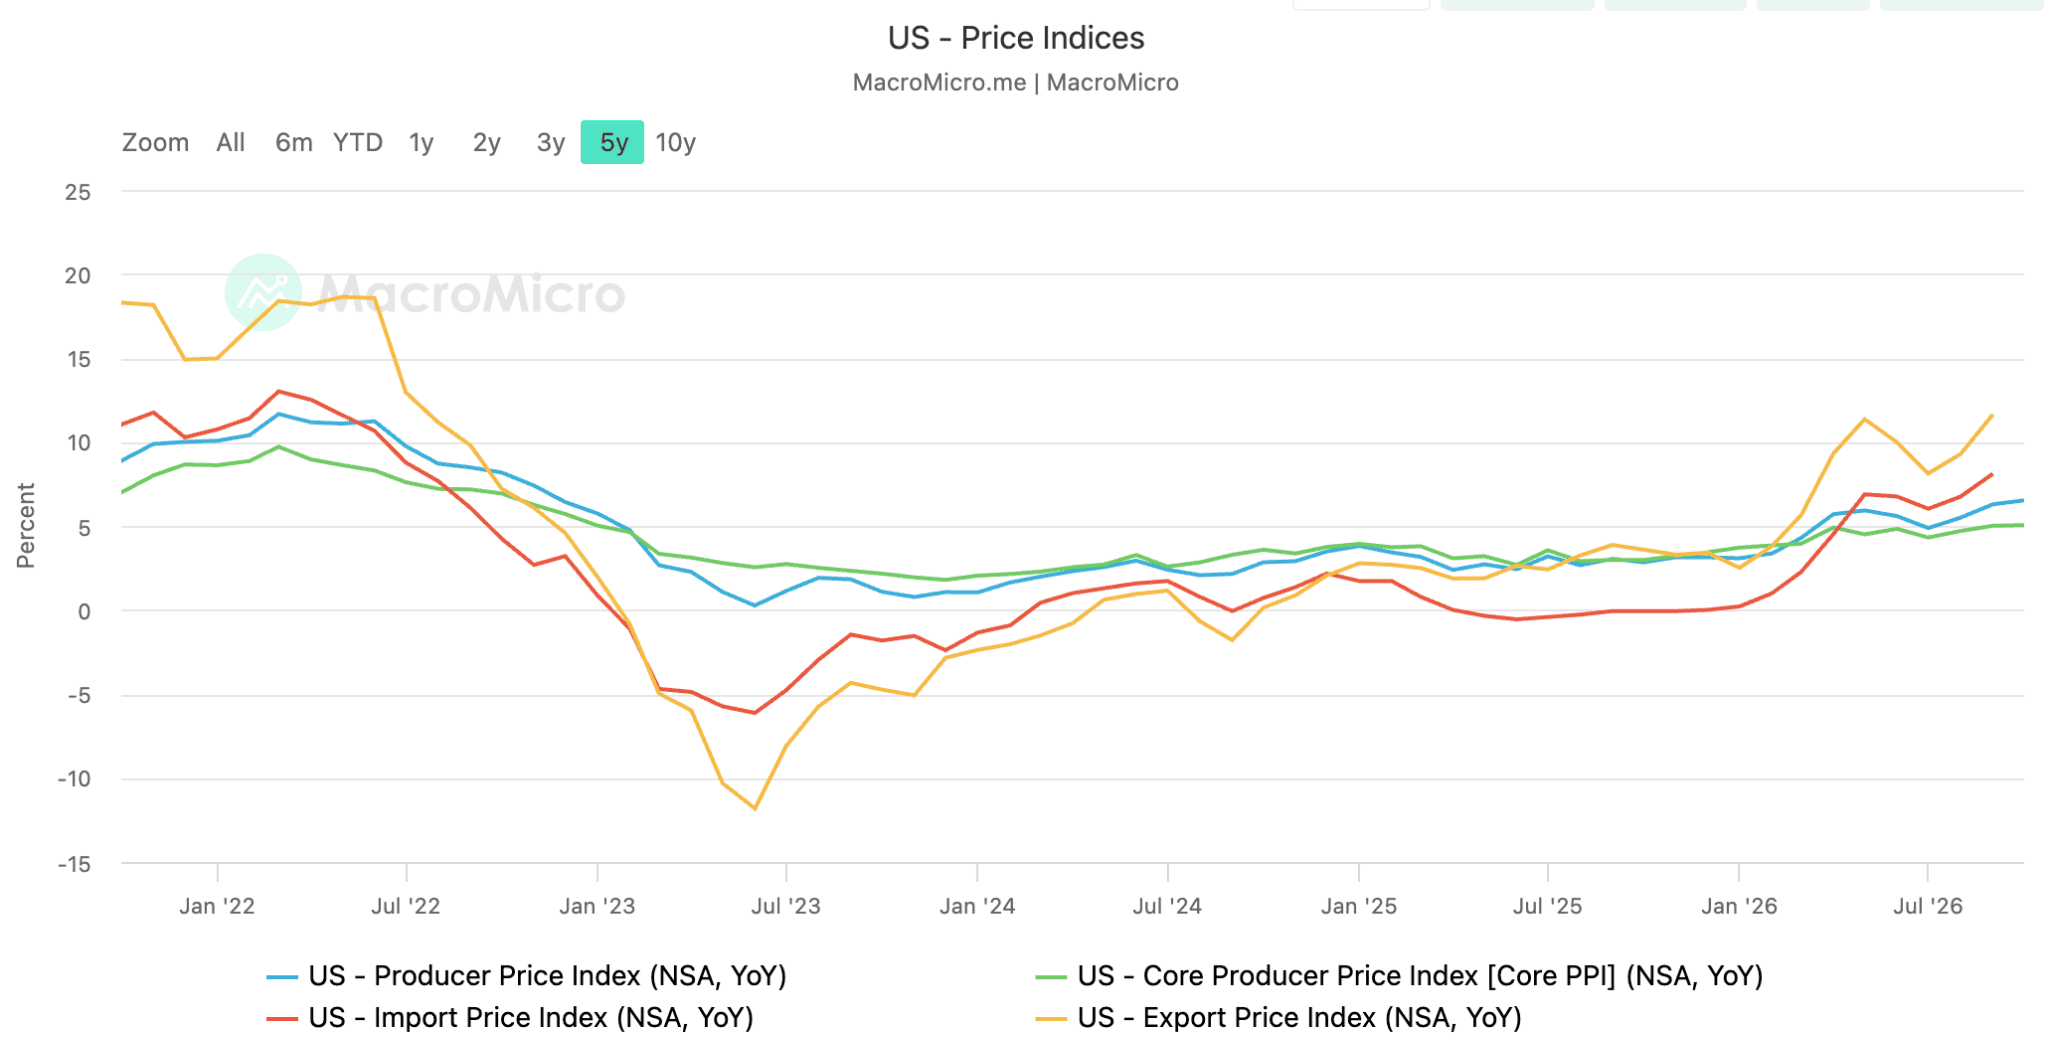
Producer prices help explain why cheaper fuel costs have yet to ease broader price pressures. The year-on-year rise in the Producer Price Index reached 6.5 percent in October, the largest since November 2022 (see Figure 11 above). Diesel prices fell 7.9 percent in the month, yet a two percent rise in transportation and warehousing charges accounted for three quarters of the increase in services prices. Freight rates adjust slowly, so lower fuel costs take time to reach the prices businesses charge.
Fed Governor Waller set the test on 10 November, hours before the CPI release. He leaned towards a quarter-point move in interest rates even if inflation improved, and said a half point “should be considered” if core CPI came in around 0.3 percent or higher. While Waller has opened the door to a larger move in interest rates, his view is not that of the committee. No other voter has signalled a half point rise and the Fed’s October decision to hold rates steady drew only two dissents, both in favour of a quarter-point hike.
The minutes of the October meeting, due on 18 November, are likely to show how close other officials were to moving. The October Personal Consumption Expenditures (PCE) price index, the Fed’s preferred inflation measure, follows on 25 November, and the Fed meets on 8-9 December, before the next CPI release. A half-point hike is not significantly priced into markets currently. Rising odds of a large move, however, would likely lift short-term yields and the dollar further. The case for it would weaken if monthly core PCE prints 0.2 percent or lower, and strengthen at 0.3 percent or higher.

Dollar at 19-Month High Pulls Bitcoin and Gold Lower
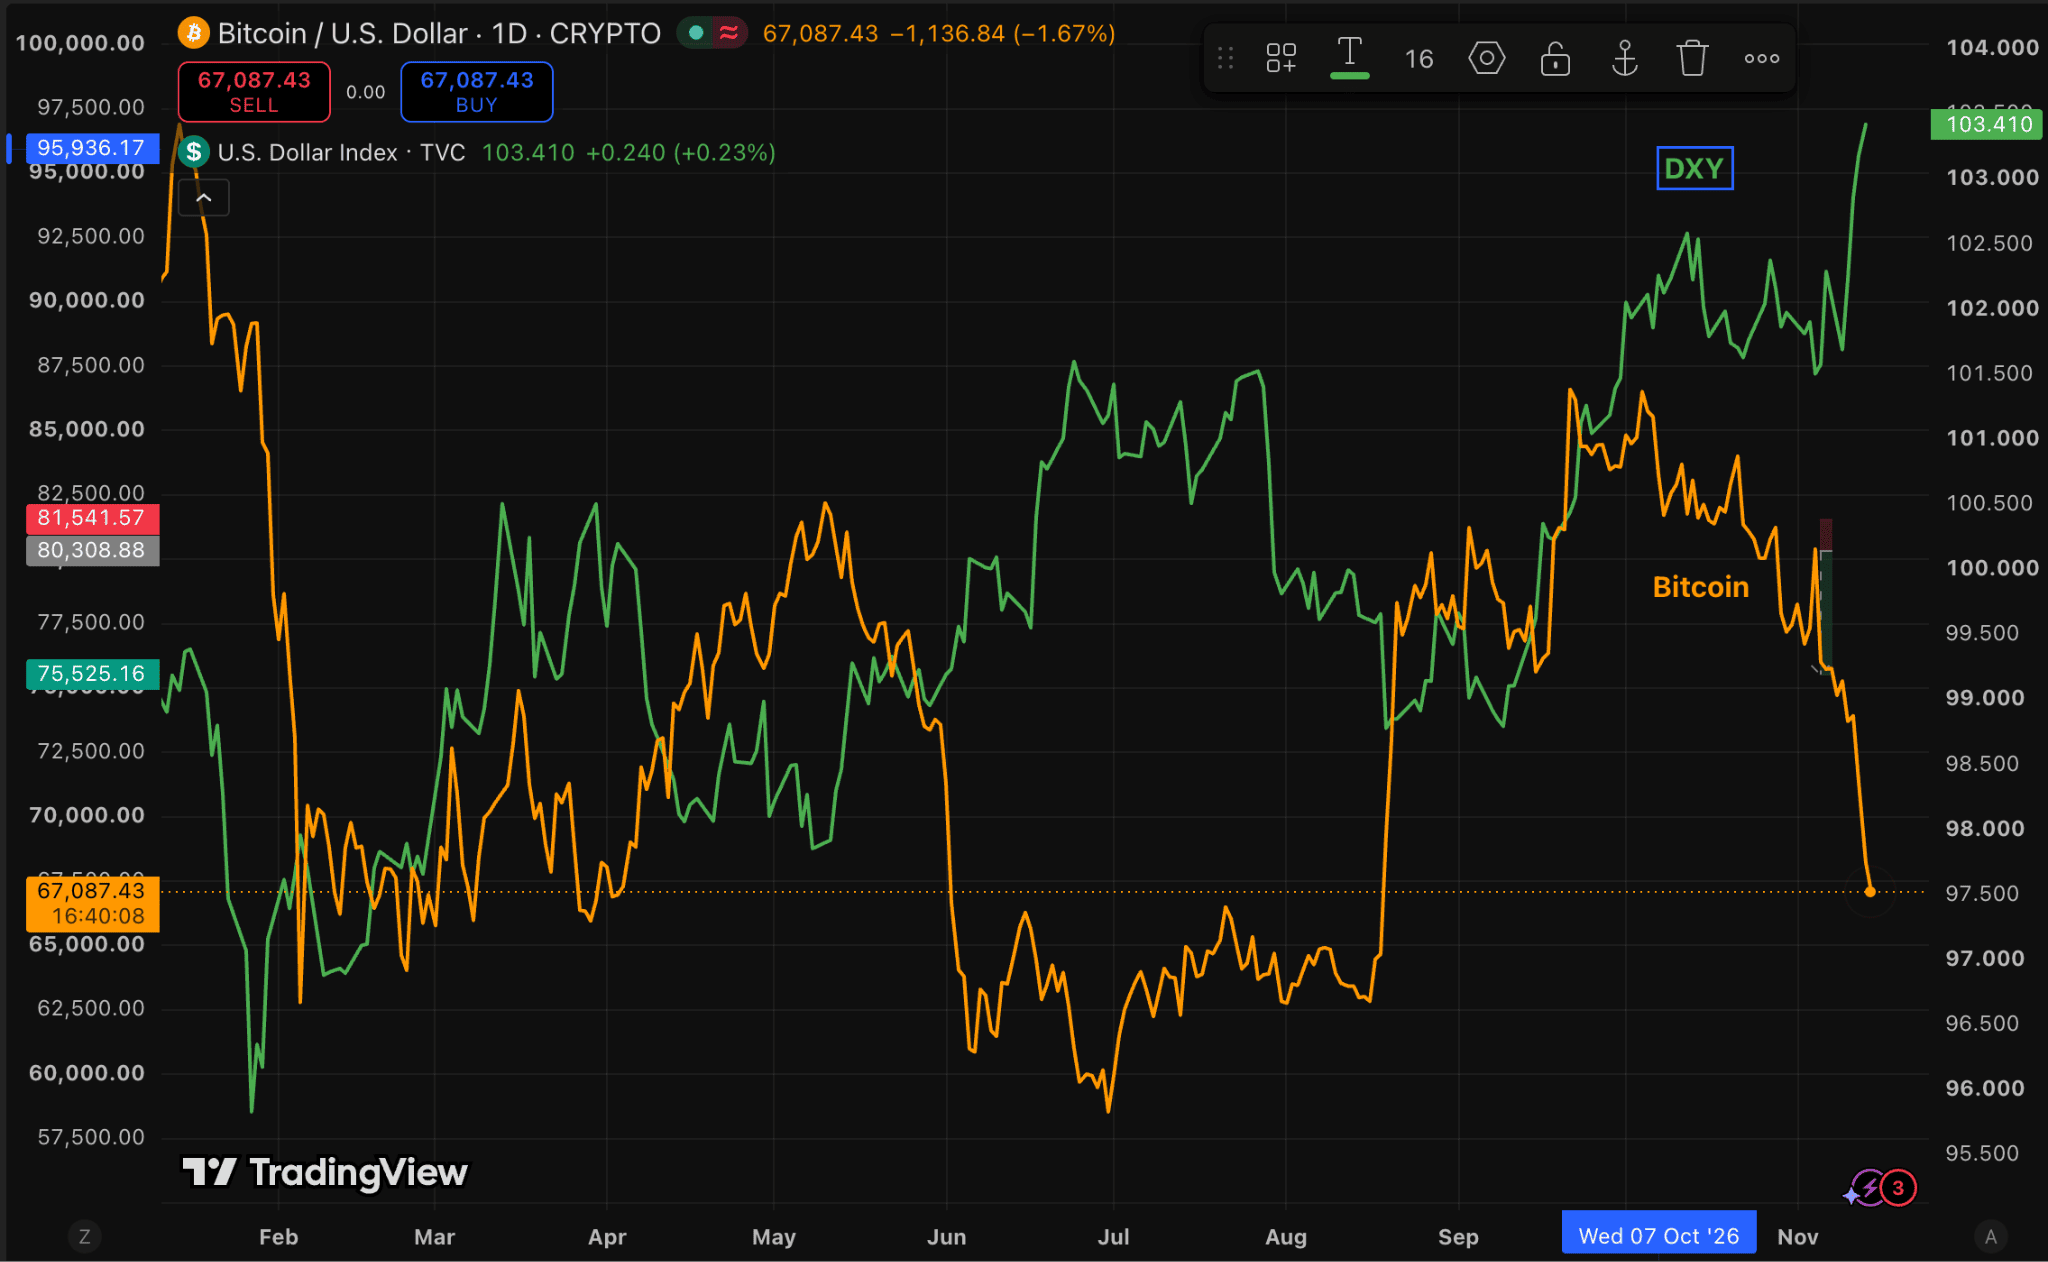
The US dollar has strengthened to a 19-month high, taking bitcoin and gold lower with it. The US Dollar Index closed at 103.4 on 16 November, its highest level since April 2025 (see Figure 14 below). Both assets are priced in dollars and pay no interest, making them sensitive to a stronger dollar and higher US rates. Gold’s 4.8 percent weekly loss, its worst since June, suggests that the pressure on bitcoin was not exclusively crypto-specific.
The dollar’s rise follows the inflation data. As a December hike became more firmly priced in, the two-year Treasury yield, which is highly sensitive to policy expectations, climbed from 4.51 percent on 6 November to 4.88 percent on 13 November. Higher short-term US rates widen the gap with rates elsewhere and draw money into dollars.
A stronger dollar weighs on bitcoin through both pricing and funding. Bitcoin is priced in dollars, so it becomes more expensive for buyers outside the US. Dollar funding also tightens for traders using borrowed money.
About $756 million of bitcoin futures positions were liquidated in the 12 hours to midday UTC on 13 November, with long positions accounting for 92 percent, according to CoinGlass (see Figure 13 below).
The dollar’s next tests are October retail sales on 17 November and the PCE price index on 25 November. Conditions for bitcoin are likely to worsen if the US Dollar Index extends above 103.4 after the PCE report.

Outlook for the Week
Base Case
Bitcoin enters the week inside the July base, with ETF outflows continuing and the US dollar at a 19-month high. We expect bitcoin to trade between $61,800 and $69,400, the range implied by options for the 20 November expiry, with risks skewed towards a retest of the 15 November low of $62,029. Dollar strength and expectations of higher interest rates are likely to keep pressure on bitcoin. Any advance would therefore need to be backed by spot demand.

What Would Confirm It
On positioning, ETF outflows continuing at $100 million to $300 million a day, with open interest still falling and funding near zero, would indicate that leverage is still clearing and that rebounds are driven by short covering. A recovery in STH-SOPR towards 1 would provide further evidence that loss-driven selling among recent holders is subsiding. On macro, the US Dollar Index holding above 103 and the two-year Treasury yield holding at or above 4.88 percent would indicate that rate-driven demand for dollars is persisting.
Fed minutes on 18 November that show wider support for a rate hike in October than the two dissents implied would reinforce the view that December’s decision is not a question of if rates will rise, but by how much. A half-point probability on CME FedWatch that rises above 8 percent would suggest further pressures on bitcoin.

What Would Invalidate It
To the upside, a reclaim of $72,700 with three consecutive sessions of ETF inflows and a real yield back below 2.8 percent would indicate that a higher low has formed and bring the short-term holder cost basis near $75,000 into view.
A US Dollar Index close back below 103, or a half-point probability below 5 percent on CME FedWatch, would suggest the dollar’s move was a reaction to one inflation report rather than a lasting shift. If bitcoin still failed to recover, it would suggest that spot demand, not macro, is the constraint.
To the downside, acceptance below $61,300, the lower edge of the July base, with ETF outflows above $300 million a day would point to a retest of the $57,803 cycle low. A move below that low would indicate that the advance from July was a bear market rally.

What to Watch
ETF flow figures for 16 to 18 November, with three consecutive inflow sessions as the threshold that would change the view.
The 10-year real yield against 2.8 percent and the US Dollar Index against 103, at each US market close.
Open interest, funding and STH-SOPR against 1, monitored daily.
October retail sales, Tuesday 17 November, 13:30 UTC.
Nvidia earnings, Tuesday 17 November, after the US market close.
Fed minutes for the 27-28 October meeting, Wednesday 18 November, 19:00 UTC.
CME FedWatch half-point probability relative to 11.5 percent.
The Anthropic listing on 19 November and the options expiry on 20 November.
