

Issue #228:
Bitcoin Tests Key Support as Fed Decision Looms
Bitcoin Resets as Hike Odds Shift
Bitcoin pulled back last week to a low of $79,250. This 9.3 percent correction marks the deepest pullback since the July cycle low, temporarily placing price below the previous range low of $81,300. Moving into the upcoming Federal Reserve policy decision on Wednesday 28 October, and key macroeconomic data releases this week, the broader uptrend remains anchored by major structural cost bases between $77,000 and $80,000.
Institutional flows saw temporary profit-taking after ETF inflows pushed prices toward the institutional cost basis near $84,374. While short-term holders realised profits during the rally, open interest has remained stable around 669,253 BTC. With roughly 65 percent of the circulating supply in profit, the market has seen a standard healthy reset within an ongoing macro bull regime rather than systemic market stress.
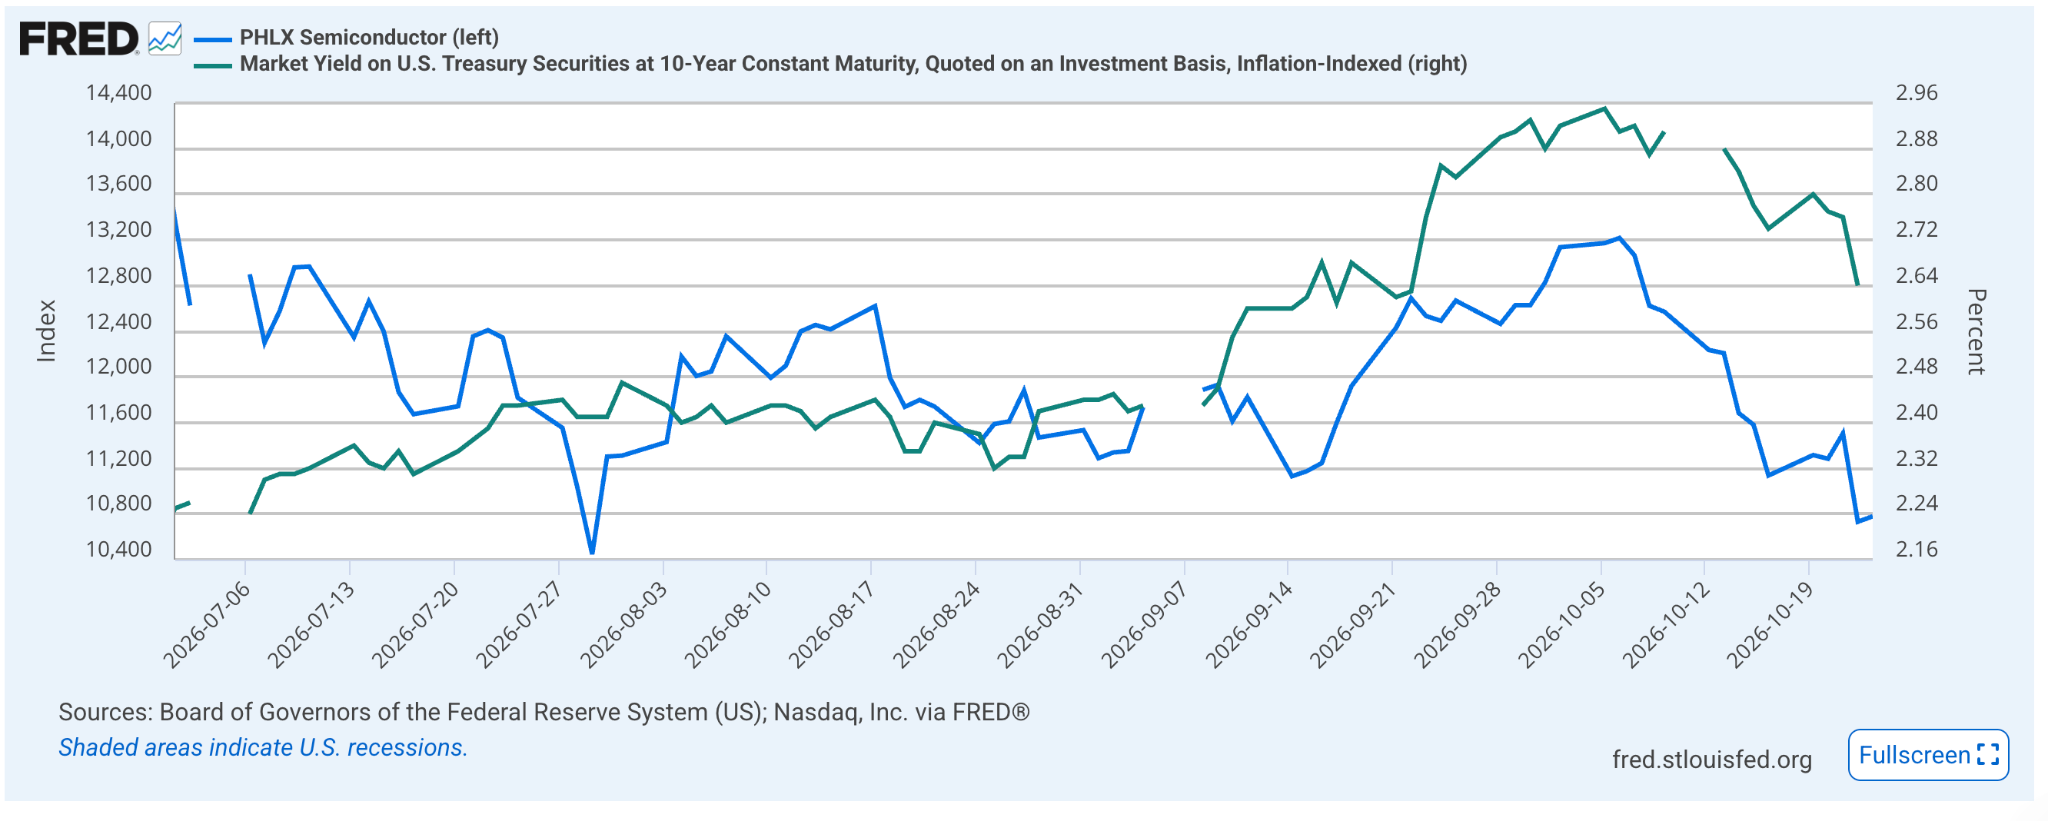
Macroeconomic factors continue to influence short-term price action. With the Federal Reserve expected to leave rates unchanged on 28 October, however, that hold is not the relief it appears. A month ago, the market put a 64.2 percent probability on a rate hike at this meeting. That probability has now fallen to 9.4 percent, while the likelihood of a December hike now stands at 72 percent. This suggests that expectations of a rate hike have shifted, rather than disappeared, while credit conditions have continued to tighten without any action from the Fed. Signs of pressure are particularly visible in AI financing, where the Philadelphia Semiconductor Index has fallen 17.9 percent in three weeks.
Given bitcoin’s strong correlation with major equity indices, upcoming earnings reports this week for Alphabet, Amazon, Microsoft and Intel will serve as critical sentiment drivers alongside monetary policy signals.
Looking ahead, key support lies between $77,000 and $77,765, aligned with the True Market Mean and ‘new whale’ cost basis. A decisive recovery above $82,500, where short liquidations are most heavily concentrated, backed by renewed ETF demand, would signal the completion of the current consolidation phase and open the path toward overhead targets.
The 10-year inflation-adjusted Treasury yield, the return BTC competes with, closed at 2.66 percent on 23 October, down from 2.91 percent on 9 October. Its steepest one-day fall of the month came on 22 October, the day semiconductor equity stocks dropped sharply.
Falling real yields offer little support for bitcoin when driven by declining risk appetite. That assessment would change if BTC rises while the ten-year real yield holds near 2.66 percent and semiconductor stocks stabilise.

Market Signals
Price Structure: $81,300 Has Flipped to Resistance
Bitcoin has flipped the high volume node at $81,300, a level that previously marked the lower boundary of its trading range and has now become resistance after a late sell-off last week.
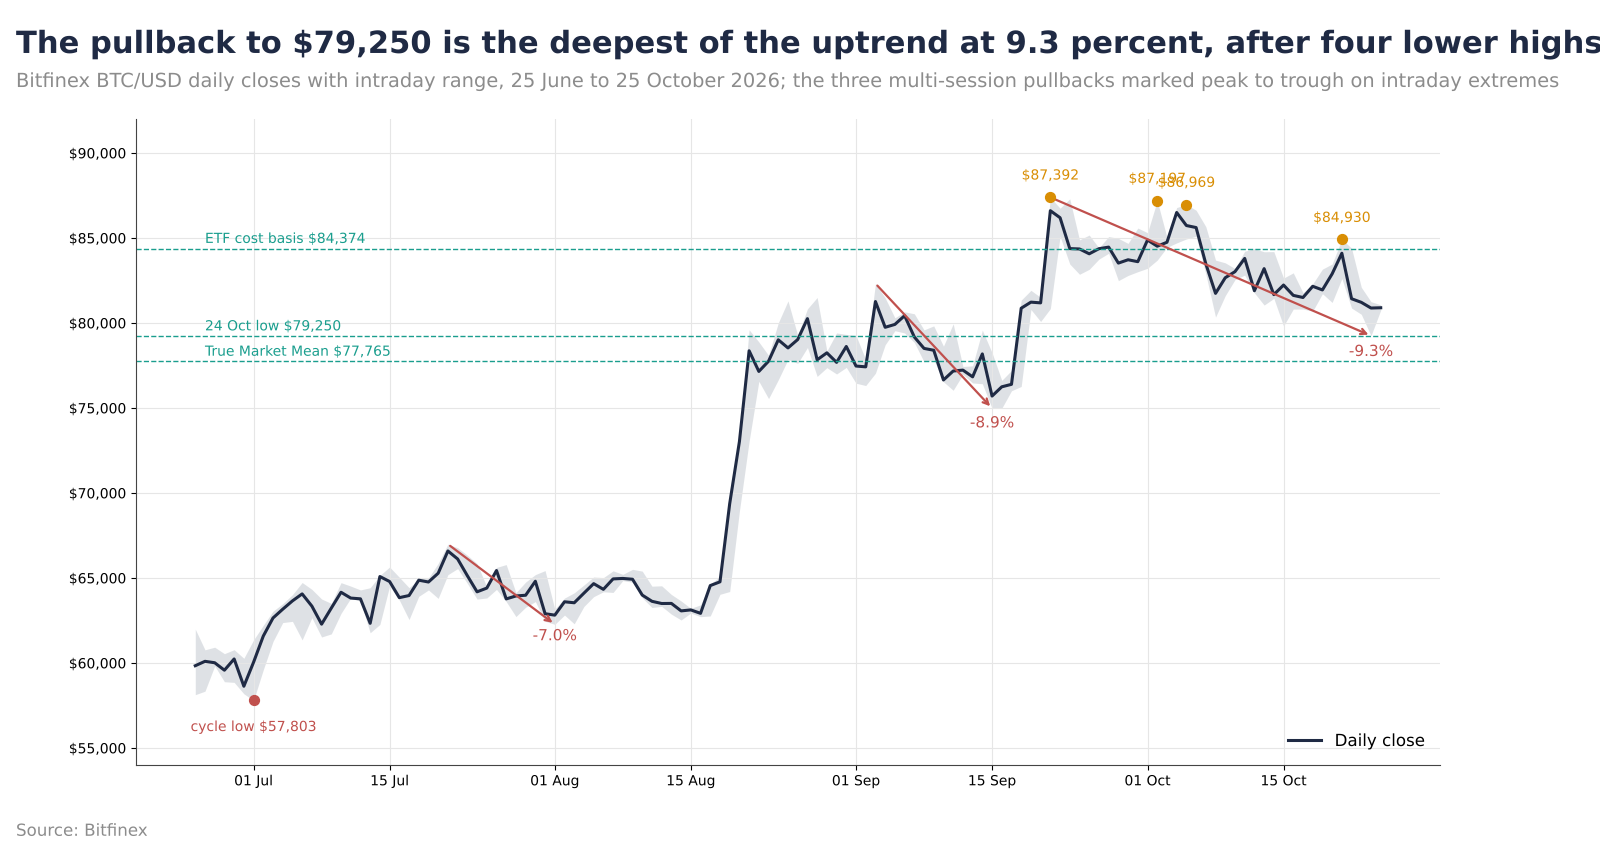
Bitcoin has already tested the upper end of the $77,000 to $80,000 support band, falling to $79,250 on 24 October. Further downside could bring the lower levels of this band into focus. This support band consists of multiple on-chain and flow-based cost-basis levels including the current True Market Mean at $77,765 and the ‘new whale’ cost basis at $77,000.
The range lows at $81,300, which had held for several weeks, have now flipped from support to resistance, as the first uptick in price after losing the level was sold into by BTC holders who had previously bought the dips beneath it. The 874,000 BTC now held between $81,000 and $82,500 is supply held by potential sellers on any recovery attempt. Following three consecutive ETF inflows at the start of last week, BTC rose to a high of $84,930, just above the $84,374 average cost basis of the US spot ETF cohort.
The rejection that came after, however, was immediate: on 22 October bitcoin fell 3.2 percent, and on 24 October the move extended to $79,250 under the former range lows.
The current pullback from the $87,392 high of 21 September has now extended to 9.3 percent, making it the deepest of the six corrections of five percent or more since the $57,803 cycle low on 1 July. The previous five pullbacks had ranged from 5.1 to 8.9 percent. While this puts us in new territory for the current cycle, BTC uptrends have historically weathered pullbacks of 14 to 15 percent — and even 30 percent — in previous cycles without breaking their bullish structure.
However, as the asset class matures and markets become deeper and more liquid, we would expect volatility to decline and pullbacks to become shallower.
The $81,300 level was the highest-volume node between the former range highs of $68,000 and the current local high. With consecutive closes below this level on 22, 23 and 24 October, bitcoin has now met the condition outlined in our 7 October Intelligence Update: sustained trading below $81,300 for multiple sessions would make the True Market Mean the next reference level.
Where do we go from here?
What comes next is defined by where supply sits below the current price. The 24 October low of $79,250 is the point at which long liquidations were exhausted. It also represents the first print inside the September accumulation band between $77,500 and $80,000, which holds 739,000 BTC as of 25 October.
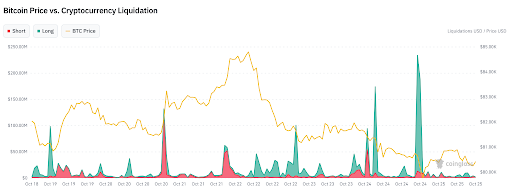
What matters at the next test of $79,250 will be how positioning evolves as the price approaches this level. If open interest (OI) falls, it will indicate that perpetual long positions are being forced out and the selling should exhaust itself. If OI rises, as it did between 22 and 25 October, it will indicate that new positions are being opened into the decline and the move is more likely to continue. We will look to cumulative volume delta data to determine whether the fresh positions are longs continuing into a declining market or shorts piling into a move down, with the associated risk of potential short squeezes on rebounds.
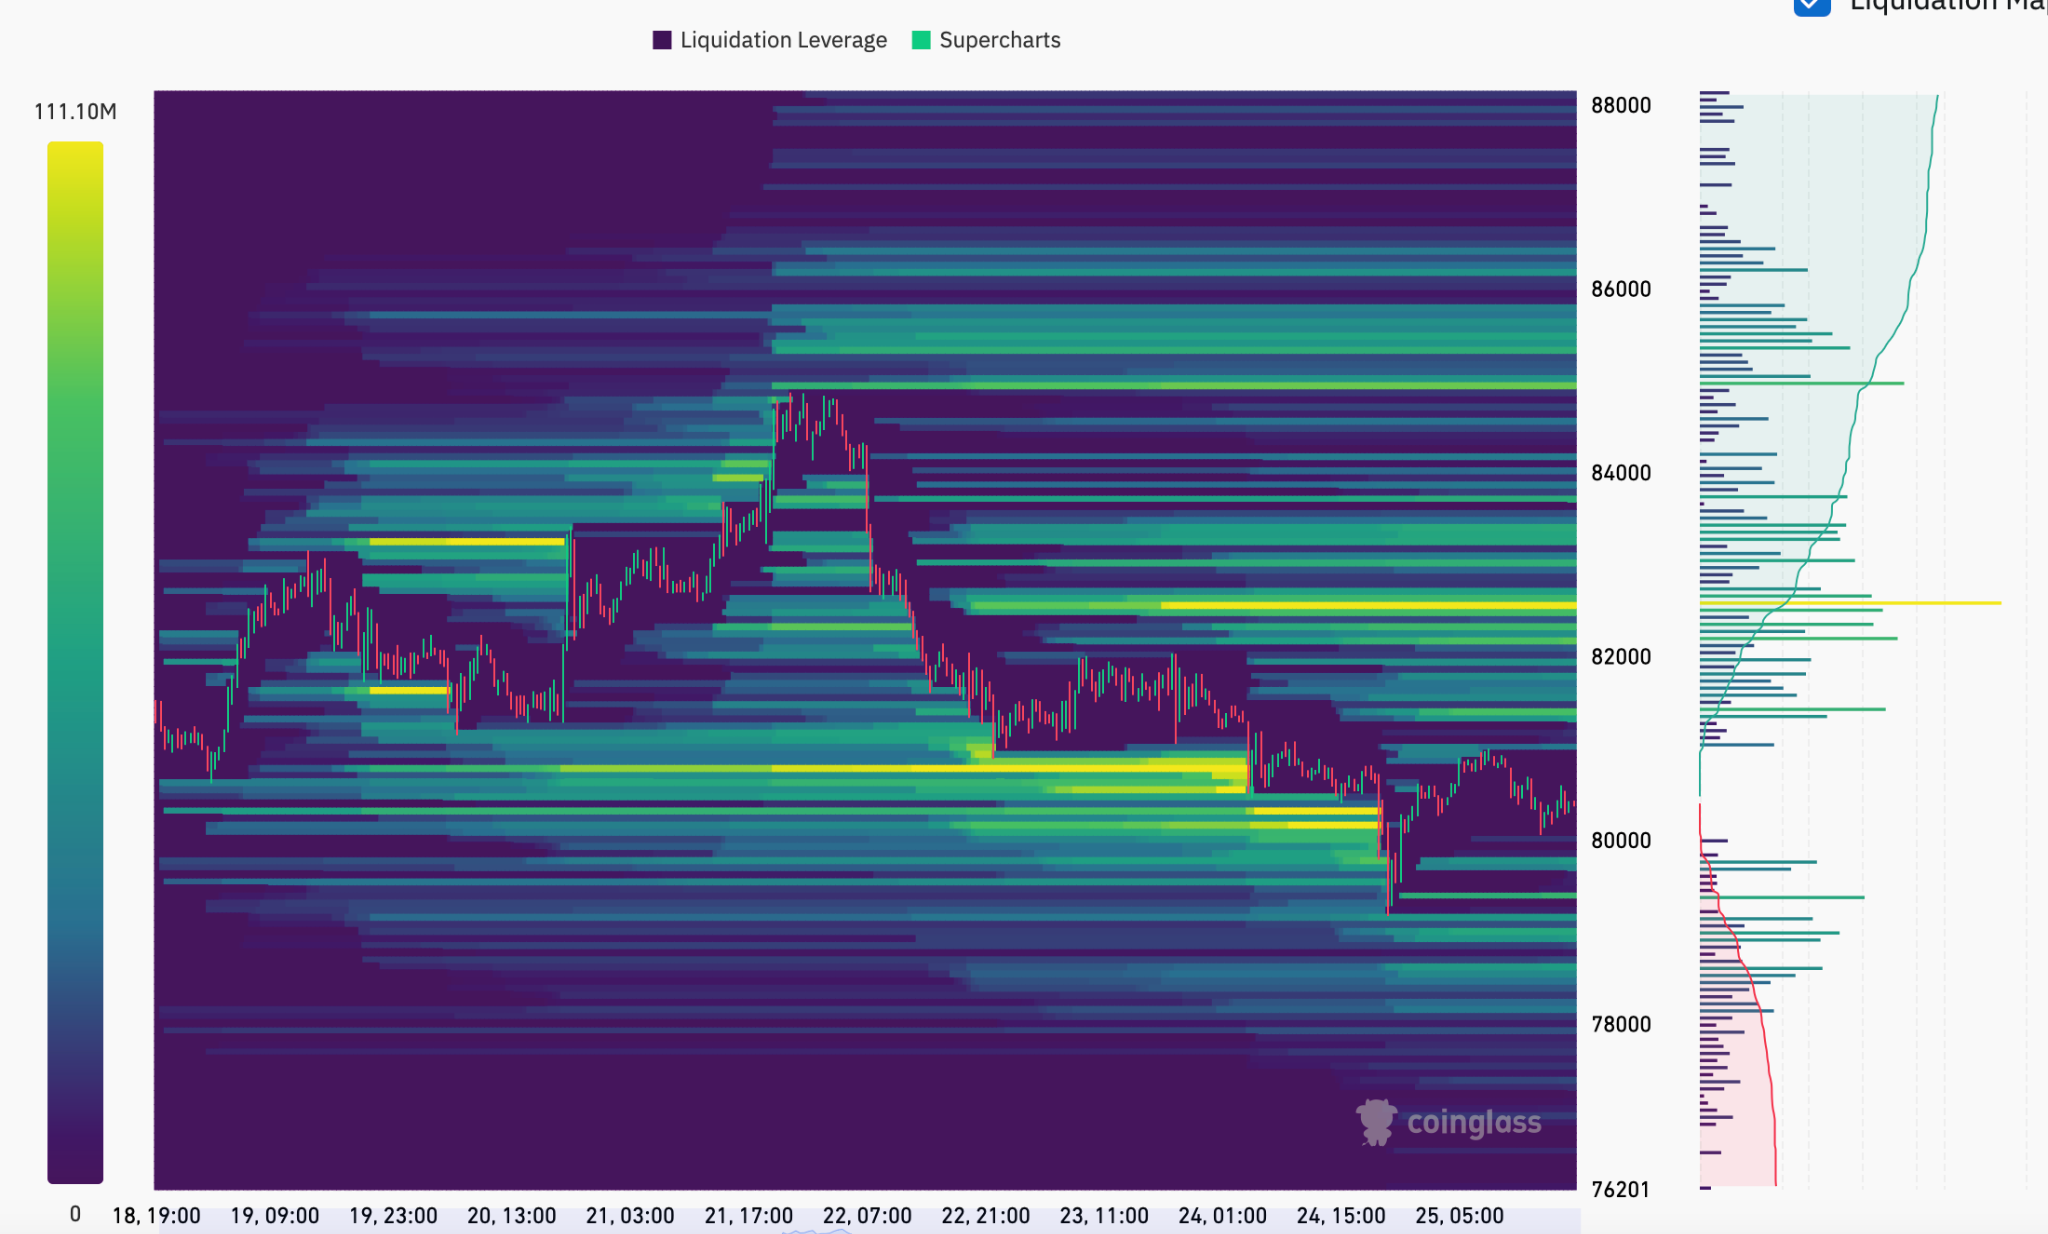
Liquidation levels have thickened around the $82,300 to $83,000 price level as bitcoin broke beneath $81,300. This suggests some fresh short positions are being opened in the BTC perpetual futures market as prices decline, with tighter liquidation levels and stop losses. As we discuss later, this is despite long positions continuing to dominate overall positioning.
This opens the door to a potential rebound if aggressive spot buying occurs during the first few trading sessions this week.
Beneath the current market price sits the True Market Mean at $77,765 — the average cost basis of active investors. BTC has not closed below this level since 18 September. A sustained break below this level would be the first of the current uptrend, exposing the $76,000 to $76,700 range lows and the $75,696 short-term holder cost basis.

Positioning: Open Interest Remains Sticky Despite Short-Term Holder Profit Taking
Short-term holders took profit on 22 October when price had a bearish retest of the lower-timeframe range highs, before going on to break below the range lows.
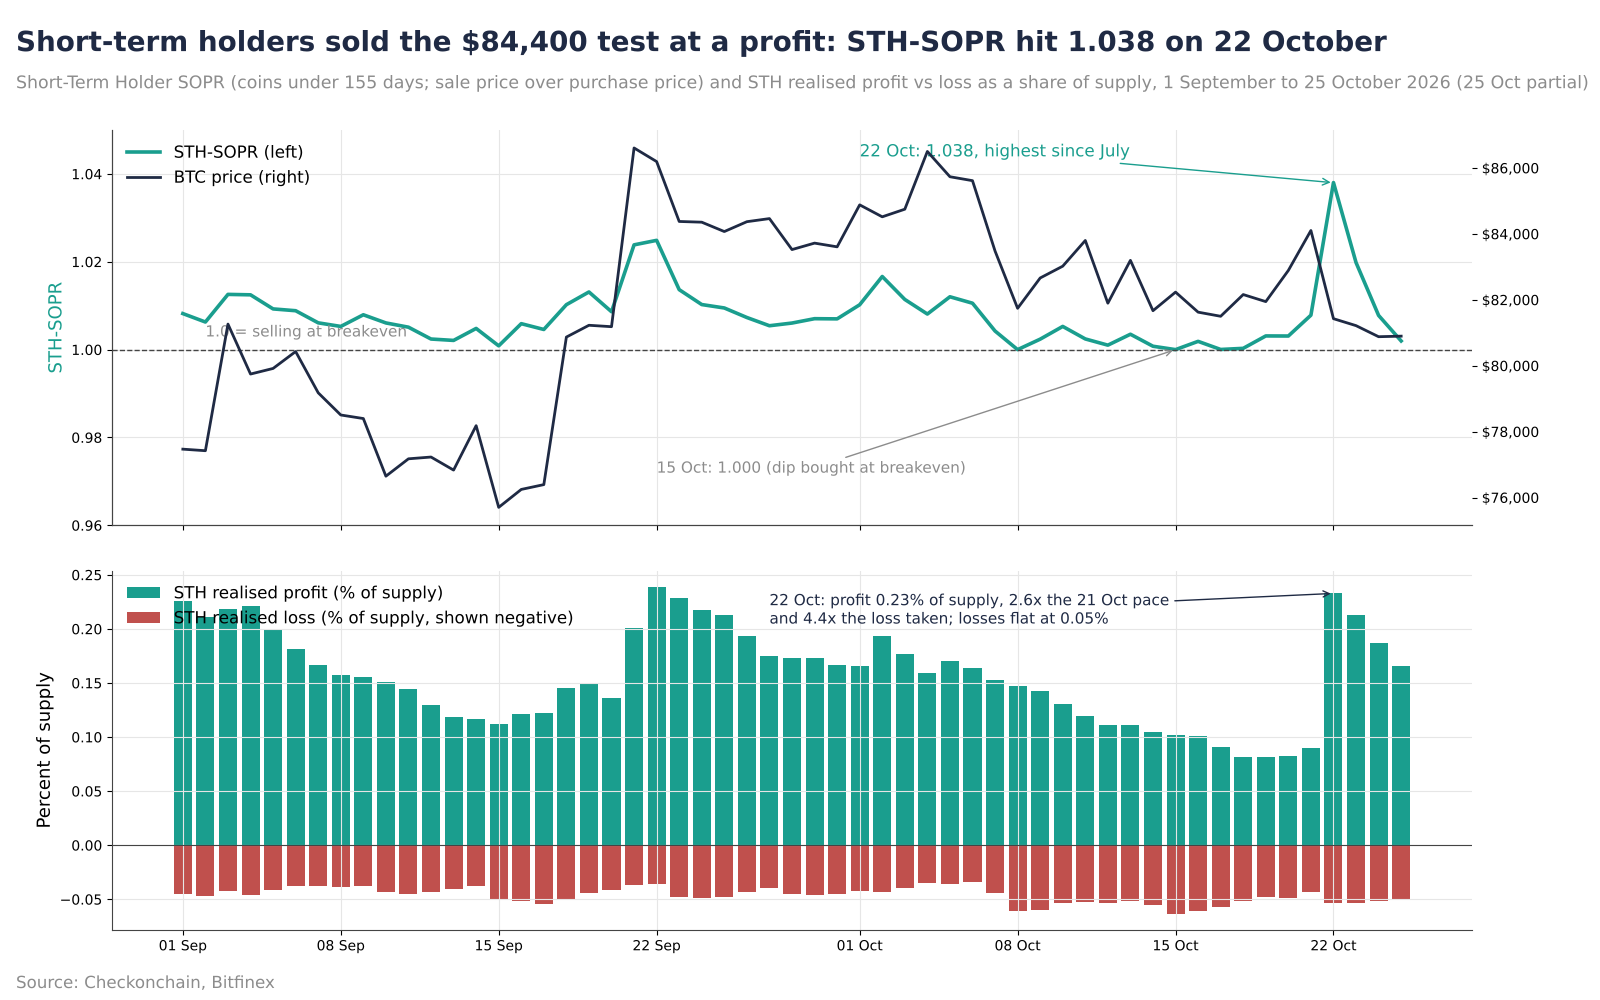
The Spent Output Profit Ratio (SOPR), which compares the price at which coins are sold with the price at which they were purchased, ranged from 1 to 1.008 for short-term holders (those holding coins for 155 days or less) between 15 and 21 October, indicating that selling was taking place at or above cost.
On 22 October SOPR printed 1.038, meaning that coins sold by short-term holders that day were sold at an average profit of 3.8 percent, the highest reading since July. STH realised profit rose from 0.09 percent of supply on 21 October to 0.23 percent on 22 October, while realised loss remained at 0.05 percent. This suggests that selling was primarily driven by holders taking profits rather than forced liquidations.
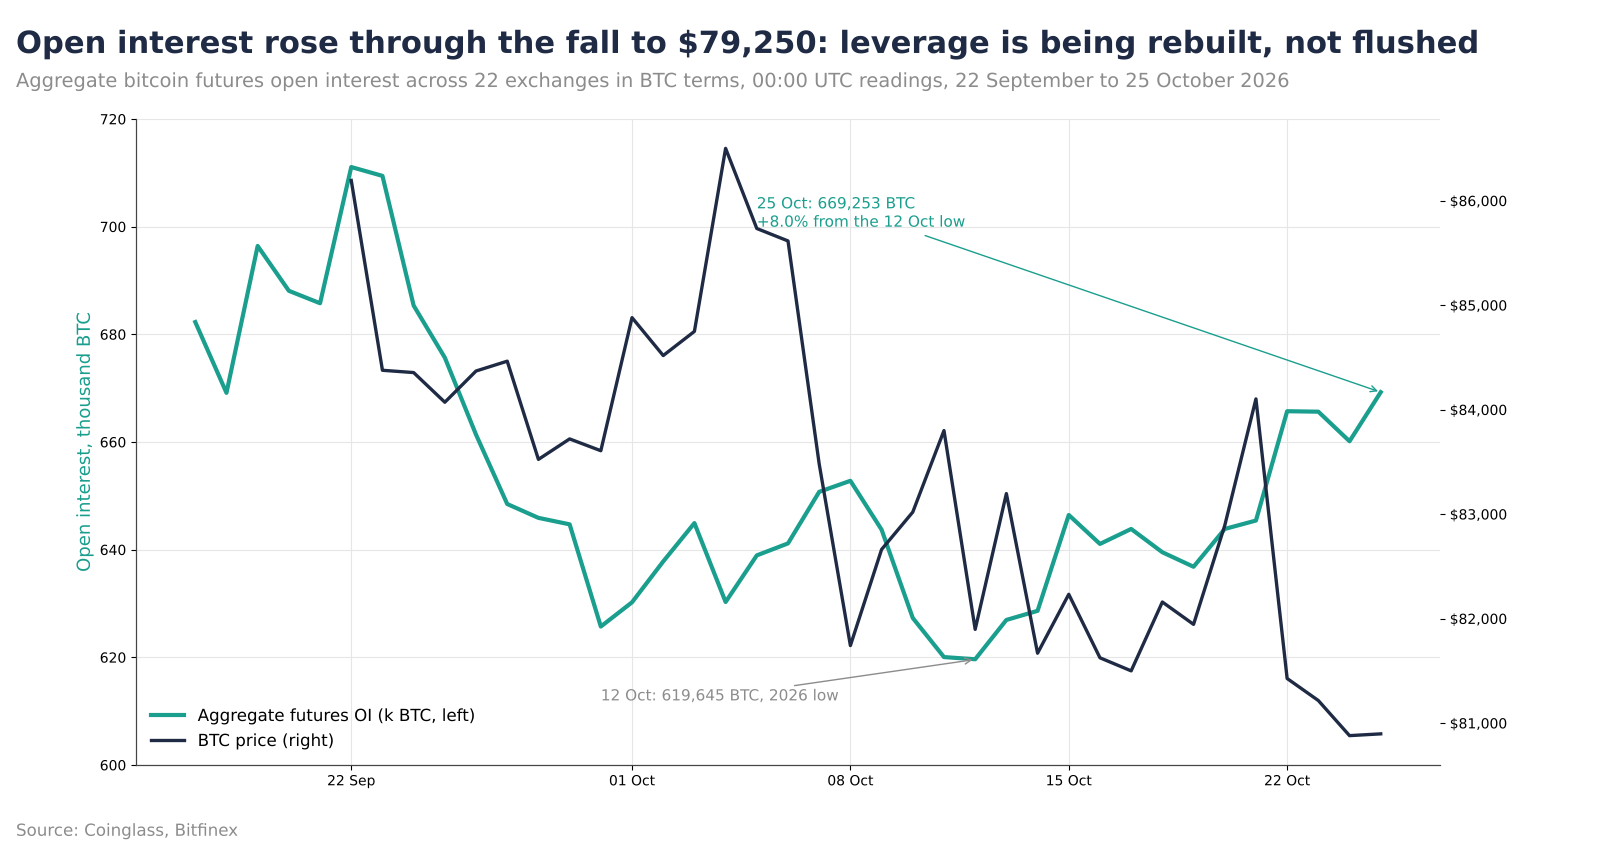
Futures data indicates that the fall to $79,250 on 24 October was driven by spot distribution, with OI rising as price declined. Aggregate OI rose from 645,411 BTC on 21 October to 669,253 BTC on 25 October — the highest level since 25 September. Bitcoin’s price fell by 3.8 percent, while the funding rate remained positive at 7.3 percent annualised, indicating that long positions continued to pay shorts despite the decline. Each of October’s three main liquidation events saw fewer long liquidations than the one before, from $1.05 billion on 8 October to $918 million from 14 to 15 October and $687 million on 24 October.
The OI figures below illustrate this persistent expansion:
12 October (2026 low): 619,645 BTC
21 October: 645,411 BTC
22 October: 665,718 BTC
25 October (00:00 UTC, highest since 25 September): 669,253 BTC
Liquidation trends reinforce this dynamic:
8 October: $1.05 billion in long liquidations
14–15 October: $918 million in long liquidations
24 October (24-hour window to evening): $687 million in long liquidations (per Coinglass aggregated data)
Although each successive flush saw fewer liquidations than the previous, aggregate OI continued to rise. This indicates that market positioning has not undergone the typical reset seen at durable bottoms, where OI drops alongside prices and remains subdued.
Options market positioning further signals that traders currently treat this Fed week as the main catalyst while viewing the US midterm elections as a non-event. The 30 October expiry has OI interest of 136,165 BTC (about $11.0 billion notional), with a put-to-call ratio of 0.56 and a max pain level of $78,000. With at-the-money implied volatility at 31.8 percent on 25 October, options pricing implies a one-standard-deviation range of $77,800 to $83,800 by expiry, and an expected one-day move of 1.7 percent.
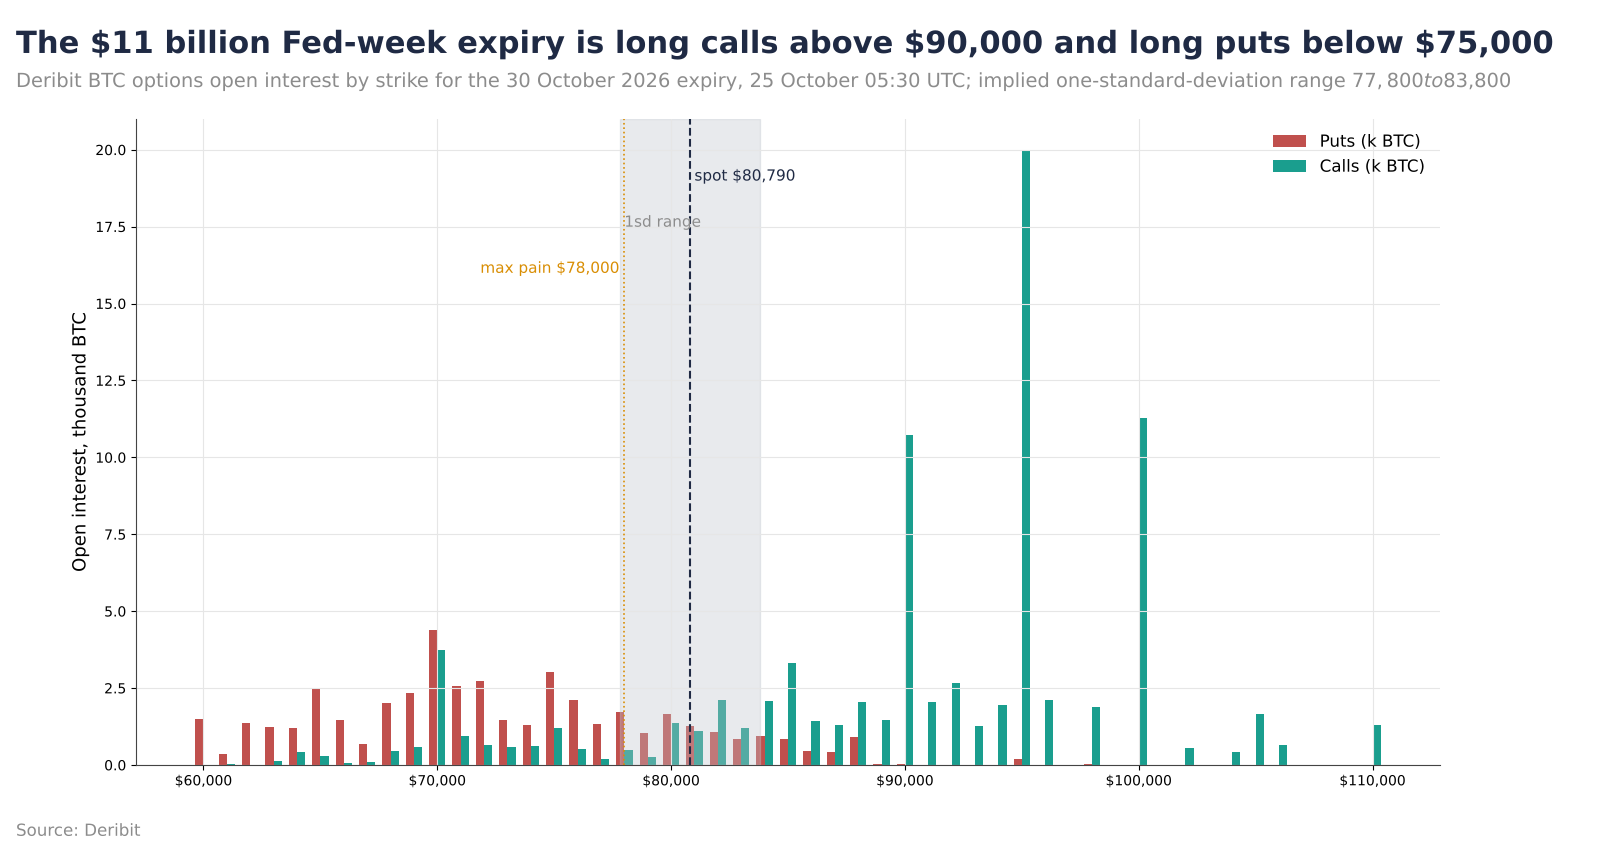
The heavy concentration of calls at $90,000 to $100,000 and puts at $70,000 to $75,000 implies dealer hedging is unlikely to impact price discovery unless those extreme bounds are tested.
Meanwhile, the first expiration following the midterm elections on 6 November carries a modest $1.0 billion in OI.

Catalysts and Risks
The Fed's Hold Delays the Rate Hike, It Does Not Cancel It
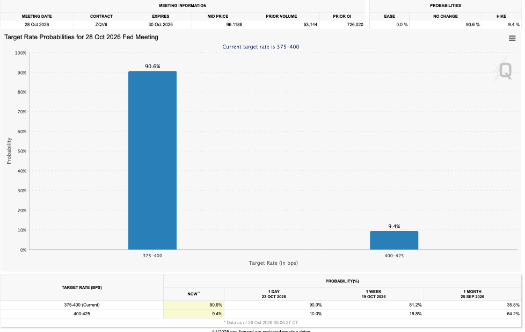
Figure 7. CME FedWatch Tool – Target Rate Probabilities for 28 October Fed Meeting
The surprise last week was not the growing expectation that the Fed would leave interest rates unchanged, but rather the speed at which the market shifted expectations of a rate hike to the December Fed meeting. A month ago, on 24 September, futures priced in a 68.6 percent probability that the Fed would raise its target range from 375-400 to 400-425 basis points at this week’s meeting. As of 25 October, that probability had fallen to 9.4 percent, while the probability of the same increase at the 9 December meeting stood at 72.1 percent. Across all possible outcomes, CME FedWatch indicated a 72.1 percent chance that rates would end the year above the current 375-400 basis point range. In other words, expectations of tighter monetary policy have not disappeared, but have been deferred by six weeks.
The Fed’s decision on Wednesday (October 28) is therefore unlikely to surprise markets, with a hold already priced in at 90 percent. The data that will shape expectations for December arrive the day after the Fed decision, with the release of the advance estimate of third-quarter GDP and September personal income and outlays both scheduled for 8:30 am on Thursday 29 October. Growth near three percent alongside persistently firm core inflation would reinforce expectations of a December rate hike.
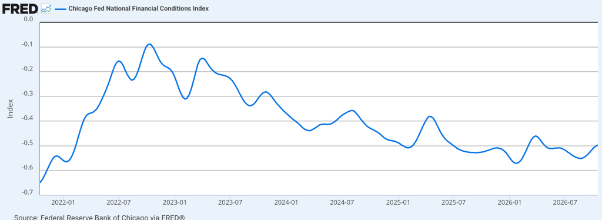
Figure 8. Chicago Fed Financial Conditions Index
Credit has already tightened without any increase in rates. The Chicago Fed National Financial Conditions Index, which measures funding conditions across money, debt and equity markets, rose for a fifth straight week to -0.496 in the week ending 16 October, from -0.528 a month earlier. Any increase in the index indicates tightening financial conditions, although negative readings still indicate conditions that are looser than the historical average. This is a key indicator for crypto: with a December rate hike still priced in, price remains anchored at current levels and liquidity does not loosen, whatever the Fed says on Wednesday. If new data released this week push the probability of a December rate hike below 50 percent, that would be the first genuine easing signal of this cycle.

AI Borrowing Costs Are The First Place Tighter Credit Shows Up
The AI build-out is among the most debt-dependent trades in the market. The Philadelphia Semiconductor Index (SOX), which tracks the 30 largest US-listed chip and chip-equipment companies, fell 17.9 percent in the three weeks to 23 October. The heaviest selling came during the 22 October trading session.
This pressure may reflect concerns about financing rather than simply weakening demand. CoreWeave, which provides AI computing capacity, reported $35.1 billion in borrowing as of 30 June, alongside $16.5 billion in lease obligations and $640 million in net interest expense for that quarter alone. By contrast, it reported a $103.7 billion order book, with 41 percent expected to be recognised as revenue by June 2028. Interest costs are being incurred today, while much of the contracted revenue will be recognised over time.
This is a test for investors, not of the technology itself. Capacity that proves useful can still be built by companies whose lenders are repaid late or not in full.
For crypto the transmission runs through risk appetite, as reflected in the price moves that link them. The 10-year inflation-adjusted Treasury yield represents the return on a low-risk asset adjusted for inflation, and is therefore the hurdle BTC has to beat as a non-yielding asset. It fell to 2.66 percent on 23 October from 2.91 percent on 9 October. Its sharpest fall of the month, to 2.64 percent, came on 22 October, the same day the SOX dropped sharply.
The decline in real yields appears to reflect growing risk aversion rather than improving financial conditions, which helps to explain why it has offered little support to bitcoin. That reading would change if bitcoin began to recover while SOX stabilised and yields remained near 2.66 percent.

Outlook for the Week
Base Case
Bitcoin enters the week having lost $81,300 as support, with leverage that has yet to reset and spot demand still absent. We expect it to trade below $81,300 for most of this week unless that changes, within the $77,800 to $83,800 range implied by options pricing ahead of Friday’s expiry. Risks are skewed towards a retest of the 24 October low at $79,250 and, below that, the $77,000 to $77,765 support area where the ‘new whale’ cost basis and the True Market Mean sit. Any upticks that occur early in the week would face the short liquidation clusters with confluence along with cost-basis clusters around the $82,500 level. The Fed’s decision on Wednesday is unlikely to change this outlook, given that rates are expected to remain unchanged and the probability of a December hike still stands at 68.9 percent. Any advance will need to be driven by renewed spot buying rather than an easing of financial conditions.

What Would Confirm It
If rallies towards $81,300 are met with selling pressure from holders of the 874,000 BTC accumulated between $81,000 and $82,500, preventing bitcoin from reclaiming $81,300 on a sustained basis, this would reinforce the view that the level has flipped to resistance.
Open interest rising as bitcoin approaches $79,250, with funding still positive, would suggest new longs entering the decline rather than capitulation, making a continuation lower more likely.
BTC trading flat or lower while the 10-year inflation-adjusted yield falls further and SOX continues to decline would reinforce the view that lower yields are not translating into stronger risk appetite. A hold on 28 October, with the probability of a December rate hike remaining above 60 percent on CME FedWatch, would support the view that expectations of a rate hike have been deferred rather than abandoned. A sixth straight rise in the National Financial Conditions Index on the same day would provide further confirmation.

What Would Invalidate It
Acceptance of price back above $81,300, followed by a move through $82,500 where short liquidations are clustered and backed by renewed ETF inflows, would suggest the consolidation phase is complete and open the path towards the $84,374 ETF cohort cost basis.
Open interest falling as bitcoin potentially retests the $79,250 low would suggest long positions are being forced out and selling pressure may be exhausting itself, weakening the case for further downside.
BTC rising while the 10-year inflation-adjusted yield holds near 2.66 percent and SOX stabilises could indicate that the lower hurdle is reaching crypto after all, and that macroeconomic conditions have become supportive sooner than we expect. Third-quarter GDP below 3 percent alongside core PCE inflation at 0.3 percent or less on Thursday (29 October), if accompanied by a fall in the probability of a December rate hike to below 50 percent, would remove a key constraint underpinning our outlook. These thresholds are ours, not consensus figures.

What to Watch
Mega-cap earnings: Alphabet, Amazon, Microsoft and Intel report this week, potentially driving movements in SOX and therefore influencing the broader risk appetite that affects bitcoin.
Federal Open Market Committee decision and the Chicago Fed National Financial Conditions Index: Both Wednesday, 28 October. A hold is priced in with a probability of 90 percent, making the Fed’s guidance on December particularly important.
Advance third-quarter GDP and September personal income and outlays: Both Thursday, 29 October at 12:30 pm UTC. These will be among the most important data releases shaping expectations for the December Fed meeting.
European Central Bank decision: Thursday 29 October. A hold is expected, and any relevance for crypto is in how the dollar trades. A widening rate gap in the dollar’s favour could tighten financial conditions for dollar-denominated risk assets.
The 30 October options expiry: Open interest of 136,165 BTC with max pain at $78,000, alongside changes in open interest and cumulative volume delta if bitcoin retests $79,250.