

Issue #200:
BTC Moves Lacking Conviction
Macro Forces Drive Bitcoin but Structural Momentum Remains Constrained
Bitcoin’s recent rally has been driven primarily by macro catalysts rather than a durable shift in market structure. A 9 percent rebound, triggered by a temporary US–Iran ceasefire and softer Consumer Price Index data, briefly pushed BTC higher, but the move lacked follow-through as spot demand faded into the week. This reinforces the current regime: Bitcoin is trading as a high-beta macro asset, reacting to external developments rather than leading price discovery.
The broader macro backdrop remains the dominant force. A critical divergence has emerged between financial markets and physical commodities, with oil spot markets continuing to price supply disruption despite risk assets rallying. This disconnect signals that the current “risk-on” impulse is fragile and contingent on geopolitical stability that has yet to materialise. At the same time, institutional behaviour reflects caution, with prior accumulation phases giving way to inconsistent demand and fading absorption.

Structurally, the market has transitioned into a more balanced but constrained state. Options positioning shows localised stability, with long gamma support around $69,000–$71,500 limiting immediate downside, while resistance strengthens above. The True Market Mean near $78,000 remains the key pivot, and with the AVIV Ratio still below 1, Bitcoin continues to trade in a discounted, mid-cycle bearish regime rather than an expansion phase.
An energy-driven supply shock, triggered by disruptions in global oil markets, has pushed headline inflation higher, with CPI data showing a sharp monthly increase. At the same time, the more policy-relevant Personal Consumption Expenditures metric indicates that inflation was already persistent beneath the surface, with core inflation running at an elevated pace prior to the escalation in tensions.
This inflation dynamic is occurring alongside weakening household fundamentals. Real income growth has deteriorated, while consumption remains supported by declining savings and increased reliance on credit. In parallel, broader economic activity has slowed, with GDP growth revised lower and consumer sentiment falling to historically weak levels. Rising energy costs appear to be amplifying both inflation expectations and financial strain, reinforcing the risk of second-round effects that could embed inflation more deeply across the economy.
Against this backdrop, the Federal Reserve faces a more constrained policy environment. While growth is moderating, persistent core inflation and rising expectations limit the scope for near-term easing, reinforcing a “wait and see” stance as policymakers assess whether the current shock will broaden into sustained price pressures.
This evolving macro landscape is increasingly shaping developments within the digital asset ecosystem, where regulatory positioning and institutional participation are accelerating in parallel. In the United States, authorities are moving to integrate stablecoins more directly into the financial regulatory perimeter, with proposals that would require issuers to actively monitor and enforce compliance at the transaction level. This shift reflects a broader reclassification of stablecoins from neutral infrastructure to systemically relevant financial instruments, signalling deeper convergence between crypto and traditional finance.
At the same time, institutional engagement with Bitcoin continues to strengthen. Morgan Stanley’s entry into the spot Bitcoin ETF market, supported by competitive fee structures and its extensive wealth management distribution network, highlights a structural shift in demand. Capital allocation into Bitcoin is increasingly being driven by institutional channels rather than retail-driven cycles, suggesting a more durable integration of digital assets into traditional portfolios.
This trend is mirrored internationally, with Hong Kong advancing a regulatory framework for stablecoins that places major financial institutions at the centre of issuance. By granting licences selectively to established banks, regulators are effectively embedding digital currencies within existing financial infrastructure, reinforcing credibility while tightening oversight. The approach underscores a global divergence in regulatory strategies, with some jurisdictions opting for integration and institutionalisation rather than restriction.
Market Signals
Bitcoin Remains Resilient but Dependent on Macro for Major Directional Move
Bitcoin rallied 9 percent from trough to peak this week, marking its strongest weekly performance since February. The move was driven by two closely timed catalysts: a fragile US–Iran ceasefire brokered by Pakistan on 8 April, and a softer-than-expected core CPI print on 10 April. The recovery was led by aggressive spot buying, indicating genuine demand rather than derivatives-driven expansion.
This confluence of macro relief and spot-led flows briefly pushed BTC above $73,800. However, the quality of the rally remains questionable. The move occurred within a still-fragile structural backdrop, where upside lacked sustained follow-through and failed to decisively reclaim higher timeframe resistance. Without continued spot absorption or confirmation through broader flow regimes, the rally appears more reactive than structural, leaving the market vulnerable to reversal once the initial catalyst-driven impulse fades.
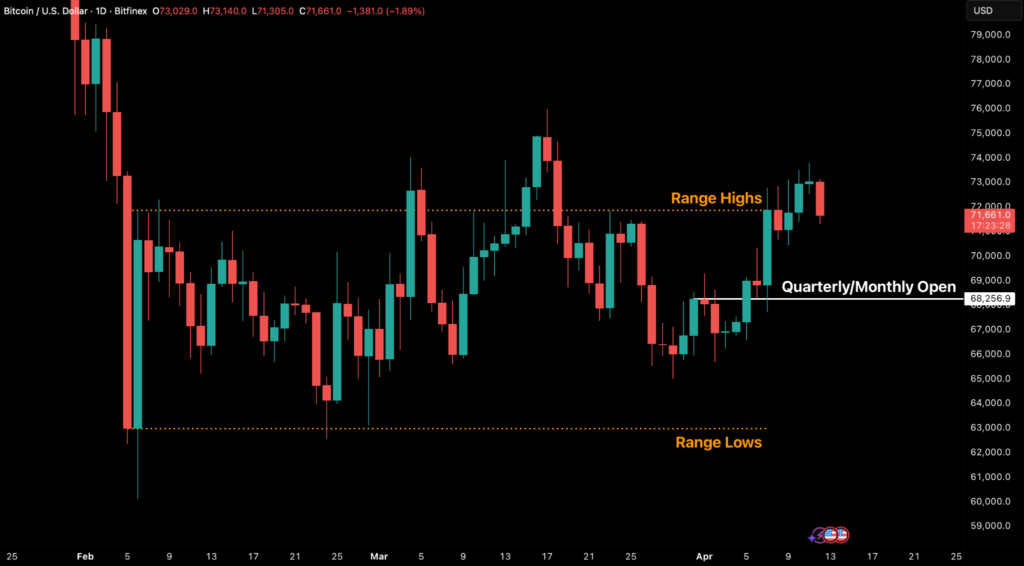
Figure 1. BTC/USD Daily Chart. (Source: Bitfinex)
From April 7, structural and aggressive spot buying (taker orders) intensified before slowing down towards the end of the week.
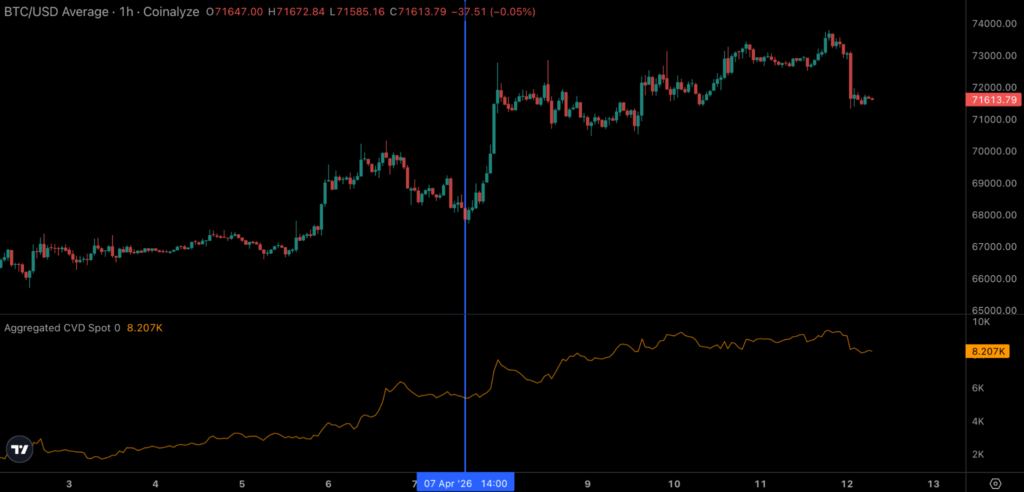
Figure 2. BTC/USD Hourly Chart With Spot Cumulative Volume Delta. (Source: Coinalyze)
Cumulative Spot Volume Delta (CVD) highlights the aggressive buying before it later subsided. Following a statement by Vice President J.D. Vance on Sunday, 12 April that there was no agreement with Iran, the market moved down 3.4 percent from local highs.
Bitcoin is behaving like a reactionary asset, and trading at higher volatility than other assets.
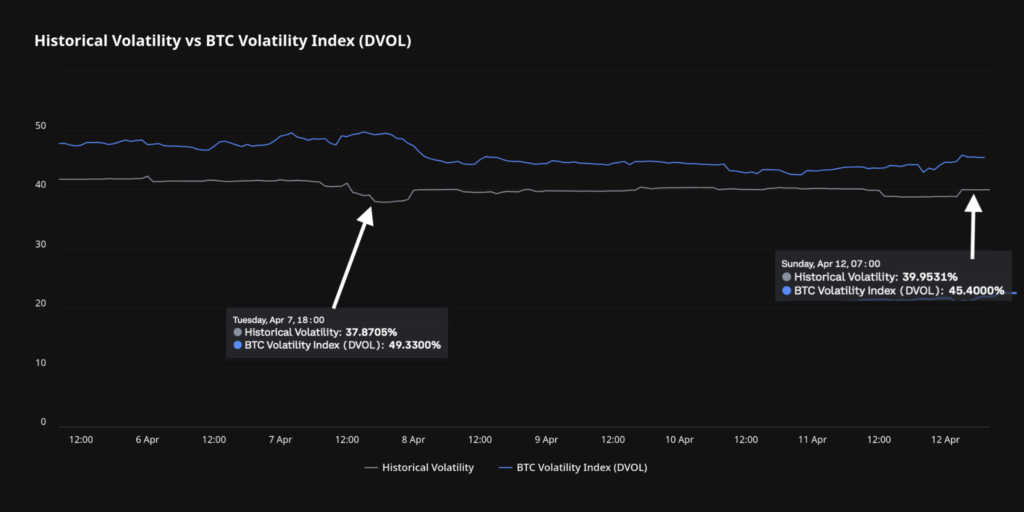
Figure 3. Bitcoin Implied vs Realised Volatility. (Source: Deribit Metrics)
As Figure 3 above shows, since the announcement of the ceasefire volatility has recently settled but is still somewhat elevated, with the volatility premium (the difference between the implied and historical volatility) converging to 5.4 percent from greater than 11 percent just a week prior.
BTC Price at Odds with Oil Markets
The ceasefire represents thus far the defining macro event of the quarter. Following 40 days of sustained conflict, the two-week ceasefire, and a reopening of the Strait of Hormuz to commercial shipping, there has been a sharp and somewhat disorderly cross-asset response. Brent crude futures declined approximately 13 percent from above $110 to $96 per barrel, the S&P 500 advanced 3.9 percent on the week (6,559 to 6,817), and risk assets repriced higher across the board. BTC, which has traded as a high-beta macro asset over the past six weeks, followed this move.
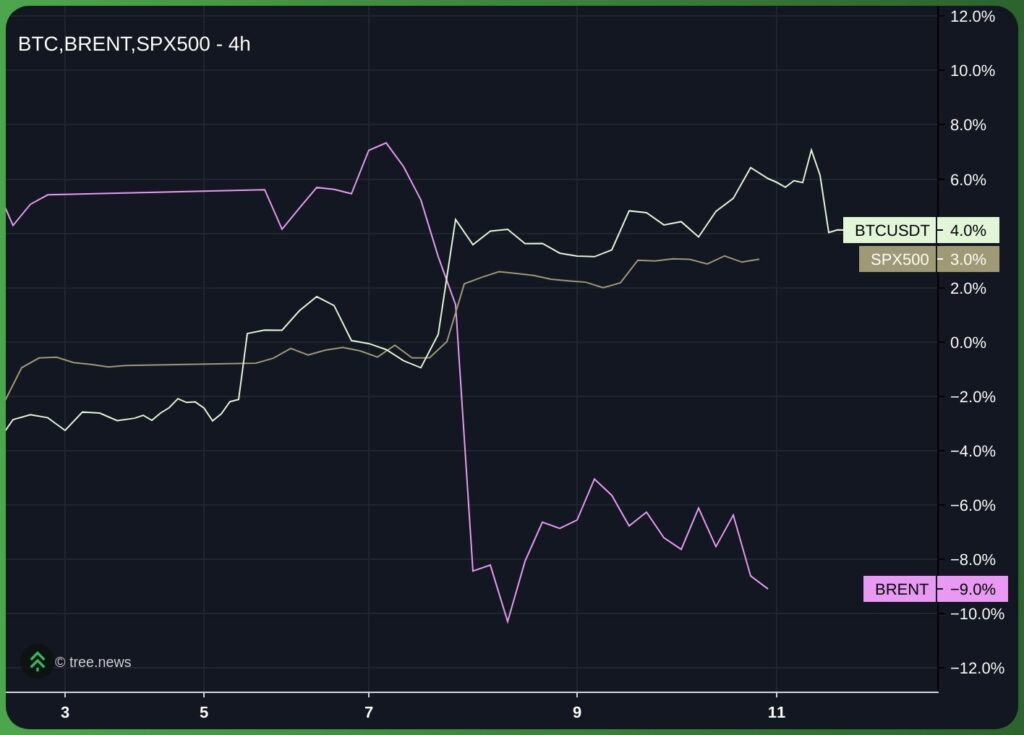
Figure 4.BTC, Brent and SP500 Relative Performance Since Ceasefire News.
(Source: Tree)
However, the key issue remains durability rather than direction. Within hours of the announcement, multiple violations were reported, undermining confidence in the agreement. Iran’s Islamic Revolutionary Guard Corps subsequently halted tanker traffic through the Strait, citing an Israeli ceasefire breach in Lebanon, with only three vessels transiting the waterway on April 9. This fragility is being explicitly priced in the physical oil market. Dated Brent representing real spot transactions settled at $124.68 per barrel on April 9, implying a $28.68 premium to ICE Brent futures at $96.
This dislocation is critical. While futures markets are pricing a resolution narrative, the physical market which reflects actual supply-demand constraints is signalling persistent disruption risk. The spread effectively represents the real economy’s rejection of the ceasefire’s credibility, reinforcing that the current risk-on repricing across assets is contingent on a macro outcome that has yet to demonstrate stability.
This key cross-asset divergence encapsulates the core tension driving this week’s price action. Despite a notable 9 percent rally in BTC following the announced ceasefire, entities responsible for physical crude oil movement remain sceptical. The $28.68 spread between Dated Brent and ICE Brent Futures is the widest since the conflict’s inception, signalling a sharp disconnect: financial assets, including BTC, are pricing in a return to peace, while physical supply chains are not yet convinced. The durability of the current market optimism hinges on this metric. A contraction of the spread below the $10 threshold would validate the rally. Conversely, if the spread widens, or fails to significantly contract within the next week, a sharp reversal in the financial market repricing, including for BTC, is highly probable.
Derivatives Markets Stabilising
In the options market, the gamma profile has shifted materially from its previous negative configuration. Previously, BTC was trading within a broad short gamma regime spanning from the low $40,000s to $68,000, a structure that mechanically amplified price movements in both directions as dealers were forced to hedge pro-cyclically, leading to price expansion in either direction if BTC broke above/below pivotal levels. The spot market’s aggressive buying supplemented that price appreciation.
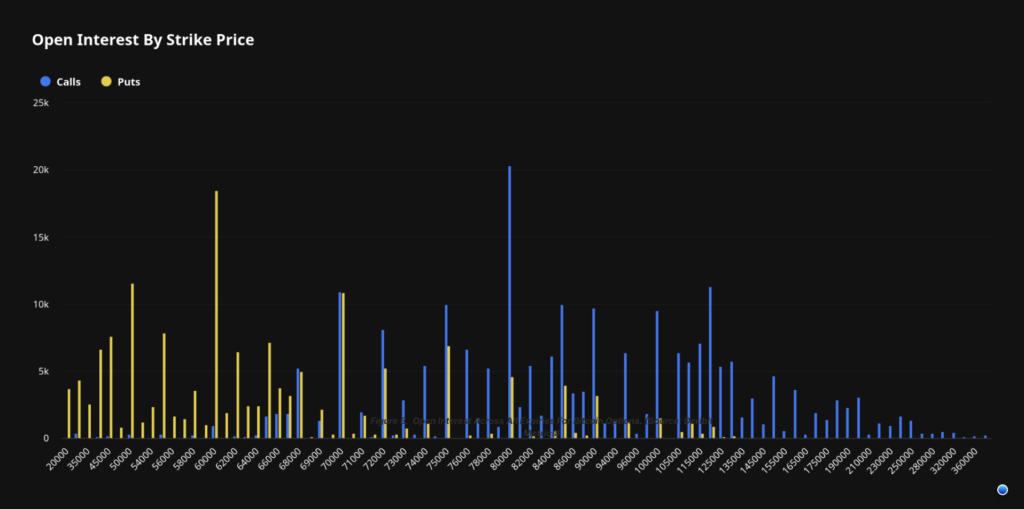
Figure 5. Open Interest Across All Expiries For Bitcoin Options. (Source: Deribit Metrics)
That structure has now evolved into a more segmented regime. Short gamma is largely concentrated above the current price, while a defined pocket of long gamma has developed in the $69,000 to $71,500 range. This creates a stabilising dynamic in the near term, as dealers are incentivised to buy into weakness within this band, dampening downside volatility and providing localised support.
At the same time, renewed demand for upside exposure, driven by recent geopolitical developments, has primarily been expressed via spread structures rather than outright calls. This is a critical distinction, as it limits convexity in the near term and shifts short gamma exposure higher up the curve, particularly beyond the $80,000 region, which is a pivotal resistance level for price based on on-chain metrics such as the True Market Mean.
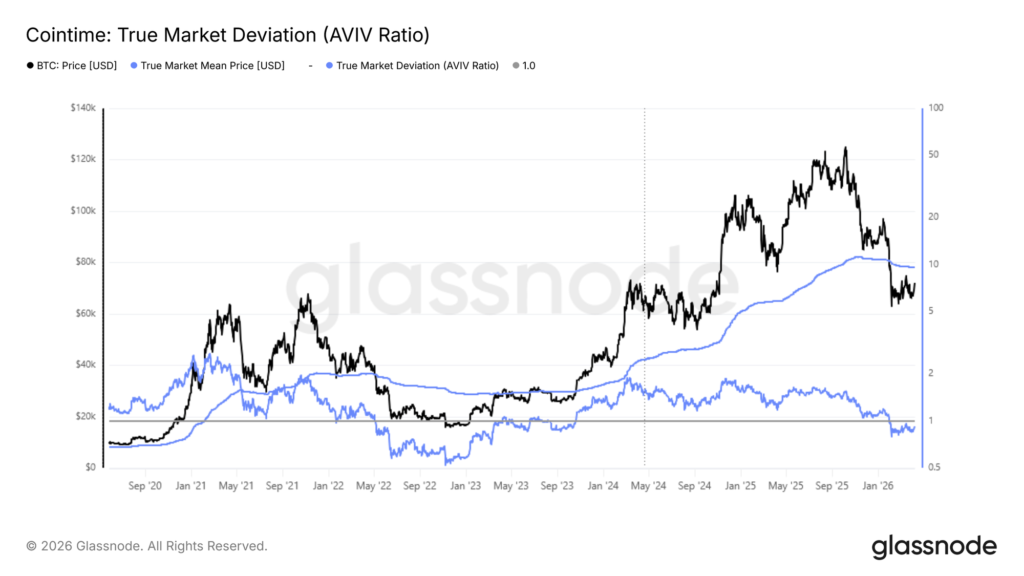
Figure 6. Bitcoin AVIV Ratio And True Market Mean. (Source: Glassnode)
The True Market Mean, currently positioned at $78,000, continues to act as the key structural pivot and probable mid-term ceiling for any relief-driven upside. Until price can reclaim and sustain above this level, rallies should be viewed within the context of broader bear market structure rather than the start of a new expansion phase.
The Asset Value Investor Value (AVIV) Ratio provides a more precise valuation framework for contextualising this regime. Defined as the ratio of spot price to the True Market Mean, it effectively measures where the market is trading relative to the active investor cost basis. At 0.92 and having remained below 1 since early February, the metric confirms that BTC is still trading at a discount to aggregate positioning, reinforcing the persistence of a bearish regime.
From a cycle perspective, the current reading closely aligns with the May–June 2022 phase, where markets had exited initial capitulation but had not yet established a durable recovery. Importantly, while this places the market firmly within a bear structure, it remains materially above the deeply compressed levels observed during Q3–Q4 2022, where forced deleveraging and systemic stress dominated.
This distinction matters. The current environment reflects a controlled drawdown rather than disorderly capitulation, suggesting that while upside remains structurally capped below the True Market Mean, downside is less likely to be driven by forced selling dynamics. Instead, the market is more likely to transition through a prolonged re-accumulation phase, with recovery timelines dependent on the re-establishment of sustained demand and a shift in broader liquidity conditions.
The net result is a transition toward a more balanced positioning framework. Downside moves are likely to be more contained in the immediate term due to the presence of long gamma support, while overhead resistance strengthens as we have pivotal onchain resistance levels and strengthening negative gamma as negotiations stall on the geopolitical side. This creates an asymmetric structure where volatility compression dominates near current levels, but breakout attempts particularly to the upside will require sustained spot demand to overcome dealer-driven supply.
General Macro Update
Energy Shock Drives Inflation Higher as War Disrupts Global Markets
Higher inflation and weakening household financial conditions in the United States are already being felt following rising geopolitical tension and the sharp increase in energy prices.. The combined effect of disrupted oil supply, deteriorating real income growth and persistent price pressures across both Consumer Price Index (CPI) and Personal Consumption Expenditures (PCE) metrics suggests that inflation risks remain firmly to the upside in the near term.
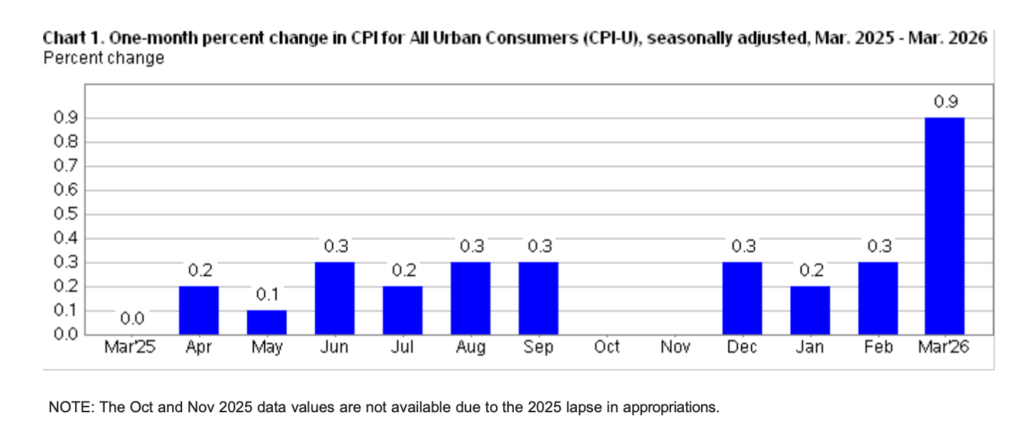
Figure 7. One-Month Percent Change in Consumer Price Index
The CPI rose by 0.9 percent in March and by 3.3 percent compared to a year ago, reflecting one of the fastest monthly increases in recent years. This surge was largely driven by a sharp rise in energy costs, highlighting how external shocks can quickly feed into domestic inflation.
The broader and more policy-relevant Personal Consumption Expenditures (PCE) index, also indicated underlying weakness, even prior to the escalation in geopolitical tensions. Core PCE inflation rose at a 3.7 percent three-month annualised pace in February, signalling that inflationary pressures were already elevated even before the energy shock intensified. This measure, which is closely monitored by the Federal Reserve, is widely regarded as a more reliable gauge of persistent inflation trends.
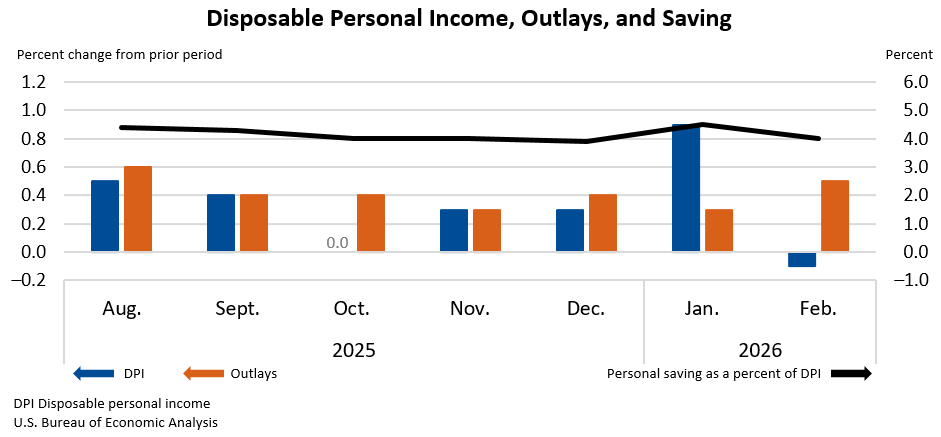
Figure 8. Disposable Personal Income (Source: US Bureau of Economic Analysis)
The underlying driver of the most recent inflationary acceleration is of course the closure of the Strait of Hormuz, a critical route for around 20 percent of global oil supply, which has pushed prices sharply higher. With oil prices increasing from around $70 to as high as $120 per barrel, the cost of transporting goods and producing services also increases. Businesses typically pass these higher costs on to customers, leading to broader price increases beyond just fuel.
At the same time, PCE data revealed a deterioration in household financial resilience even before the energy shock. Inflation-adjusted income has declined, with real disposable income falling by 0.5 percent in February, while spending increased by 0.5 percent. This divergence reflects a growing reliance on savings and credit to sustain consumption, with the savings rate declining to 4 percent from 4.5 percent. When income growth fails to keep pace with inflation, purchasing power weakens, leaving households increasingly vulnerable to additional price shocks.
The combination of rising spending and declining real income is particularly concerning in the context of elevated core inflation. The persistence of core PCE at a 3.7 percent annualised pace suggests that inflation is not confined to volatile components such as energy, but is becoming more embedded across the broader economy. This dynamic increases the risk that any energy-driven inflation will spill over into services and other core categories, as it extends beyond fuel and into other sectors such as transportation, travel and food. These second-round effects can have a more sustained impact on moving prices upward. At the same time, consumer sentiment has deteriorated, as inflation expectations also move higher, reflecting growing concern about affordability.
From a policy perspective, the Federal Reserve is likely to remain cautious as it evaluates both CPI and PCE dynamics. While central banks typically avoid responding aggressively to supply shocks, the persistence of elevated core PCE inflation and weakening real income trends complicates the policy outlook. Policymakers will closely monitor whether inflation broadens further and whether expectations worsen.
The picture becomes more complicated because inflation in the economy is now no longer driven solely by domestic demand but is increasingly shaped by global geopolitical developments and underlying structural pressures within the economy. The combination of higher energy costs, persistent core inflation, weakening real income growth and declining savings creates a challenging environment for both households and policymakers, with limited signs of immediate relief in the months ahead.
US Growth Hit by Energy Shock and Rising Inflation Risk
US economic activity showed signs of deceleration as consumer confidence weakened and inflation risks intensified due to rising energy prices. At the same time, policymakers remain divided on the path of interest rates, highlighting growing uncertainty in the macroeconomic outlook.
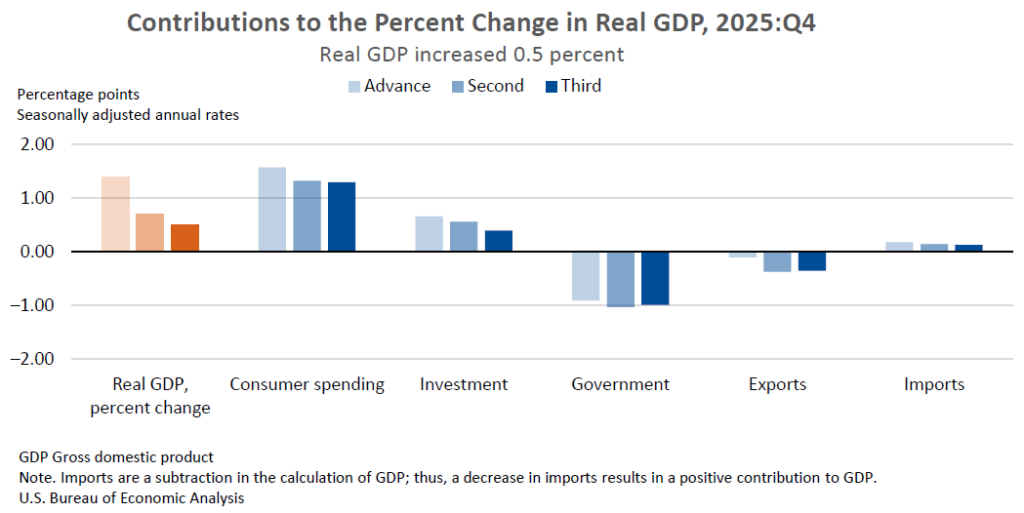
Figure 9. Contributions to the Percent Change in Real GDP
(Source: US Bureau of Economic Analysis)
Gross Domestic Product (GDP) data released by the Bureau of Economic Analysis (BEA) showed that US economic growth slowed to 0.5 percent in the fourth quarter, revised down from an earlier estimate of 0.7 percent. GDP measures the total value of goods and services produced in an economy and is a key indicator of economic health. The downgrade was driven by weaker business investment, particularly in inventories and intellectual property, as well as slightly softer consumer spending, which grew at 1.9 percent. However, corporate profits rose sharply, suggesting that firms maintained pricing power despite slowing demand.
Underlying demand also softened. Final sales to private domestic purchasers, a measure that strips out volatile components such as trade and government spending, grew at 1.8 percent, indicating more moderate domestic momentum. However, while headline growth slowed significantly from the previous quarter, alternative measures such as gross domestic income (GDI) showed stronger expansion, reflecting some divergence in how economic activity is measured.
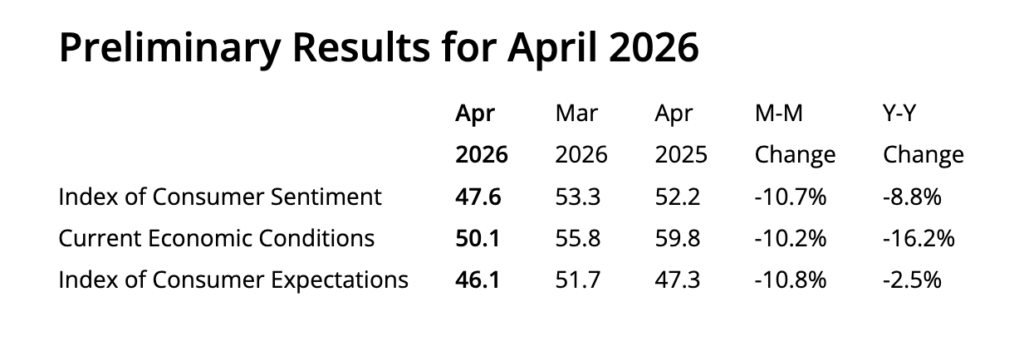
Figure 10. Preliminary Results for Consumer Sentiment, April 2026
Household sentiment is also deteriorating. The Consumer Sentiment Index published by the University of Michigan fell sharply to 47.6 in early April, marking a record low. This index reflects how confident consumers feel about their financial situation and the broader economy. The decline was broad-based across income and demographic groups and was accompanied by a notable rise in inflation expectations, with consumers projecting prices to increase by 4.8 percent over the next 12 months.
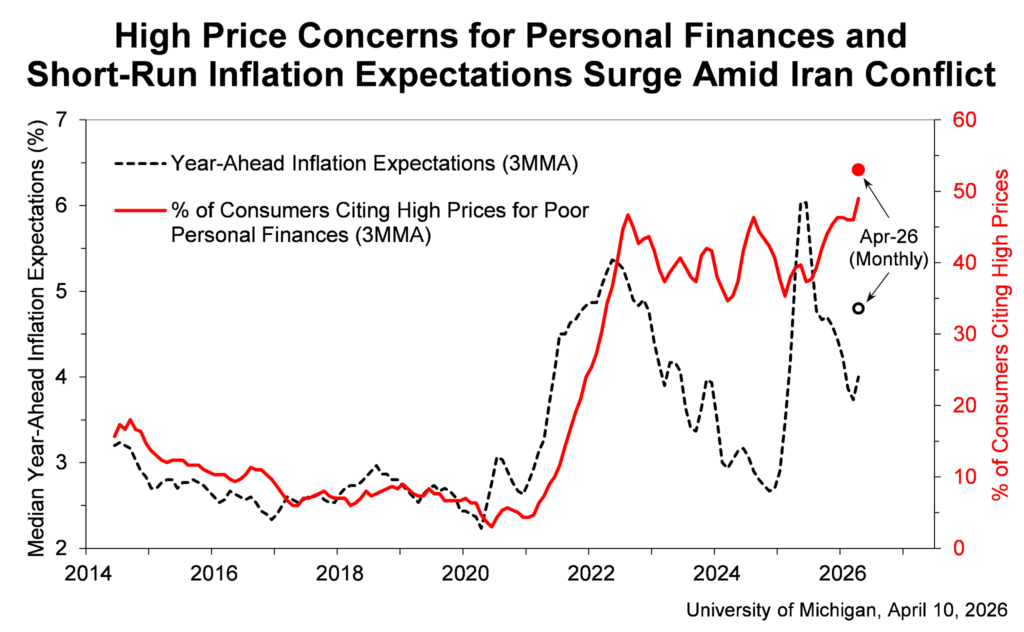
Figure 11. University of Michigan Consumer Inflation Expectation
The weakening outlook for consumers appears closely tied to rising energy costs, with oil prices increasing by more than 30 percent following the conflict with Iran, which has sent gasoline prices above $4 per gallon.
Inflation risk was the central concern reflected in the Federal Reserve minutes of the March policy meeting, with some policymakers advocating for maintaining the option to raise rates in the future. While many policymakers still expect eventual rate cuts, several have delayed their projections due to the current inflation pressure.
The Fed also acknowledged that higher oil prices could delay the return to its inflation target of 2 percent. Most officials indicated that inflation may now decline much more slowly than expected. As a result, the Fed has adopted a “wait and see” stance, balancing the possibility of both rate cuts and hikes depending on how economic conditions evolve.
Overall, the combination of slowing growth, weakening consumer confidence, and rising inflation expectations points to a more complex economic environment. While corporate profitability remains resilient, the trajectory of energy prices and inflation will likely determine whether policymakers prioritise supporting growth or maintaining restrictive monetary conditions in the months ahead.
News From the Cryptosphere
US Treasury Pushes Stablecoin Firms Into Compliance Frontline

The US Treasury is preparing a significant regulatory escalation that would effectively deputise stablecoin issuers as frontline enforcers of financial surveillance and compliance. The proposal would require stablecoin firms to actively monitor, detect, and prevent illicit or “bad” transactions within their networks, aligning them more closely with traditional financial institutions in terms of oversight obligations.
At its core, the initiative reflects a shift in regulatory philosophy: rather than treating stablecoins purely as payment instruments, policymakers are increasingly viewing them as systemically relevant financial infrastructure. This reclassification carries profound implications. Stablecoin issuers would be expected to implement robust anti-money laundering (AML) frameworks, transaction screening systems, and potentially even real-time intervention mechanisms to halt suspicious activity before settlement.
Such requirements would mark a departure from the largely neutral, infrastructure-like role stablecoins have historically played. Instead of simply facilitating transfers on blockchain networks, issuers would assume a quasi-regulatory function, embedding compliance directly into the transaction layer. This could fundamentally alter the permissionless nature of many crypto ecosystems, introducing gatekeeping dynamics more akin to banking rails.
Strategically, the proposal also signals growing concern within the Treasury about stablecoins’ expanding role in global finance. As adoption accelerates, regulators appear intent on ensuring these instruments do not become parallel systems for unchecked capital flows, sanctions evasion, or illicit finance.
However, the implications are double-edged. While enhanced oversight may legitimise stablecoins and accelerate institutional adoption, it could also increase operational burdens, raise barriers to entry, and concentrate power among larger, well-capitalised issuers capable of meeting compliance demands.
Ultimately, this move underscores a broader trajectory: the gradual convergence of crypto infrastructure with traditional financial regulation, where decentralisation increasingly yields to control, compliance, and systemic integration.
Morgan Stanley’s Bitcoin ETF Debut Signals Increasing Institutional Demand

Morgan Stanley entered the spot Bitcoin ETF arena with a strong initial showing, as its debut fund attracted approximately $34 million in net inflows on its first day of trading. While it does not break any records, the figure represents a meaningful signal of institutional and advisor-driven demand, particularly given the increasingly competitive landscape for US spot Bitcoin ETFs.
The fund distinguishes itself primarily through cost leadership. With a management fee of just 0.14%, it undercuts major incumbents like BlackRock’s IBIT, intensifying the ongoing “fee war” among ETF providers. This pricing strategy reflects a broader shift in market dynamics, where differentiation is increasingly driven not by access to Bitcoin exposure itself, but by cost efficiency and distribution strength.
Beyond fees, Morgan Stanley’s structural advantage lies in its vast wealth management network. With thousands of financial advisors and trillions in client assets, the firm has a built-in distribution engine capable of channeling significant capital into the ETF over time. Early inflows, therefore, may represent only an initial allocation phase rather than the full extent of potential demand.
Notably, the launch occurred in the middle of a somewhat cautious market for BTC trading, within a broader risk averse environment. Despite this backdrop, the fact that the ETF still attracted capital suggests that institutional flows may be increasingly decoupled from short-term retail sentiment cycles.
Ultimately, the debut of MSBT reinforces a key trend: the maturation of Bitcoin as an institutional asset class. As competition intensifies around pricing, access, and advisory integration, the battleground is shifting from product innovation to capital capture, where firms like Morgan Stanley hold a decisive edge.
Hong Kong’s First Stablecoin Licenses Mark Institutional Entry Into Web3 Finance

Hong Kong announced the city’s first stablecoin licenses to HSBC and Anchorpoint Financial Limited, a joint venture established by Standard Chartered Bank, HKT and Animoca Brands. This development represents a critical inflection point, as it brings systemically important financial players directly into the issuance and management of fiat-backed digital currencies.
At the core of this initiative is the Hong Kong Monetary Authority’s newly established licensing regime, which provides a regulatory framework for issuer of fiat-referenced stablecoins, particularly those pegged to the Hong Kong dollar. The new rules contain stringent requirements around reserve backing, risk management, transparency, and anti-money laundering compliance, reflecting a “same risk, same regulation” philosophy aligned with traditional finance.
Notably, the Hong Kong authorities are taking a highly selective approach. Despite receiving roughly 36 applications, only a small number of licenses are expected in the initial phase, prioritising institutions with proven financial infrastructure and regulatory experience. This explains the early positioning of global banks, which already play central roles in Hong Kong’s monetary system, including banknote issuance.
Strategically, the move signals a broader convergence between traditional banking and blockchain-based finance. By embedding stablecoin issuance within regulated institutions, Hong Kong is effectively institutionalising digital currencies, transforming them from crypto-native instruments into compliant financial products integrated with existing payment systems.
The implications are far-reaching. Licensed stablecoins could enhance cross-border payments, improve liquidity efficiency, and accelerate tokenisation initiatives across capital markets. At the same time, the framework positions Hong Kong as a regulatory counterweight to more restrictive jurisdictions, potentially attracting global crypto capital and innovation.
Ultimately, this marks the transition of stablecoins from experimental tools to regulated financial infrastructure, anchored not by startups, but by the world’s largest banks.