

Issue #223:
BTC Breakout Faces $85,000 Test
Higher Yields Fade as BTC Breaks Resistance
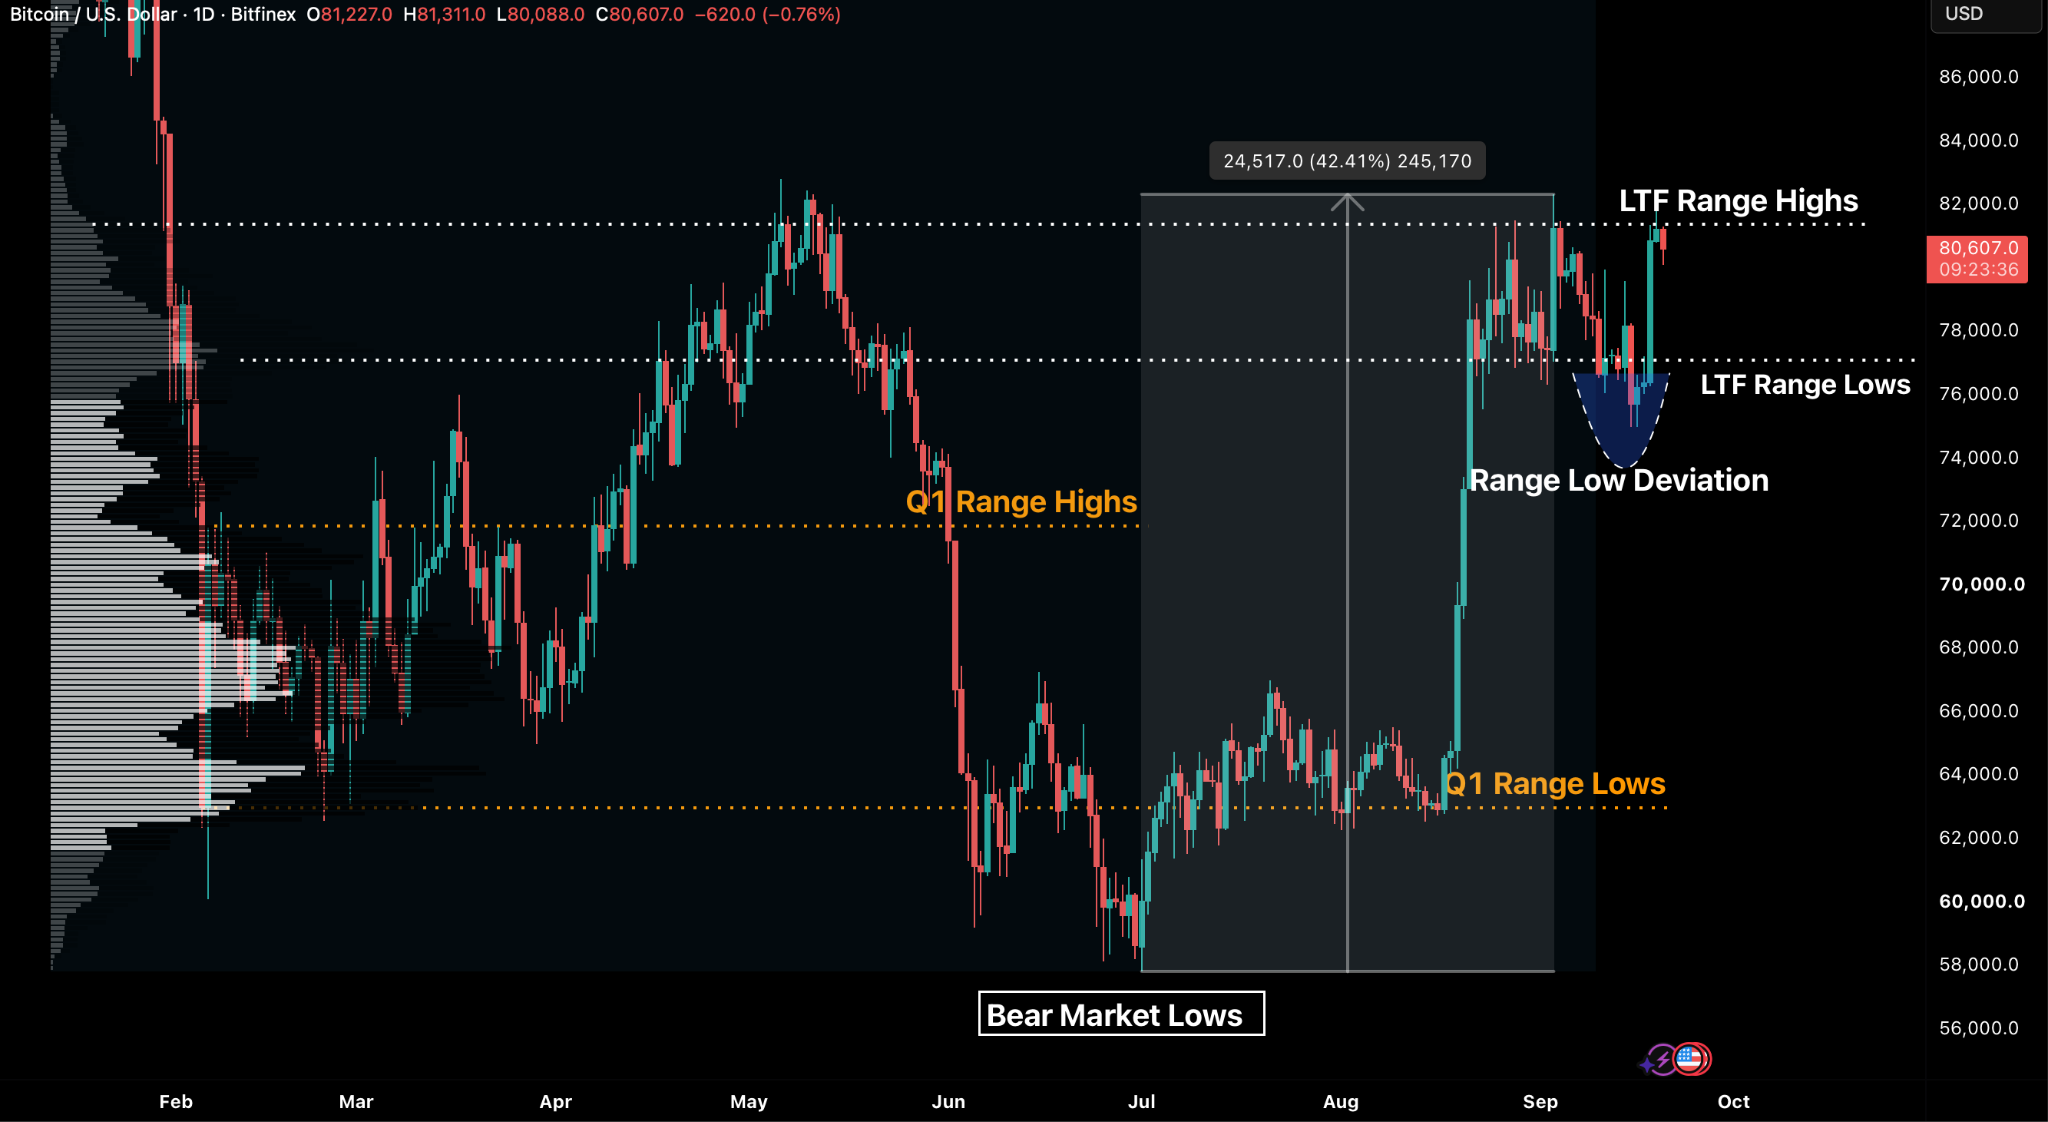
Bitcoin has recovered from last week’s rate hike and broken above the $77,100-$81,300 range that had constrained price throughout much of September. A 5.9 percent rally on 18 September, supported by $433 million in US spot exchange-traded fund (ETF) inflows the same day, reclaimed the previous $77,100 support and pushed BTC back towards $81,300 resistance. BTC then broke above that level and extended the move towards $85,000 on 21 September. Spot buying has driven the recovery, but selling near investors’ purchase prices continues to limit follow-through. Purchase disclosures today by Strategy and Strive, however, offer an early sign that corporations may be starting to re-engage, following a sharp slowdown over the past quarter.
The macroeconomic backdrop remains challenging. The Federal Reserve raised rates to 3.75-4 percent, with projections pointing to another increase this year and inflation returning to target only in 2029. Heavy government and corporate borrowing adds pressure on bond yields, suggesting credit could remain expensive even after rate increases stop. At 2.68 percent, the 10-year inflation-adjusted Treasury yield also raises the opportunity cost of holding assets such as BTC that pay no income.
Meanwhile, strong spending figures conceal growing household pressure. August retail sales rose 1.2 percent, including gains beyond fuel, but higher energy costs are squeezing purchasing power as consumer confidence weakens. This leaves the Fed facing resilient demand even as some households struggle with rising living and borrowing costs.
Our previous base case had BTC trading between $77,100 and $81,300. BTC has now broken above that range and moved towards $85,000. Sustained ETF inflows, fresh spot buying and expanding open interest would provide further confirmation that the breakout can be sustained.

Market Signals
BTC Breaks Above Range as $85,000 Comes into Focus
Bitcoin has rallied despite the odds. After losing its previous 20-day range floor of $77,100 early last week, dropping to as low as $74,985, it jumped 5.9 percent on 18 September alone, its biggest one-day increase since 21 August as $433.0 million entered US spot Bitcoin ETFs on the same day.
The rally followed new rulemaking by the Securities and Exchange Commission (SEC), removing restrictions on tokenised trading of US equities, despite the Clarity Act failing to advance in Congress and a rate hike that appeared to have been largely priced in.
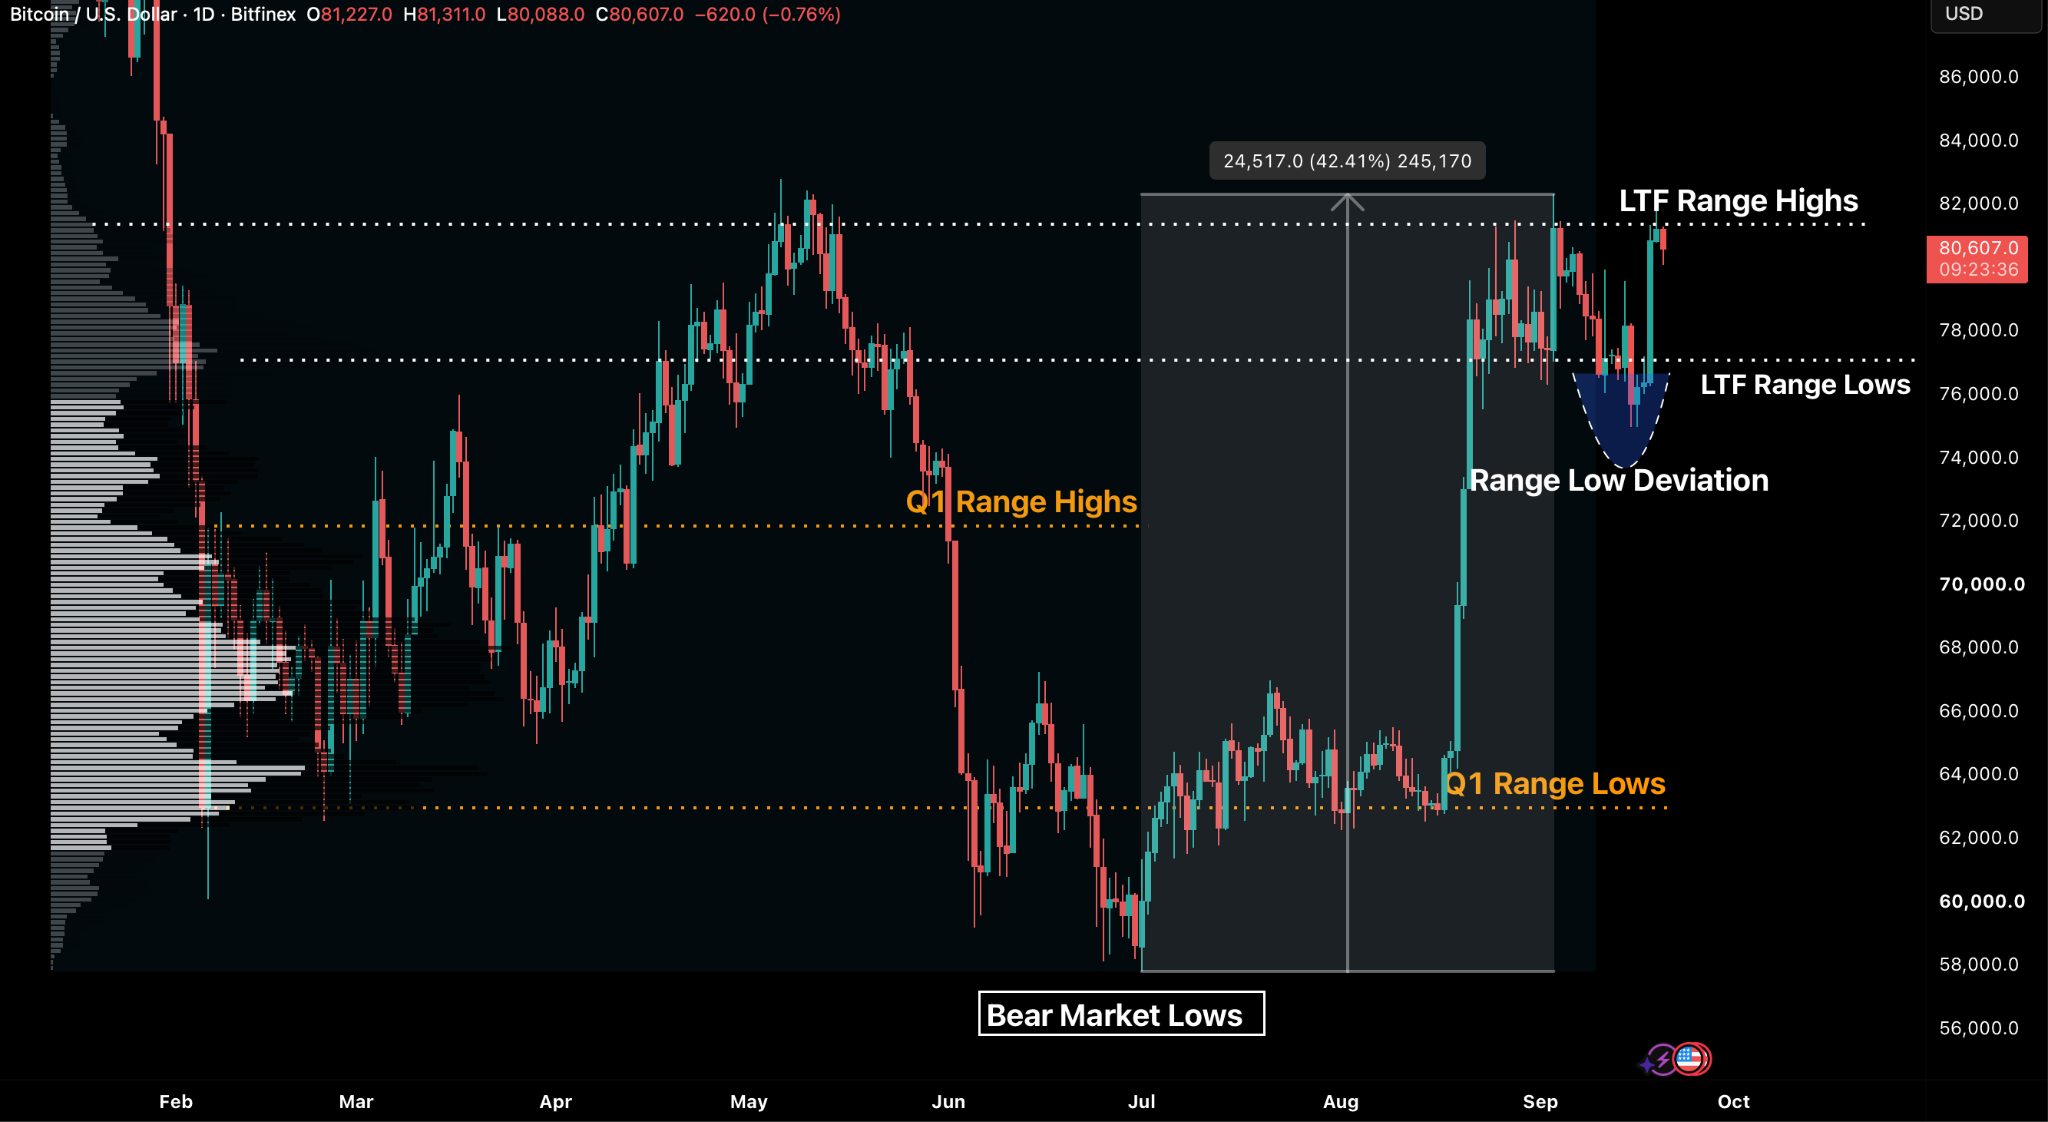
The uptick in price was driven primarily by spot market demand. Open interest in coin-notional terms decreased as prices climbed, while funding rates remained neutral. The data suggest that the open interest decline was driven by perpetual longs closing into the move higher as well. BTC is now trading above $81,300 resistance, which is the top of the volume value area, where an estimated 1.23 million of BTC has accumulated and is near or above breakeven. This marks our current range ceiling and is also the same level that halted BTC’s previous move higher on 3 September.
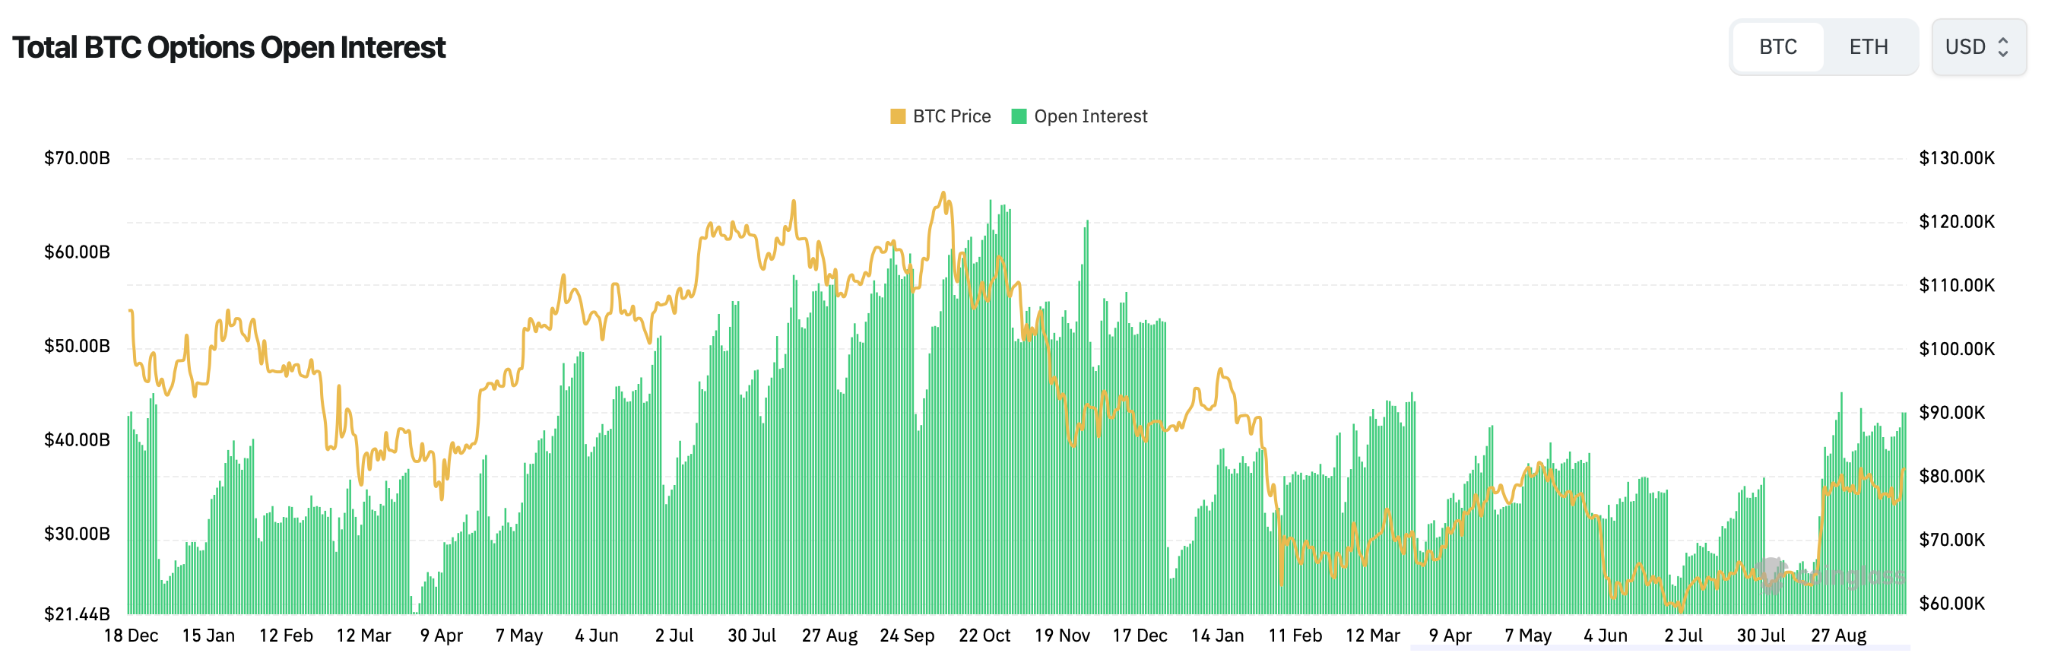
The difference between then and the current trading environment is that open interest on perpetual and futures trading pairs is more muted. Options positioning is more bullish, with the average premium on calls being the highest it has been all year, while options open interest on BTC is at a 2026 high in the $42.8-$43.2 billion range (see Figure 2 above).
Who Holds Bitcoin, and at What Price
The True Market Mean, which measures the aggregate cost basis across active market participants, currently stands at $76,677. After dipping below this benchmark on 15-17 September, the subsequent move in spot prices to above this level on 18 September returned the typical active market participant to profitability.
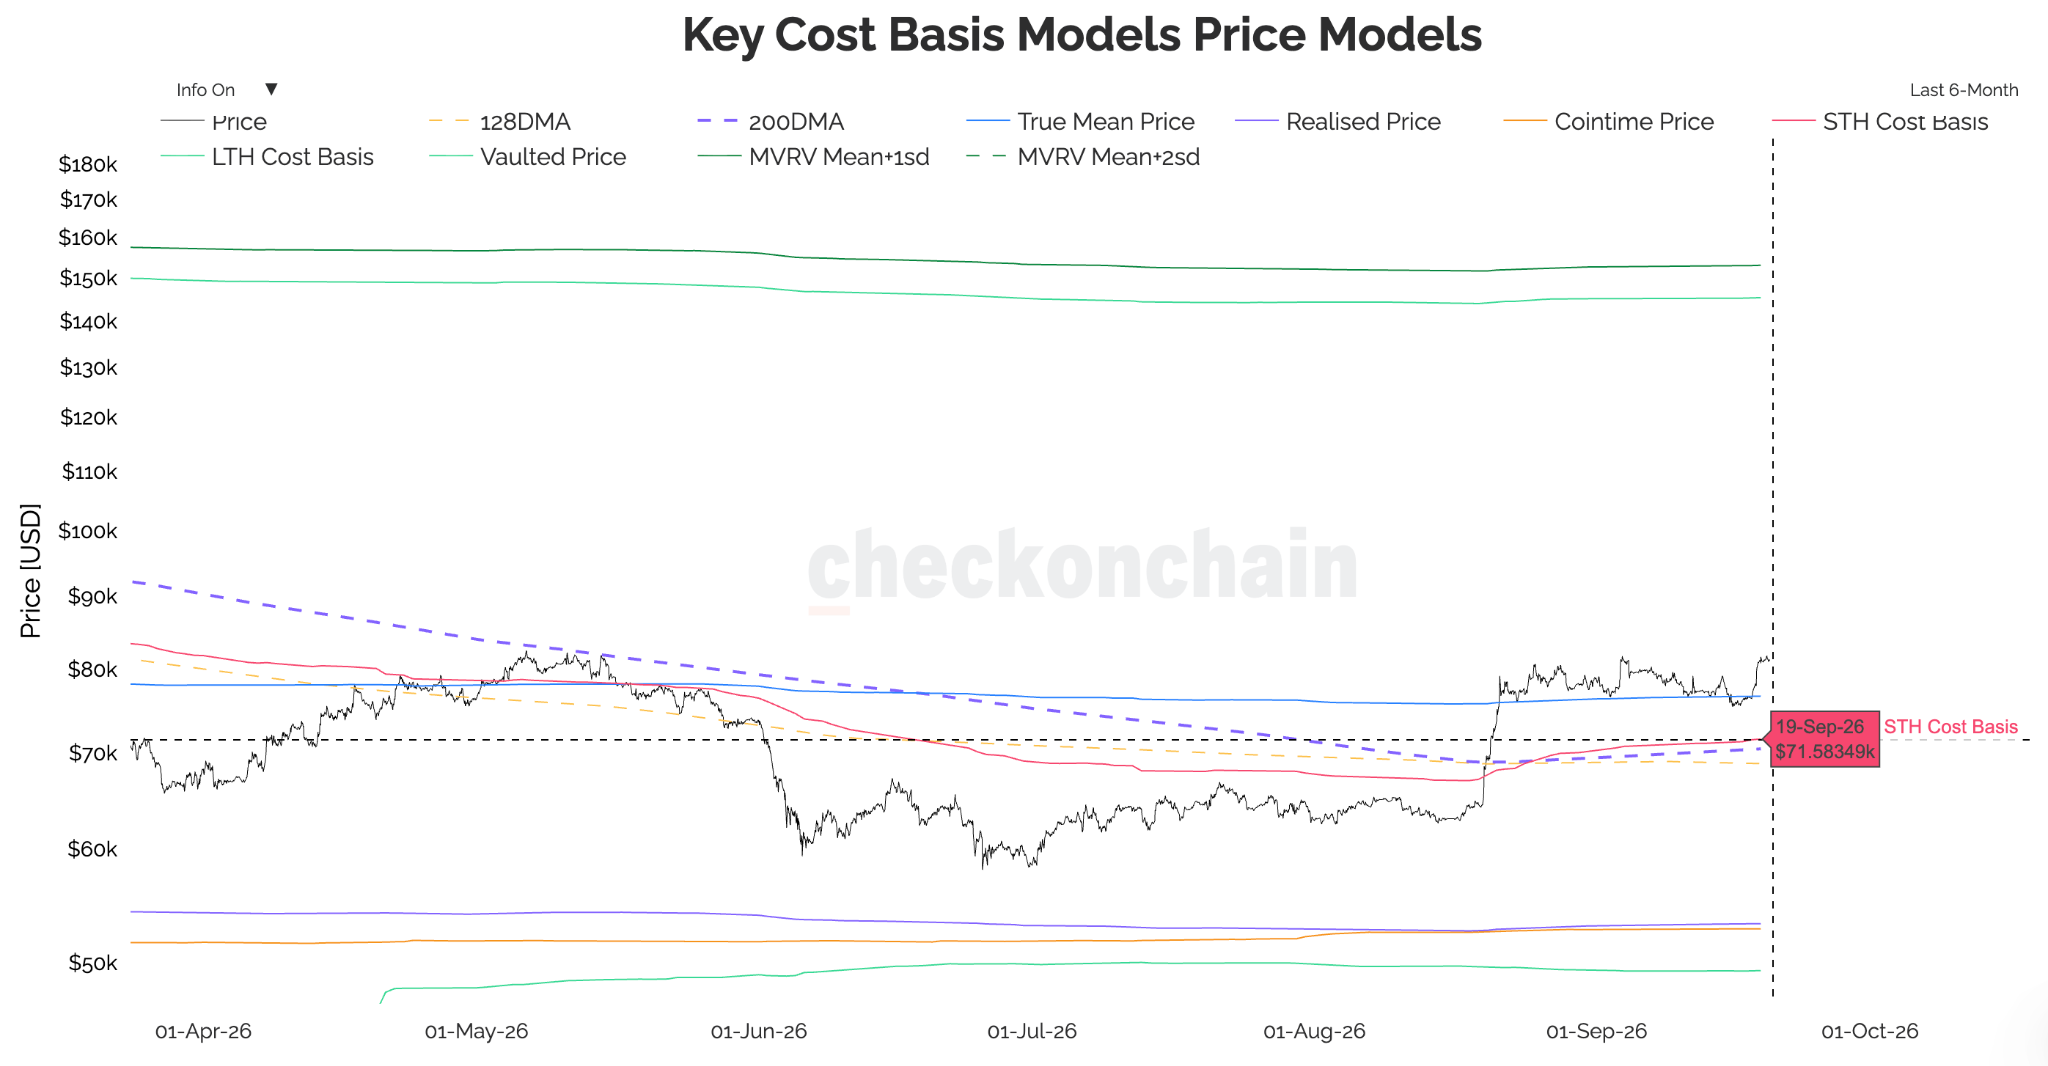
The cost basis for short-term holders — those holding coins for under 155 days — currently stands at $71,600, up from $71,300 on 16 September. The increase indicates that, on aggregate, the average STH is continuing to buy at higher prices or have sold at lower prices, moving the average higher.
With BTC’s range now moving above $81,300, this cohort holds an unrealised gain of over 13 percent. However, that figure masks critical supply dynamics that still remain in play. Our 16 September Intelligence Update highlights roughly 1.23 million BTC accumulating in the $77,100-$81,300 bracket throughout the prior month. At well over $81,300 currently, and with a significant amount of buyers above breakeven, we are at a a threshold where market participants frequently distribute inventory.
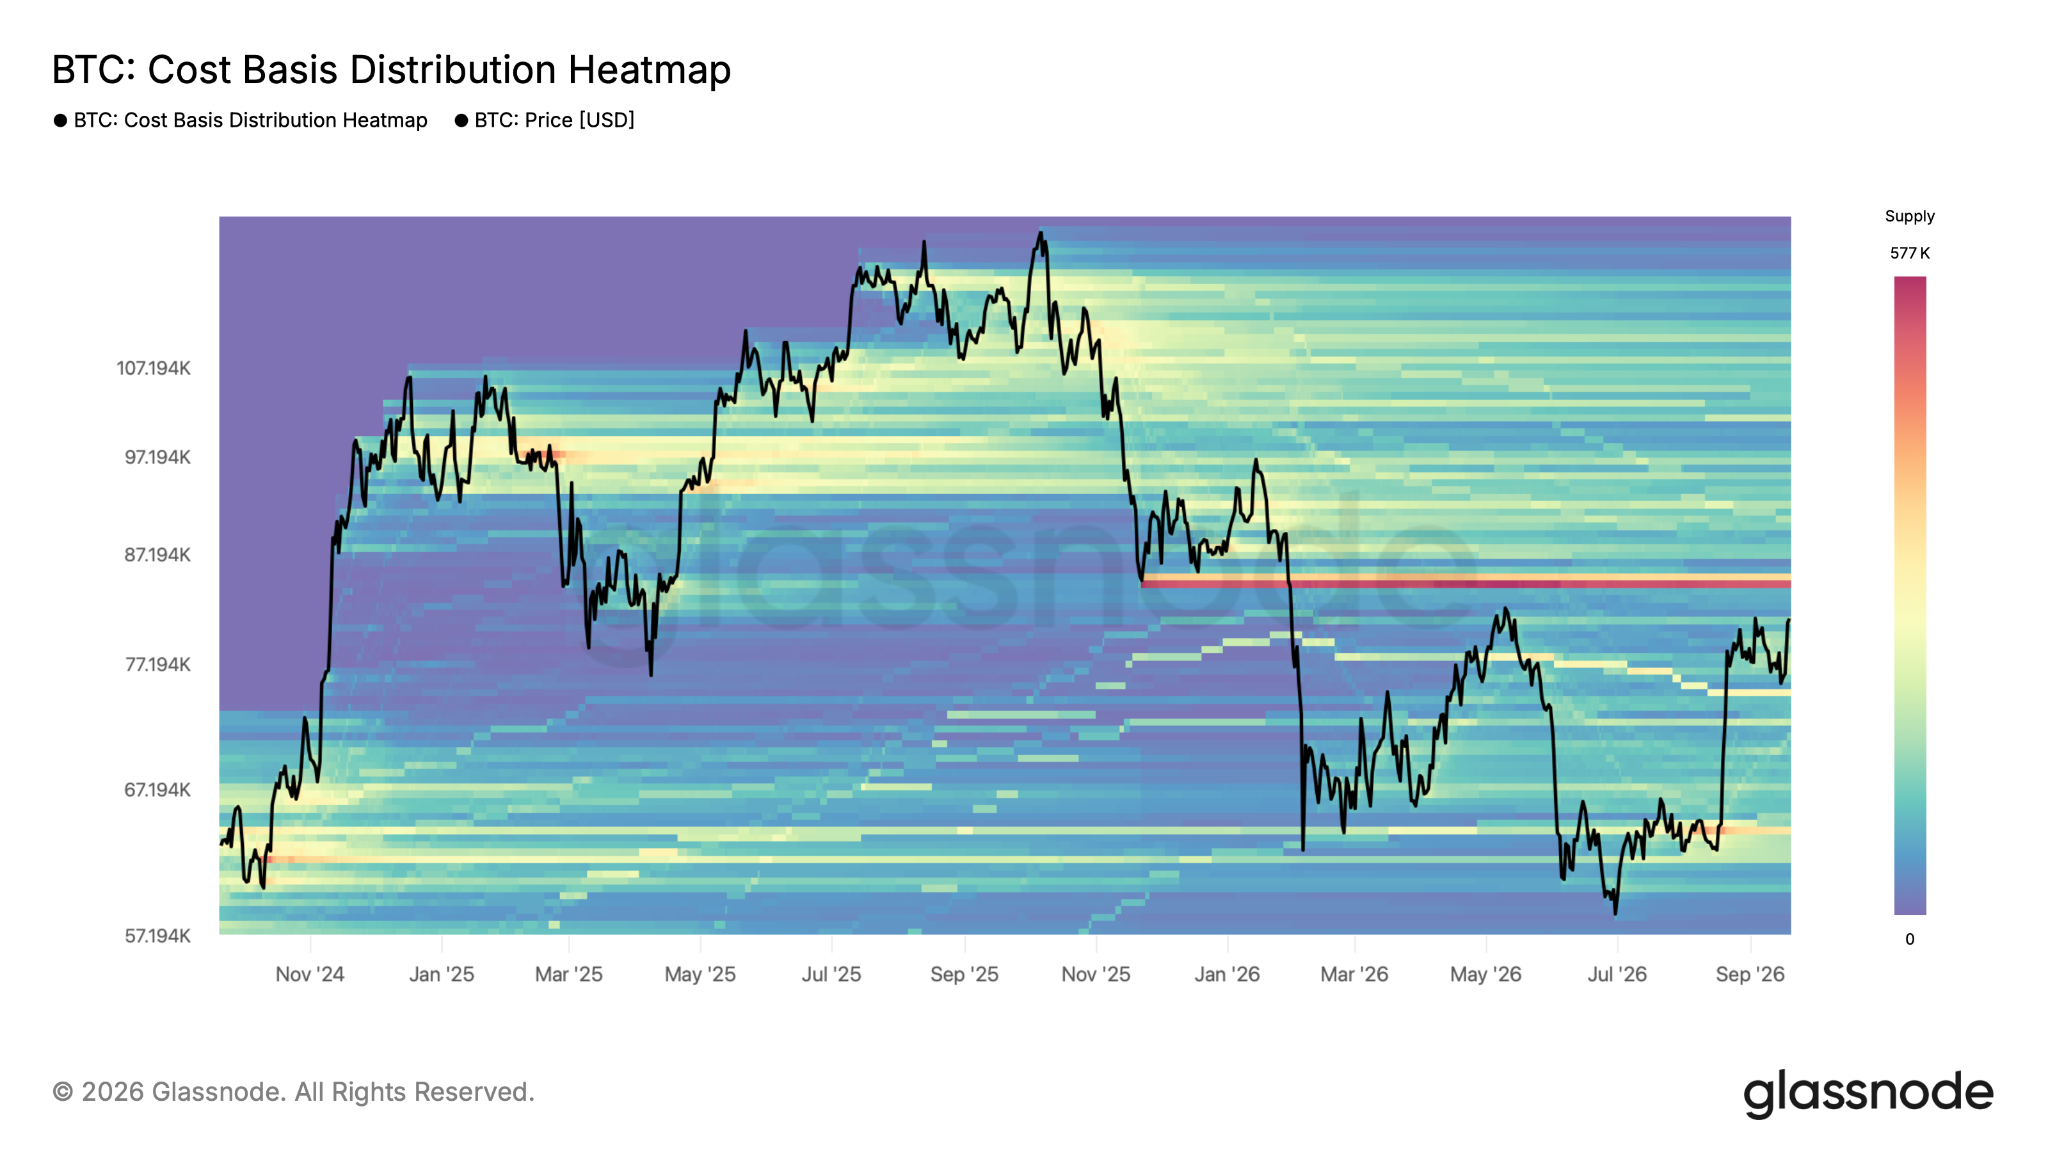
We saw similar breakeven selling by February and March buyers who capped gains at the same overhead level during our 3 September test of the range highs.
What sets current market structure apart — even from the May advance above $80,000 — is the cushion beneath current prices rather than just the overhead supply. The current volume value area is much wider at $77,100 to $81,300. When we visited the $80,000 region in May, the short-term holder cost basis hovered near $80,000, leaving the broader cohort underwater on any slight correction. At present, a retracement toward $77,100 maintains an estimated eight percent profit margin for more recent buyers given the Short-Term Holder cost basis is currently at $71,300.
Market Structure is Constructive
An examination of Bitcoin’s Spent Output Profit Ratio (SOPR) data corroborates this distribution data. This metric tracks realised profit and loss. Any move above 1.0 on the ratio represents the degree of realised profit, any move below 1.0 represents the degree of realised loss. Adjusted SOPR (aSOPR) strips out intra-hour transactions (see Figure 5). On 18 September, adjusted SOPR registered 1.02 aggregate, indicating that transacted coins realised approximately two percent gains during the test of the range highs.
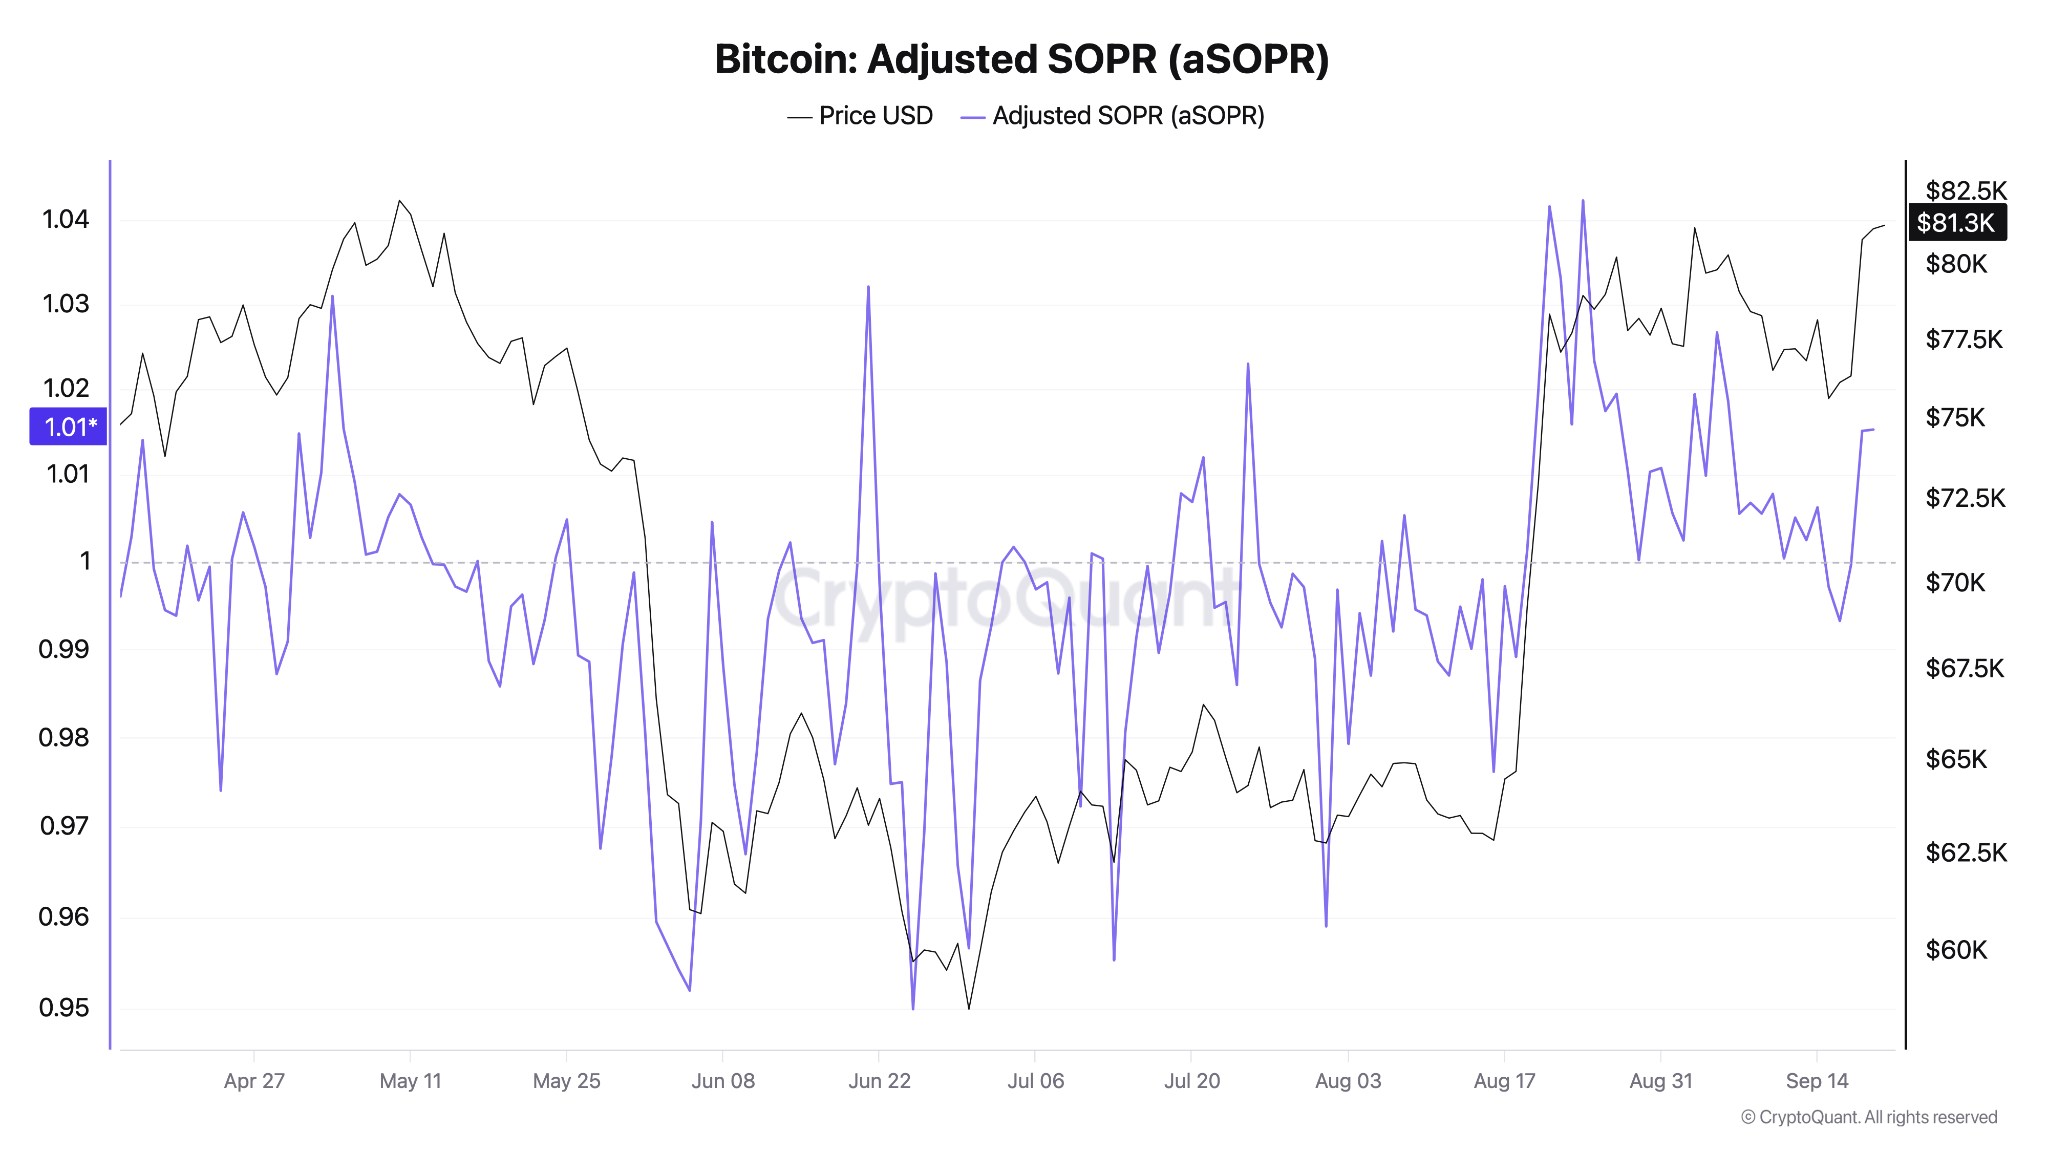
That this metric remained so close to unit value during a 5.9 percent rally demonstrates that market participants primarily distributed inventory near breakeven. This comes after the adjusted SOPR metric went under 1.0 when price broke below the range lows, showing that August buyers were liquidating at minimal profit.
Two potential metric shifts now warrant attention. Persistent readings above 1.02 on aSOPR, while price is capped below $81,300, would indicate continued distribution into range resistance. A return below 1.0 at current levels would signal seller exhaustion.
Despite increased price volatility leading into and beyond the FOMC rate decision, the underlying market mechanics governing moves have largely remained the same. The same narrow 5-6 percent price range that had confined price earlier continues to be relevant simply because of the large BTC supply concentration at these levels.
The market still awaits a sustained change in taker aggression, particularly on the bid side as that would be the catalyst for a range breakout, notwithstanding a successful reclaim of the range floor of $77,100 following a failed breakdown. Historically, the odds of a range breakout (if price has entered that range after an uptick in price) increases after a range low deviation, such as the one we have seen attempted today. For the time being, bearish macro catalysts have failed to push risk assets lower.
Derivatives Positioning is Also Constructive
Liquidation heatmaps further support the interpretation provided by the SOPR data and supply distribution data.
A prominent concentration of positions persisted near $81,500 between 3 September and 18 September, dissolving once spot came close to the zone over the past week. Total short liquidations recorded on 18 September exceeded $562 million, with BTC trading pairs accounting for $259.2 million. This was marginally higher than the number of short liquidations recorded on 3 September and the highest since our August breakout, which saw the largest single day BTC short liquidation in history on 19 August.
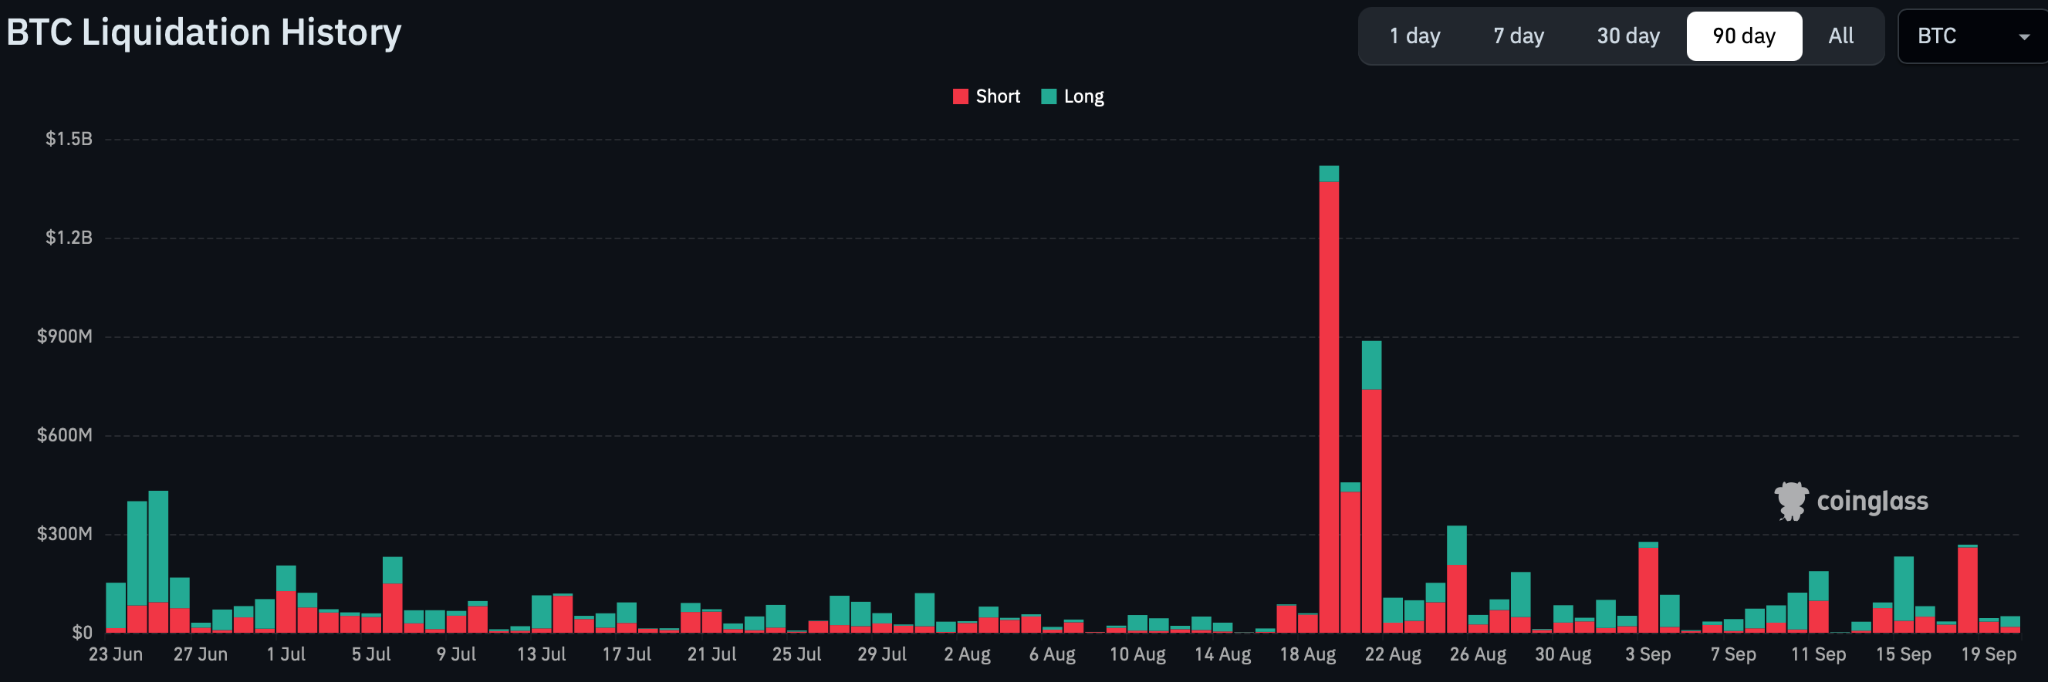
The derivatives position clusters at the end of last week were thus a “magnet” for price, but also proved to be resistance as there was no sustained aggressive buying on spot to push beyond the range highs. The move higher was also cut off by a combination of profit-taking, as well as an end to the forced buying brought upon by the short liquidations on 18 September.
Remaining overhead liquidity has cleared significantly. The primary liquidity concentration now lies beneath current valuations, spanning $73,800 to $75,000, with the single densest node representing $193 million. The strength in the market would be tested by how well BTC defends the range lows now on any pullbacks and avoids a move down to those clusters. However, if a loss of the range lows does take place, our base case remains that this would signal a larger range bound movement as long as price-agnostic spot buying does not enter the market to catalyse a breakout above the current range highs.
Consequently, an upward break past $82,320 benefits from less forced buy-side liquidity than witnessed during the 18 September advance.
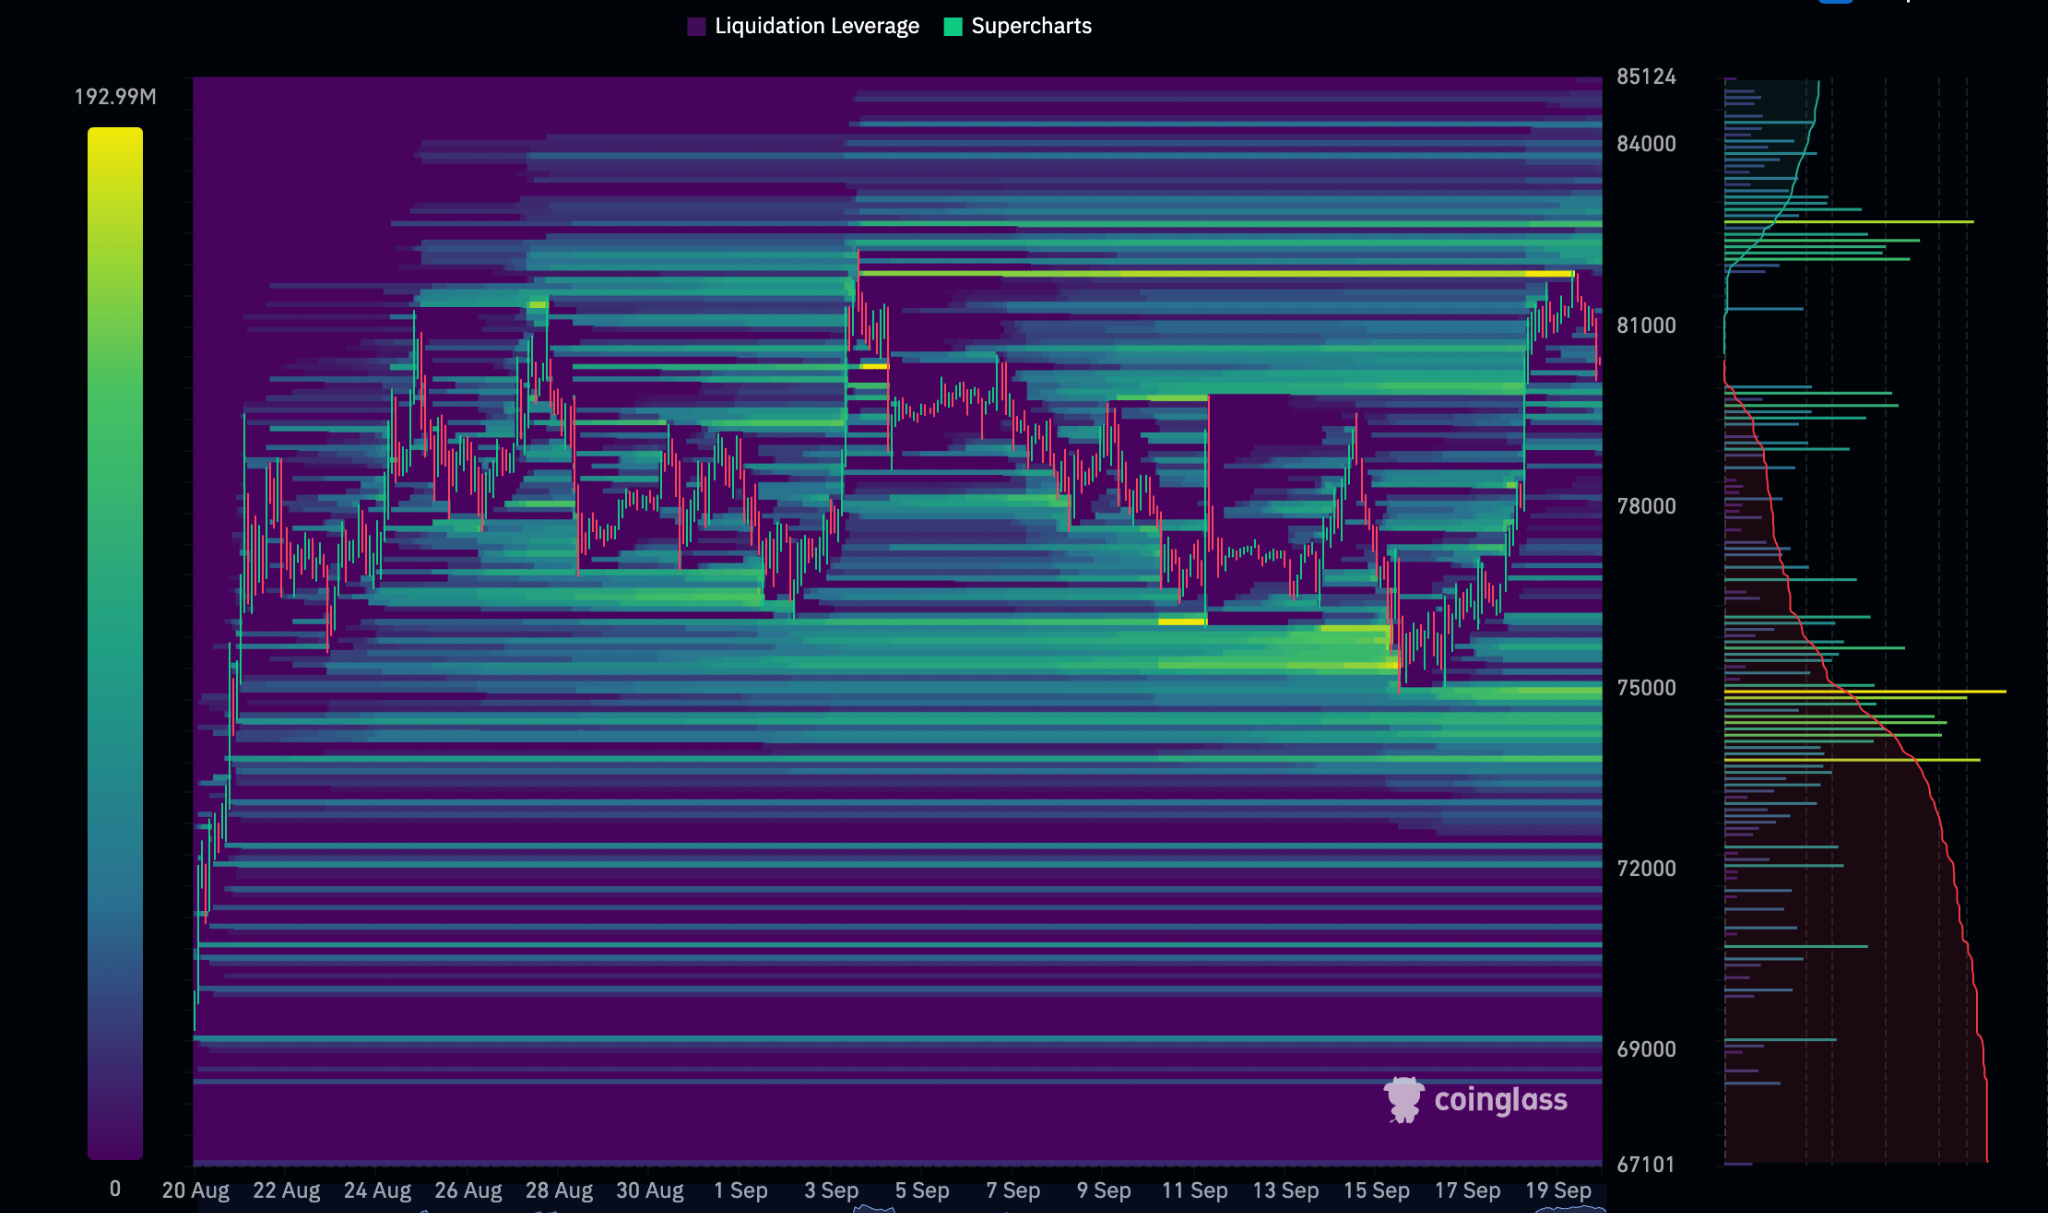
Overhead supply thins progressively as we reach deeper into the $80,000s, providing a clearer path higher should spot secure a daily close above $81,300. The $80,000–$82,500 zone contains roughly 252,000 BTC per $1,000 interval, before thinning dramatically to 62,000 BTC per $1,000 between $82,500 and $84,000: a liquidity void capable of rapid traversal. Higher up, the $84,000–$85,500 band holds 773,000 BTC, anchored by the $85,000 node containing 298,000 BTC, the densest supply concentration between $68,000 and $90,000. The first major test for BTC’s uptrend currently would be this node given the confluence of multiple resistance zones overlapping at this price level. Furthermore, this would also be approximately a 50 percent recovery off the bear market lows.
Historically, BTC bear market rallies are differentiated from recoveries that transition into a new bull market by this 50 percent threshold. Price increases of this magnitude and higher typically denote the beginning of new bull markets rather than bear market recoveries that are eventually capped off.
Below current spot values, Strategy also retains 846,00 BTC at an aggregate cost basis of $75,416 per BTC, as detailed in today’s SEC filing, having acquired 950 more bitcoins over the last week. The recent dip to $74,985 briefly placed this corporate treasury position underwater.

Outlook For The Week
Our base case over the past several weeks had been Bitcoin remaining bound between $77,100 and $81,300. Our overall bias currently post the range low deviation remains a sustained breakout above the $81,300 range highs, which is already in motion at the time of writing.
The first major test for BTC’s current uptrend is the $85,000 resistance level. That could potentially be a litmus test for whether this entire move since the mid-August breakout and even since the 1 July bear market lows has been a bear market recovery that eventually reverses or whether this is a move that marks the beginning of a new bull market.
While spot demand powered the 18 September recovery and the follow-through towards $85,000, some metrics that typically denote sustained strength remain noticeably absent.
Saturday’s trading volumes contracted to a third of Friday levels amid net selling pressure, while coin-denominated open interest reset to levels last seen on 3 September.
Looking back at 3 September, when we were last at these levels, a single session of aggressive buying encountered the same overhead barrier, despite greater ETF inflows and a lower real yield environment — 2.42 percent compared to 2.68 percent on 18 September — before stalling. As outlined in our macro chapters, elevated real yields present an ongoing headwind for non-yielding assets.
Price continuing to sustain above $81,300 accompanied by sustained ETF inflows would invalidate a range-bound thesis, clearing a path toward $85,000 filling out the liquidity and cost-basis air gap between the range highs and that level. For a breakout to be validated, we would want to see net taker buying rather than the profit-taking that capped the advances on 18 and 19 September.
Coin-denominated open interest would also need to expand, indicating fresh positioning rather than a move driven primarily by short covering. Conversely, a daily close beneath $77,100 invalidates the structure to the downside, exposing the True Market Mean at $76,677.
Within the established boundaries, key confirmation metrics include adjusted SOPR stabilising near 1.0, short-term holder exchange transfers remaining under 20,000 BTC daily and the 25 September options expiry passing without unwinding hedges driving spot distribution.
Could the Corporate Bid Return?
The two potential sources for price-agnostic aggressive taker buying on spot spawn from the dual demand engines for Bitcoin: the spot ETFs and the corporate treasury bid. While the ETF flows have gone from a streak of aggressive buying from mid-August through early September to alternating flows increasingly more correlated with the macro environment, corporate buy pressure had stalled after serving as an aggressive source throughout 2025.
Over the last quarter, net acquisitions by public corporations totalled roughly 5.9k BTC, a sharp deceleration from the 89k BTC absorbed during July 2025 alone. With the Corporate Treasury Cost Basis hovering at $80,500, this cohort had been largely underwater for a majority of 2026. With Monday’s move towards $85,000, this sector is finally in an unrealised profit on aggregate. Today’s disclosures by Strategy and Strive of having purchased 950 BTC and 1,355 BTC respectively meanwhile provides an early sign that corporate accumulation may be starting to re-engage. Since a lot of corporate buying depends heavily on mNAV values as well as certain product pricing — for instance STRC’s $100 peg is the threshold for BTC accumulation — this further opens the door for the corporate demand engine to become active accumulators again.
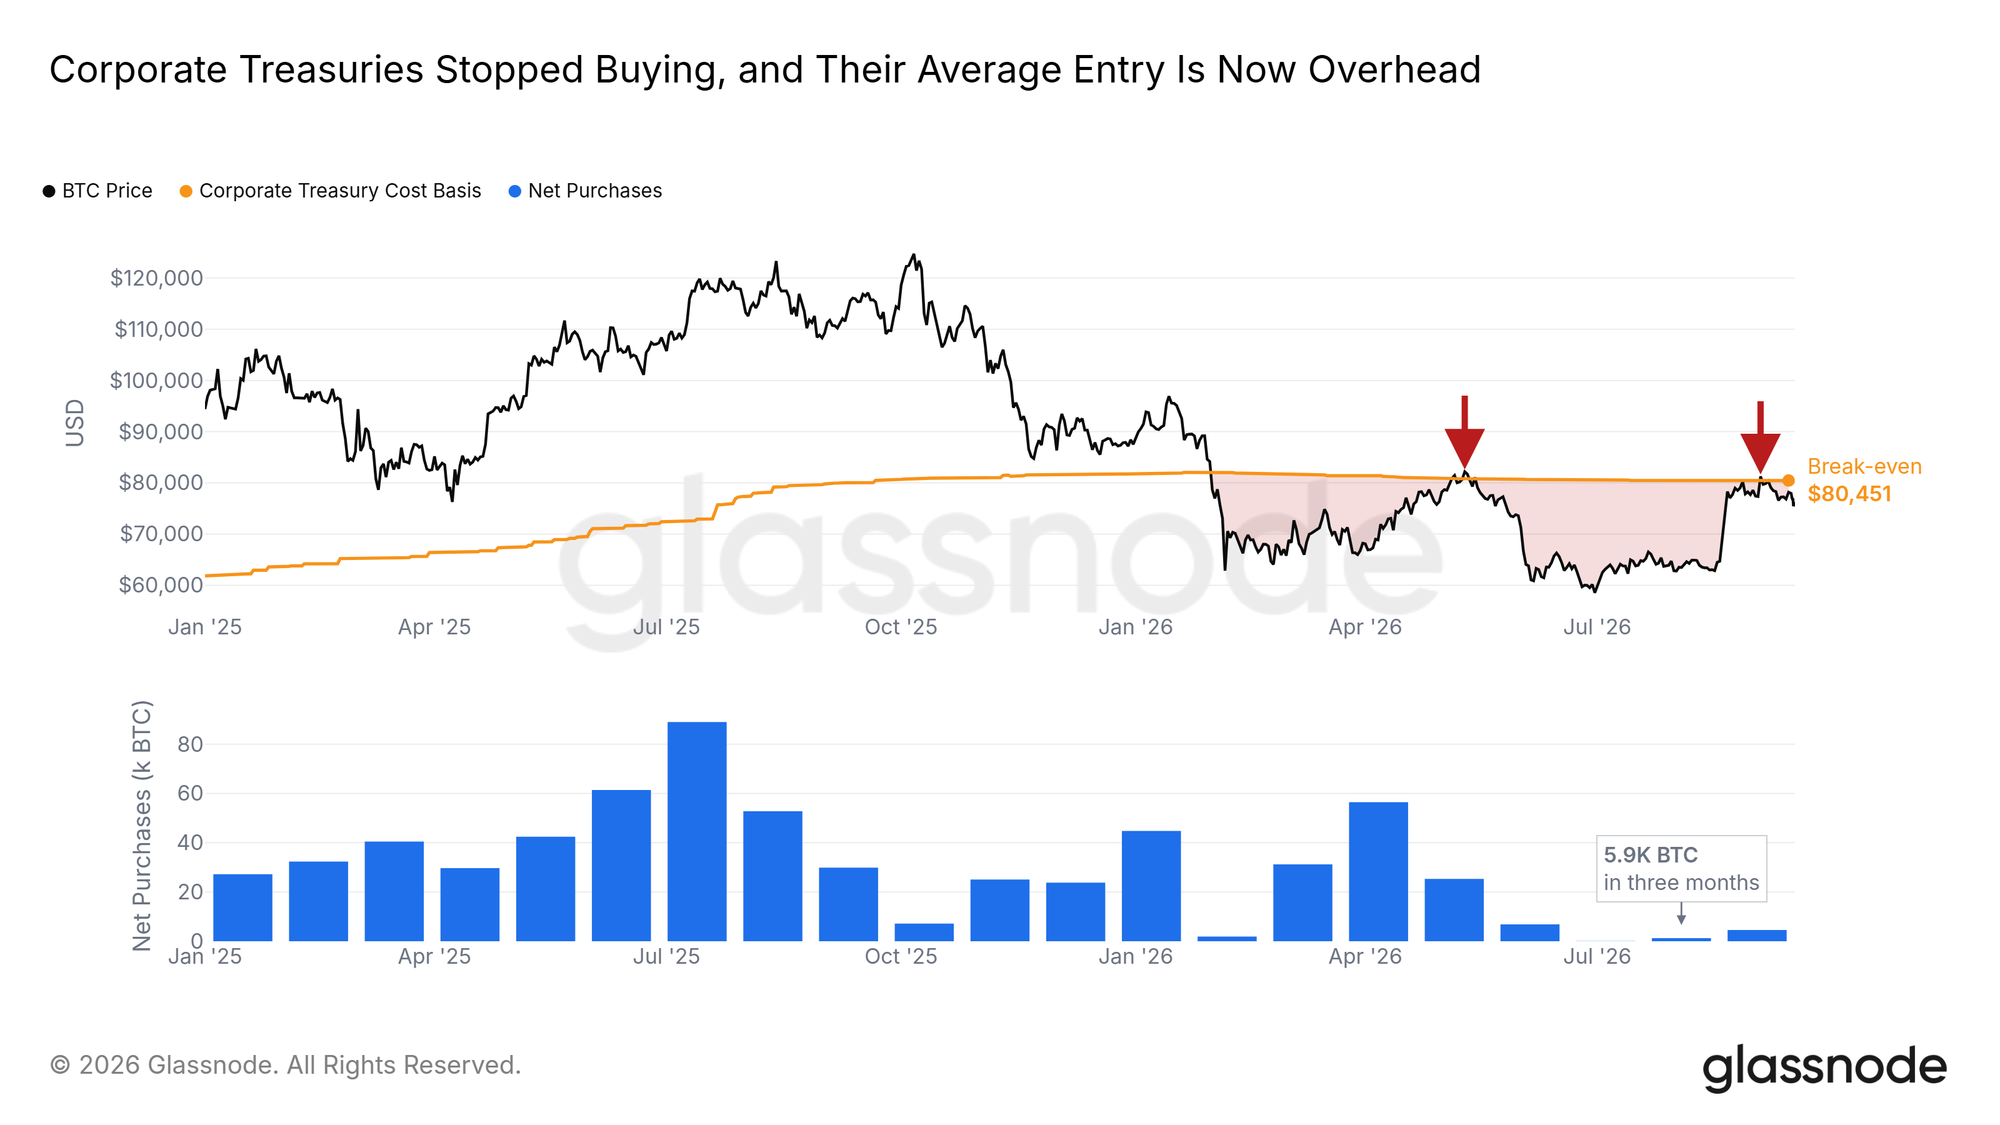
There have been no notable sales by these companies apart from marginal distribution from Strategy between late-June and August 2026 totalling $431.8 million in BTC. This has acted as resistance, by restricting how much fresh BTC price pressure comes in for this cohort as well as potential hedging activity that is not disclosed to the public. Since price first slipped below the Corporate Treasury Cost Basis in January 2026, BTC has re-tested the level twice — first in May, and subsequently on 3 September 2026 — rejecting on both occasions.
The recent move up in BTC will restore profitability to corporate balance sheets and alleviate overhead supply pressure, while opening the door to further BTC accumulation. How this plays out in practice would determine the potential re-engagement of price agnostic BTC buy pressure previously seen during 2025.
General Macro Updates
Fed Tightening and Rising Debt Supply Raise the Cost of Capital
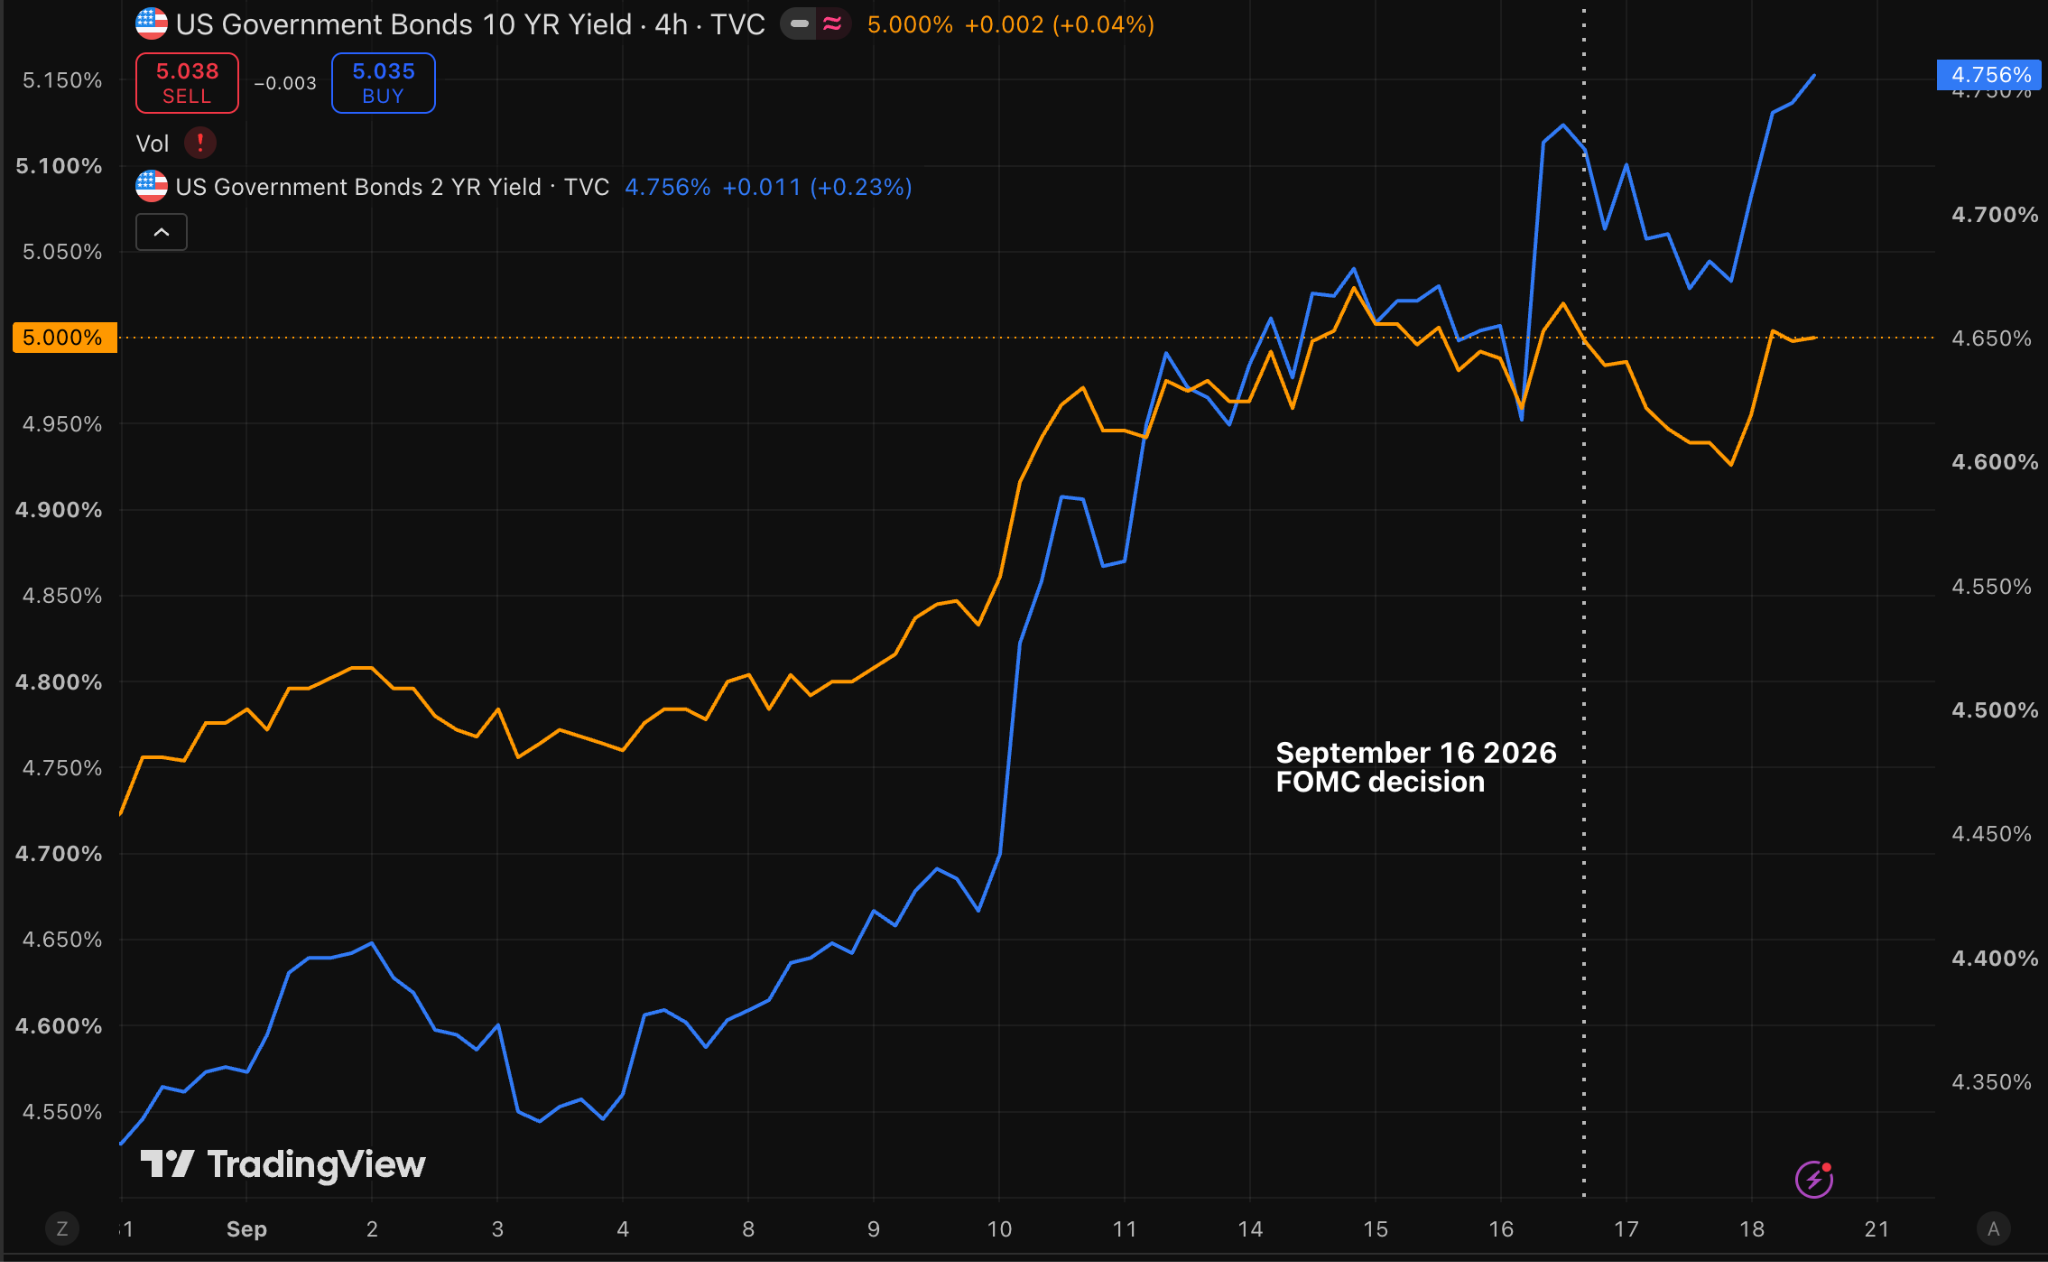
The cost of capital is rapidly rising across every tenor in the bond market. Following the Federal Reserve’s decision to raise interest rates last Wednesday 16 September, the benchmark 10-year Treasury yield closed at 5.01 percent and maintained that level for the rest of the week. The 2-year yield, which is highly sensitive to policy expectations, closed the week at 4.76 percent, up 37 basis points from its level on 8 September, while the 30-year long bond yield is up nine basis points. The much anticipated quarterly Summary of Economic Projections, which reflects the view of each member of the Federal Open Market Committee (FOMC), on growth, inflation, unemployment and the policy rate, also suggests that there is further tightening to come.
While the Fed is focused on inflation and employment as its core mandate in determining monetary policy, ongoing heavy government and corporate borrowing is another reason why long-term yields are elevated and will likely remain so.
The Fed Signals More Than One Increase
The rate hike decision was expected. The guidance that came with it mattered more however, particularly given the Fed’s explicit reference to inflation, which it said ‘remains elevated’, and its statement that the hike will support a ‘timelier return’ to the 2 percent goal.
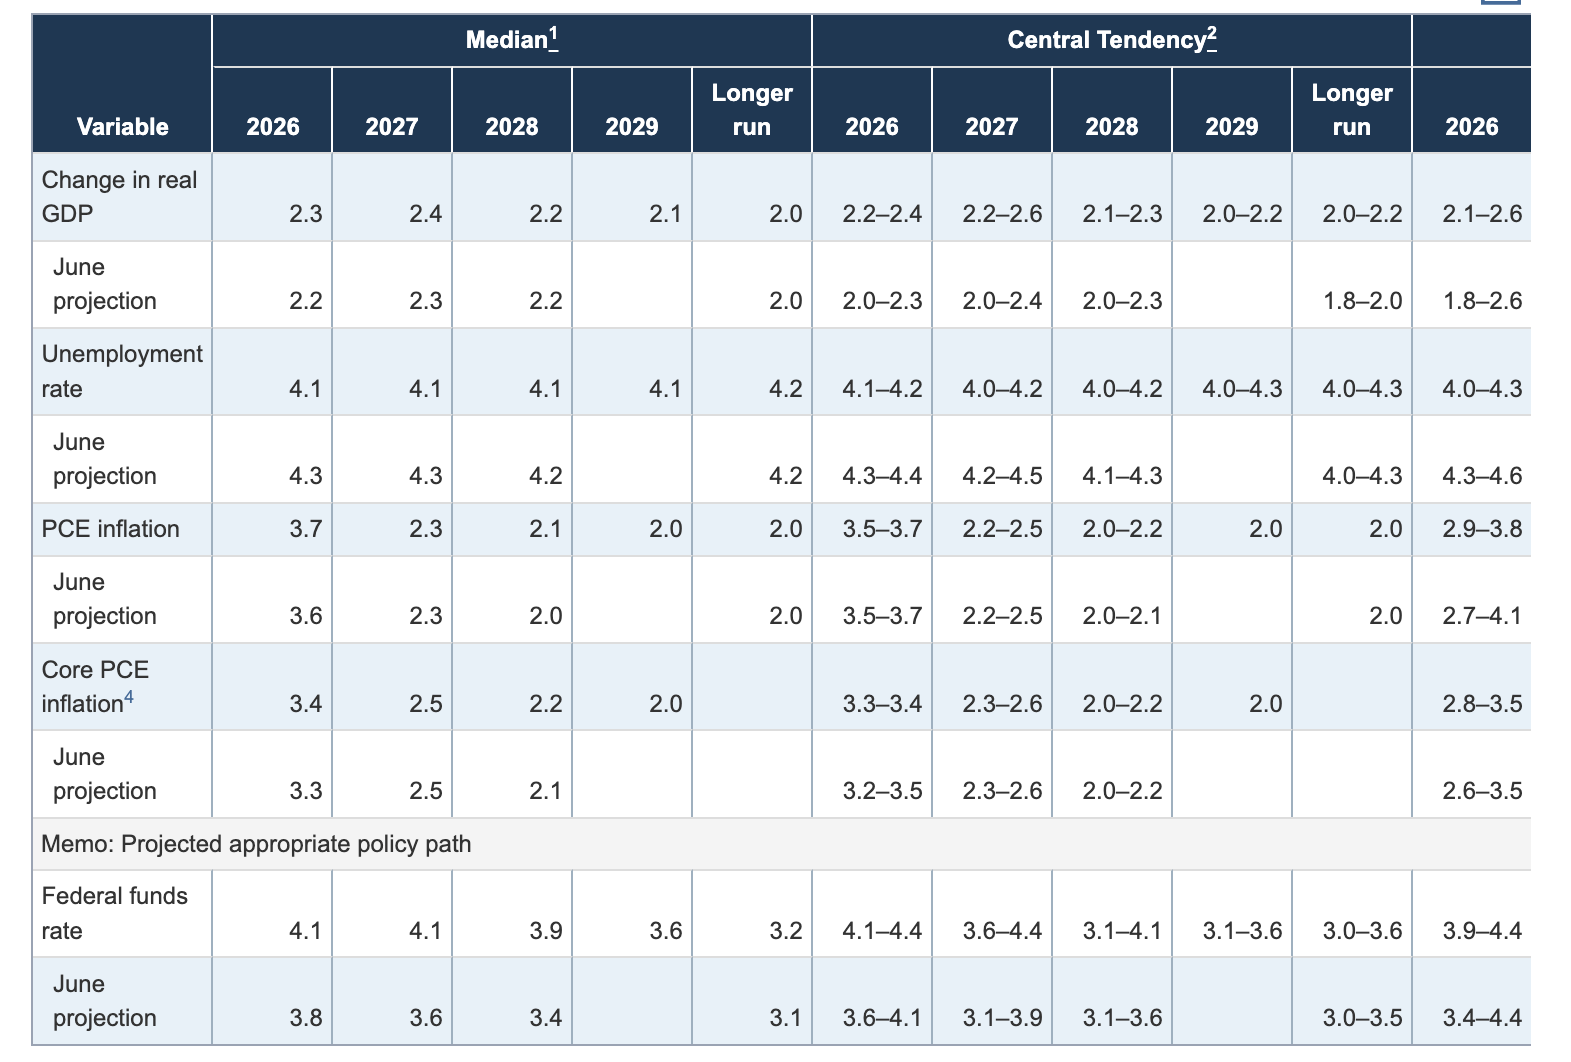
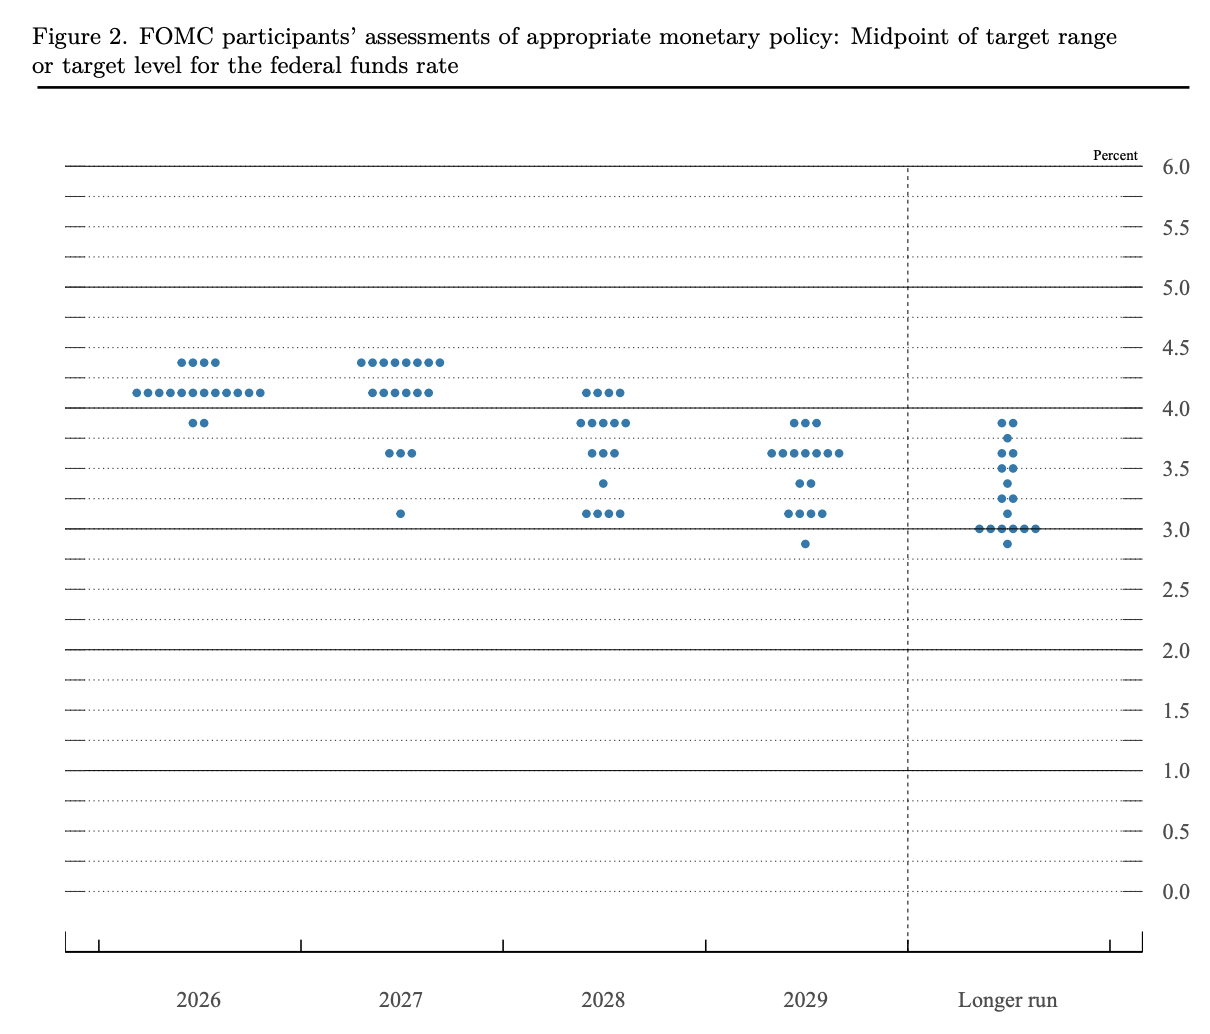
The dots in Figure 11 below represent the individual rate forecasts of each FOMC member. The committee’s median projection (see Figure 10 above) puts the policy rate at 4.1 percent by the end of 2026, up from the 3.8 percent that was projected in June. This is squarely in line with what a 25 basis point increase would deliver from the current target range of 3.75-4 percent. Into next year, median expectations remain at 4.1 percent. This masks the fact that eight of the 18 officials on the committee actually see a higher rate in 2027 (see Figure 11 below), notwithstanding the fact that these forecasts are conditional on prevailing economic conditions at the time and not a fixed path. Our read is that last week’s hike is one of a sequence that we should expect.
Inflation Returns to Target Only in 2029
The Fed is tightening into an economy it expects to stay strong. Projections show gross domestic product growth of 2.3 percent in 2026 and 2.4 percent in 2027, with unemployment at 4.1 percent in every year through 2029, lower than its expectations in the June SEP of 4.3 percent unemployment for 2026 and 2027. Inflation measured by the Personal Consumption Expenditures (PCE) Price Index is projected at 3.7 percent this year and core PCE, which excludes food and energy, at 3.4 percent.
These projections contrast with last week’s statement, wherein it was suggested that the hike would bring a “timelier return” to 2 percent inflation, even as it raised its 2028 inflation projection to 2.1 percent from 2 percent in June. Headline and core PCE inflation are now projected to reach the 2 percent goal in 2029, a year later than the committee expected three months ago. A central bank that raises rates and still pushes its target date back is signalling to markets that policy will stay restrictive for longer.
Treasury Borrowing Adds Additional Pressure to Yields
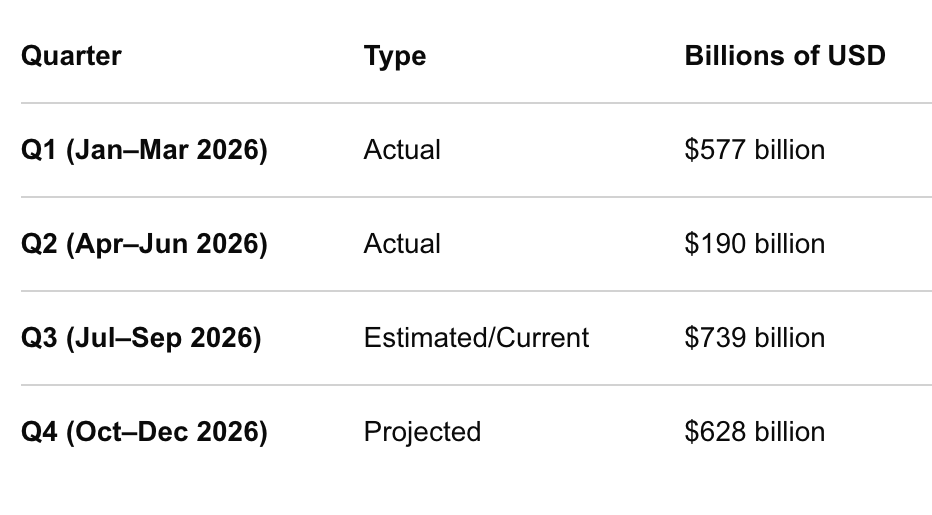
Government financing needs are also pushing yields higher. In its August borrowing estimates, the US Department of the Treasury projected $739 billion in net borrowing for July-September, followed by $628 billion in October-December. This total of $1.367 trillion in net borrowing represents new debt that must find a buyer and has a direct impact on yields.
Corporate borrowing also adds to the pressure. US companies issued $1.899 trillion in bonds in the first eight months of 2026, 29.8 percent more than in the same period of 2025. This was fuelled by an artificial intelligence (AI) infrastructure build-out that requires heavy spending on data centres and equipment. While steeper yields reflect the level of demand on capital, the productivity gains that are expected to come from greater deployment of AI are only going to arrive later. Today’s spending increases the cost of capital now, while the prospect of future AI-driven efficiencies provides little relief from current price pressures.

Households Keep Spending, but Fuel Takes a Larger Share
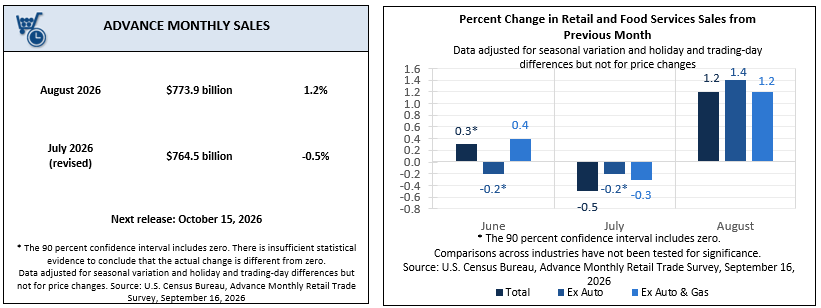
Treasury yields have also been impacted by rising retail sales that were up 1.2 percent in August. Released the day before the Fed decision was announced, the data was sufficient to push 2-year yields to 4.74 percent, up 10 basis points on the day. The main driver is rising fuel costs, which are taking a larger share of household budgets, with the impact being seen in lower food consumption and falling consumer confidence. Spending remains strong enough to keep the Fed raising rates, but this constitutes a problem for households already under strain.
Fed Tightens As Spending Continues
The August retail sales report gives the Fed no reason to pause. Retail and food services sales reached $773.9 billion, up 1.2 percent on the month and 6 percent on the year, after a revised fall of 0.5 percent in July. Consumer prices rose 0.4 percent in the same month, so the sales gain was not only an inflation effect. The strength was also broad-based. Sales excluding gasoline stations rose 1.1 percent and online and other nonstore retailers gained 2.6 percent. These figures support the Fed’s assessment that domestic spending has remained resilient.
Fuel Takes a Larger Share of the Budget
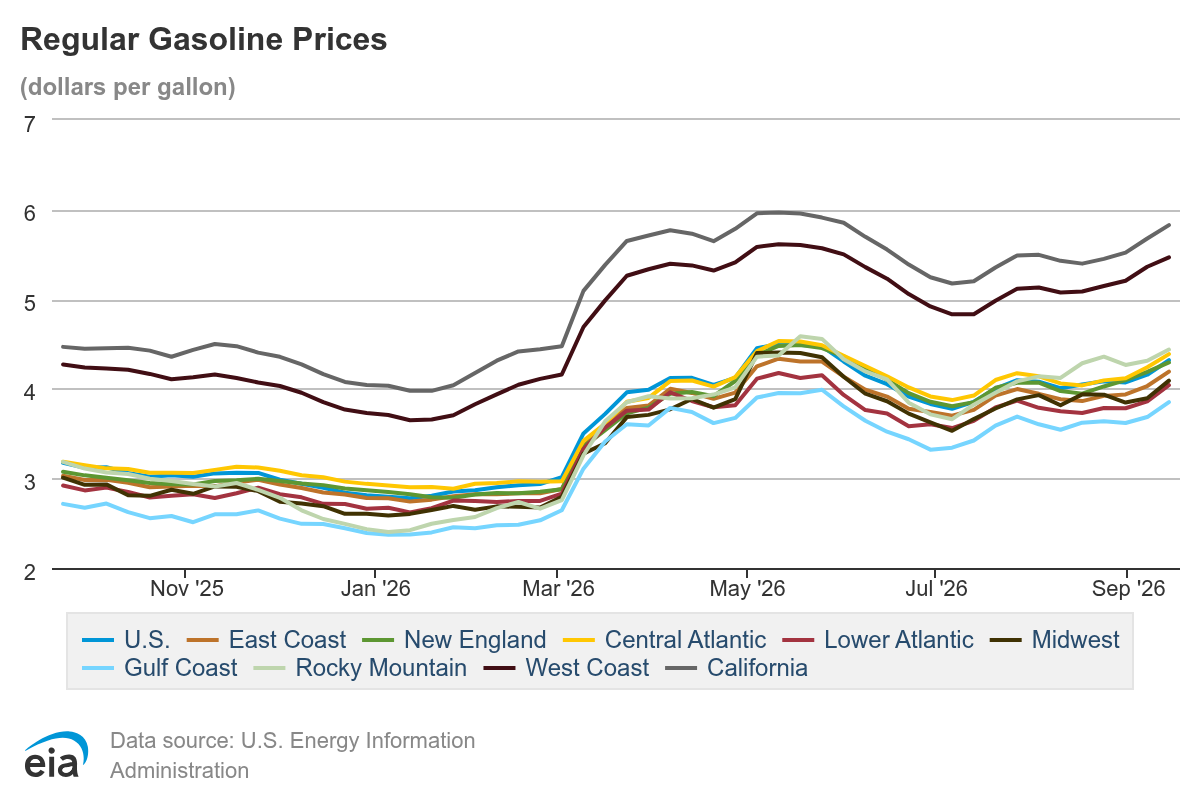
Households are paying more for fuel and receiving less of it. Sales at gasoline stations rose 3.1 percent in August and 21 percent on the year, while gasoline prices rose 27.4 percent over the same 12 months. When the dollar amount spent rises by less than the price, the implication is that households bought fewer gallons. They paid more for less fuel. Fuel also flatters the headline: excluding gasoline stations, annual sales growth falls from 6 percent to 4.9 percent.
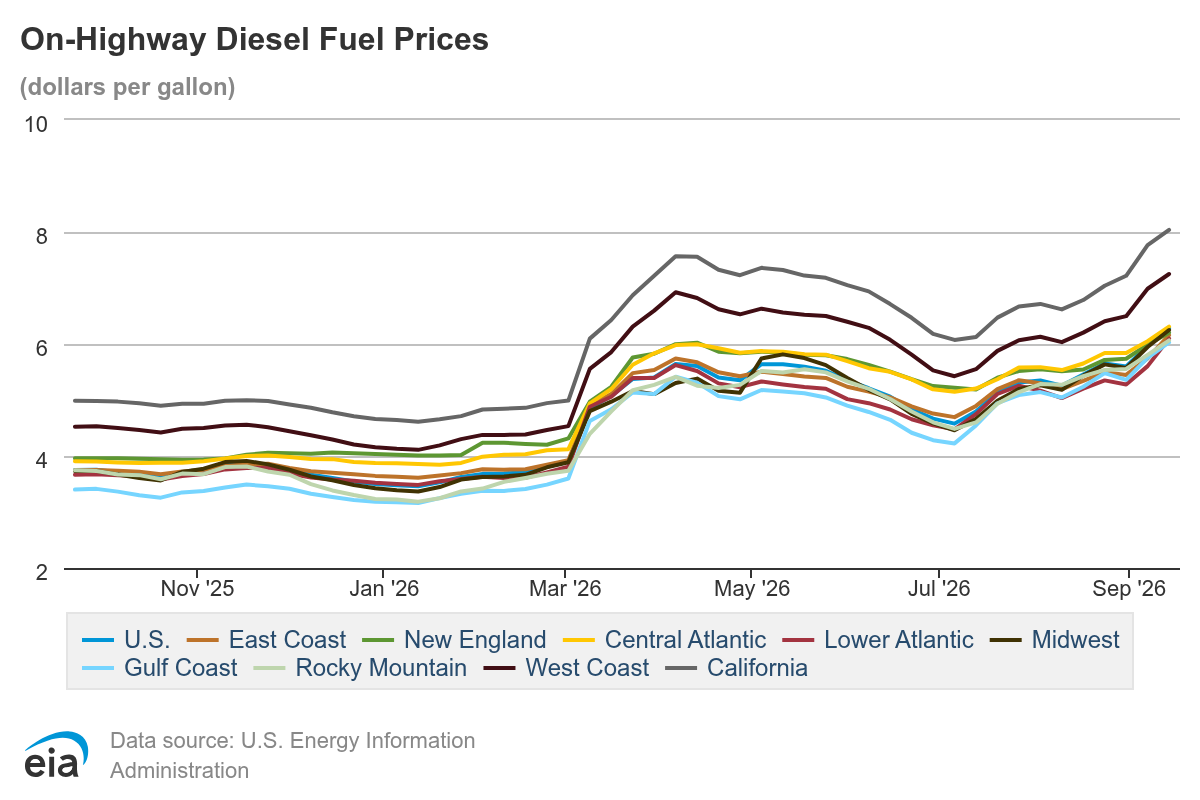
The pressure has grown since the August survey. Retail petrol averaged $4.319 per gallon on 14 September, up 16.2 cents on the week. Retail diesel averaged $6.285, up 31.8 cents on the week and $2.546 on the year. The test of whether the energy shock is easing is a fall in retail diesel below $5.50 for two straight weeks. It moved the other way. Given diesel is an input cost for food and freight, the increase will reach shop prices over the coming months and we expect September retail sales to carry an even larger fuel component.
Confidence Is Falling as Spending Holds
Sales at food and beverage stores rose only 0.5 percent on the year, while grocery prices rose 2.2 percent. This means households are taking home less food than a year ago.
Confidence data show the strain that the sales total hides. The University of Michigan’s preliminary September index of consumer sentiment fell to 47.8 from 51.7 in August, with the expectations component at 45.8. Year-ahead inflation expectations rose to 4.6 percent, while long-run expectations stood at 3.4 percent. Either fuel costs ease and confidence recovers, or the households now cutting back on groceries start to pull the spending totals down. The same household is paying more for fuel and taking home less food.
The Squeeze Arrives From Two Directions
The Fed takes an aggregate view of the data and this clearly indicates the necessity for further tightening. This will mean that lower-income households face higher fuel costs and higher interest rates together, however, since rate hikes pass quickly into credit card rates, and into adjustable-rate mortgages and home equity lines of credit for those who own homes. Policy will restrain demand, but it cannot lower the price of diesel. The likely result is a consumer sector that looks healthy in aggregate but is narrowing beneath the surface, with growth resting on a smaller group of households.

Outlook
Why This Matters for Crypto
The channel into crypto prices comes from real yield levels, which reflect the return on Treasuries after stripping out inflation. The real yield represents the hurdle rate for bitcoin as a non-yielding asset. The 10-year inflation-indexed yield rose to 2.68 percent on 16 September and largely remained there for the remainder of the week. Such elevated yields means that bitcoin is relatively less attractive, and with the Fed set to continue hiking it is likely that yields will remain high. Even an end to rate hikes would not, on its own, bring relief for bitcoin. That would take weaker spending, cheaper fuel or lighter borrowing, and this week’s data show the opposite.
Three forthcoming releases will test the macro picture. Weekly EIA fuel prices are due on 22 September, followed by the final University of Michigan confidence reading on 25 September, where long-run inflation expectations will be the key number to watch. The August PCE report follows on 30 September, providing the first reading of the Fed’s preferred inflation measure since its latest decision.

What Would Prove This Wrong
Two calls sit behind our view. The first is that credit stays expensive even after the policy rate peaks, because debt supply and the Fed are pushing yields in the same direction. The second is that consumer spending is strong in total but narrowing underneath. Both are testable over the next six weeks.
The 10-year Treasury inflation-indexed yield falls back below 2.4 percent and holds there for two consecutive weeks. We use 2.5 percent as the level above which bitcoin is likely to stay capped, and a dip below it would weaken this call. A sustained move below 2.40 percent would end it.
August core PCE inflation comes in at 0.1 percent or less, which would weaken the case for another rate hike this year.
Retail diesel falls below $5.50 per gallon in two consecutive weekly EIA reports, which would mean the fuel squeeze on households is easing.
The University of Michigan long-run inflation expectation returns to 3.3 percent or below in the final September reading or the October preliminary, which would mean the anchor held.
September retail sales excluding gasoline stations fall on the month, which would mean spending is no longer strong enough to keep the Fed tightening.
The Treasury lowers its October-December borrowing estimate below $628 billion at its next quarterly update, which would ease the supply pressure on yields.