
08 Nov Bitfinex Adds New Margin Funding Chart
We’re pleased to announce the addition of margin funding charts to our platform, designed to enhance our clients’ trading experience!
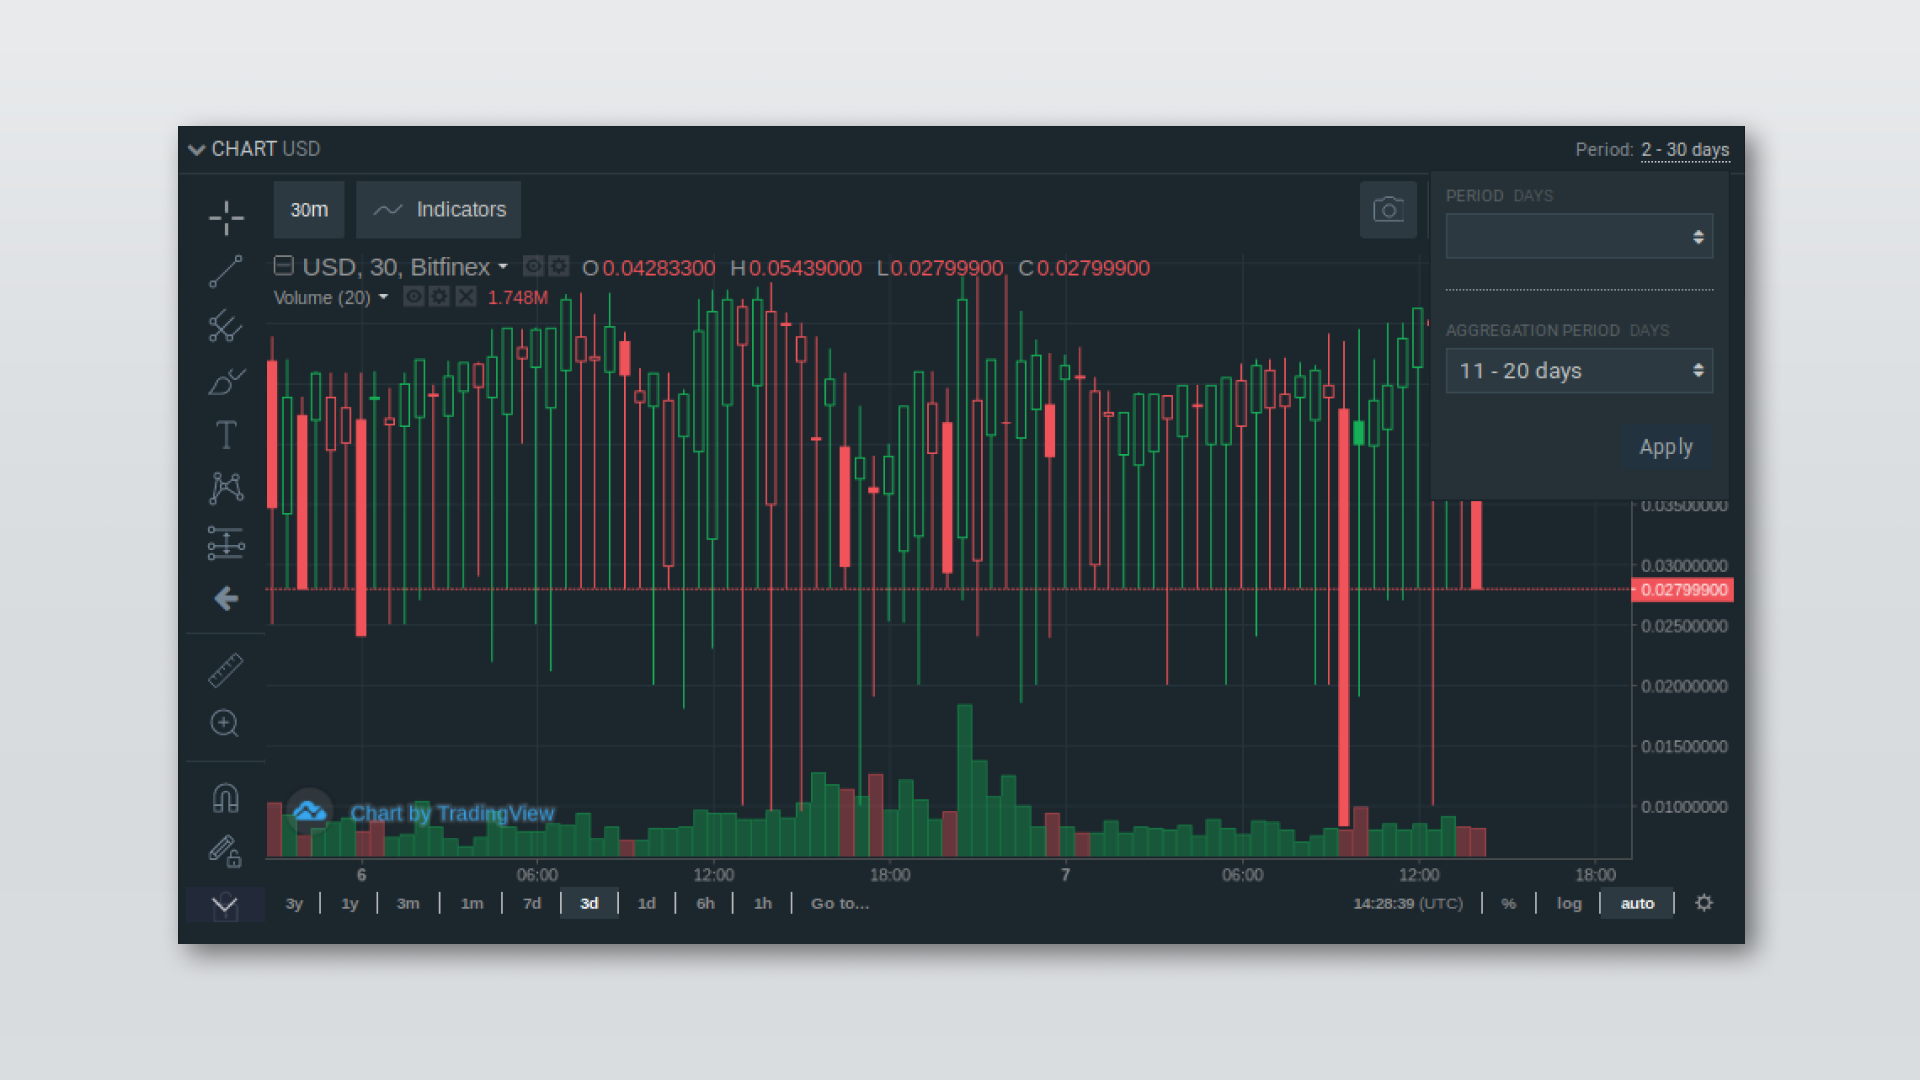
These margin funding charts are candlestick charts that enable our clients to view real-time price movements of funding currencies on Bitfinex. These charts will provide our clients with an overview of a funding currency’s open, high, low and price at the close of trade within a chosen period.
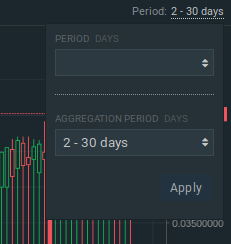
Our clients can select the period of funding that they would like to view from the top right corner of the chart’s panel. A trader can choose to view a specific number of days by selecting an option from 2 days to 30 days under the Period dropdown menu. Alternatively, a subset of periods can be viewed by selecting from the options 2 – 10 days, 11 – 20 days, 21 – 30 days or 2 – 30 days under the Aggregation Period dropdown menu.
These margin funding charts will enable our clients to better understand the price trends of funding currencies, thereby enhancing trading strategies.
For further information, please visit: https://www.bitfinex.com/funding
—
Did you know that Affiliates and referrals on our Affiliate Program can enjoy fee rebates on margin funding? Find out more here.