

Issue #207:
BTC Trades In A Range As Inflation Pressure Grows
The Pillar That Held BTC Up Has Started Leaning
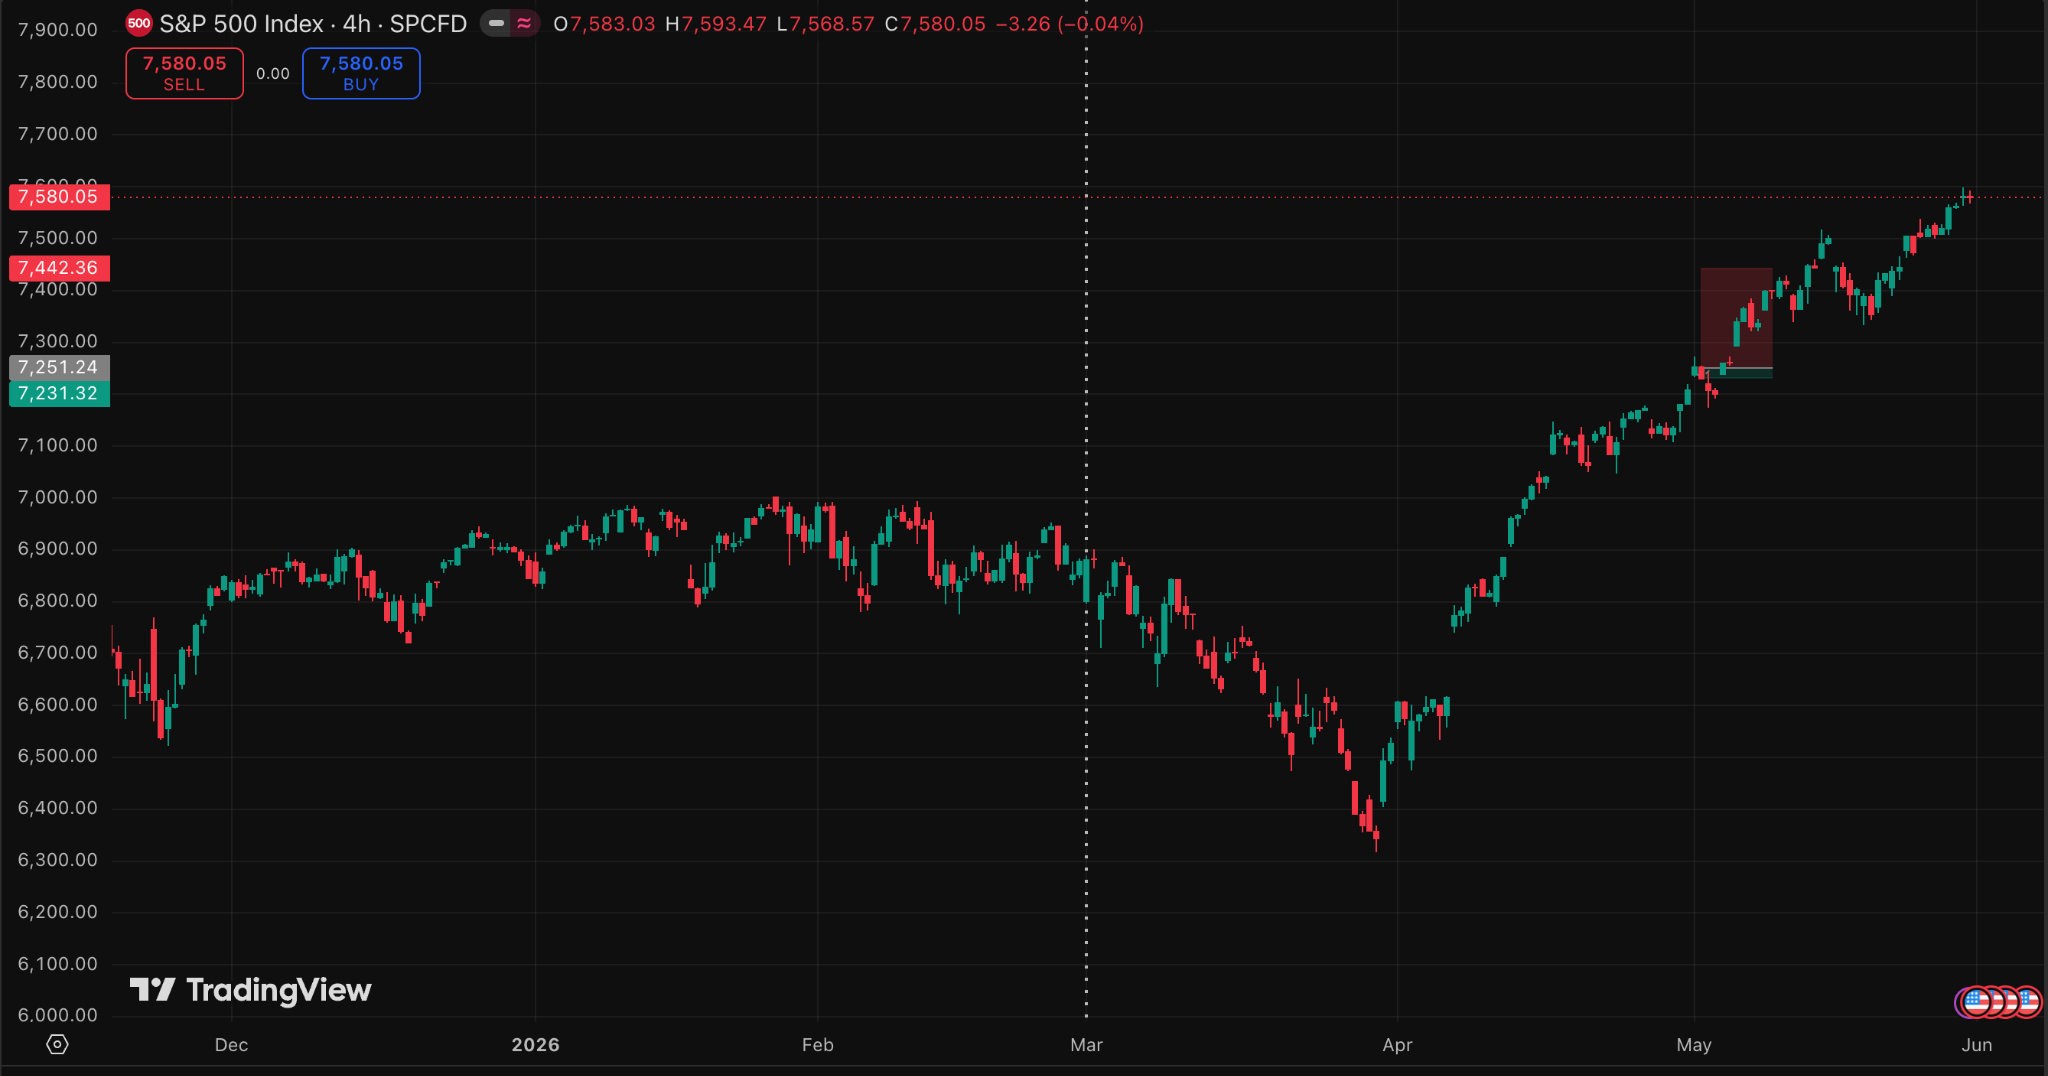
Bitcoin’s performance in May highlighted a growing disconnect between crypto markets and broader macroeconomic conditions. Despite an early-month rally that pushed BTC above $82,000 and improving macro indicators such as declining US Treasury yields, Bitcoin ultimately ended the month lower, suggesting that internal market dynamics were the primary driver of weakness. The market transitioned from a strong expansion phase (post a $72,000 range high breakout) into a period of sustained distribution, with majors steadily declining even as traditional risk assets, including equities, continued to reach new All-Time Highs. This divergence points to a lack of conviction among crypto market participants rather than deteriorating external conditions.
A major factor was the deterioration in institutional demand. Spot Bitcoin ETFs, which had previously acted as a significant source of structural support by absorbing sell pressure, experienced more than $3 billion in cumulative outflows over the past three weeks. Combined with profit-taking from short-term holders and weakening spot market demand, the reduction in institutional participation removed a critical pillar that had supported Bitcoin’s recovery earlier in the year. As a result, the market became increasingly vulnerable to distribution-led selling pressure.
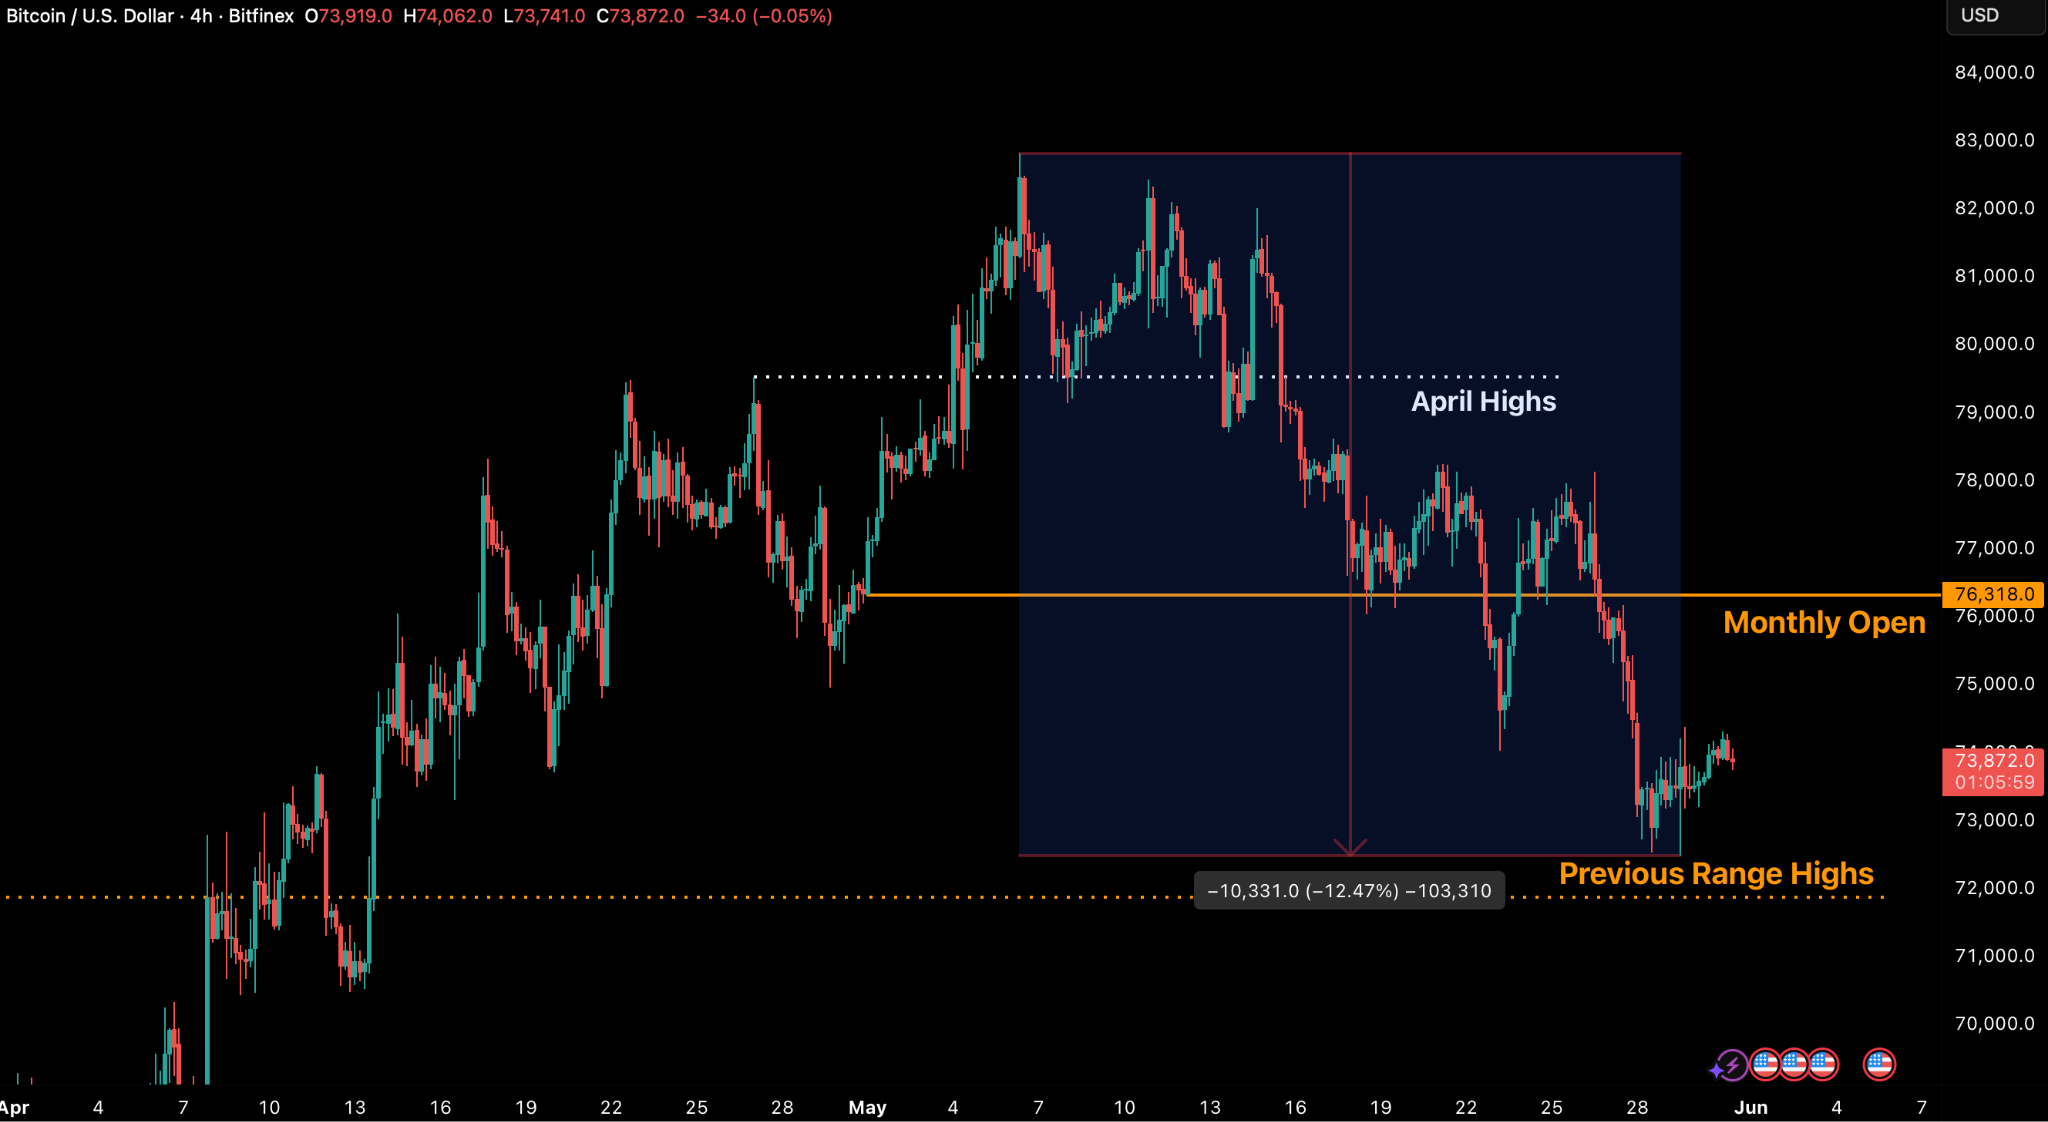
Figure 1: BTC/USD 4H Chart. (Source: Bitfinex)
US economic growth remains positive, but cracks are emerging beneath the surface. GDP growth slowed to 1.6 percent even as corporate earnings surged, creating a growing divergence between equity market optimism and rising Treasury real yields, which reflect investor concerns over inflation, fiscal deficits, and higher borrowing costs.
That resilience is increasingly being driven by higher-income households. Inflation remains above the Federal Reserve’s target, while real incomes and savings continue to decline. Wealthier consumers, supported by strong asset values and healthier balance sheets, are carrying a larger share of spending as financial pressure builds on lower-income households.
The labour market remains the economy’s key support. While job growth and unemployment remain stable, rising continuing jobless claims, falling job openings and weaker worker mobility suggest hiring momentum is slowing. As long as employment holds up, consumer spending can remain resilient, but further labour market deterioration could quickly challenge the current expansion.
South Korea is also facing mounting opposition to its proposed digital asset tax regime, with critics arguing that crypto investors face harsher treatment than stock investors despite receiving fewer protections. The debate highlights the growing competition among jurisdictions to attract and retain digital asset activity.
Meanwhile, Grayscale has delayed its planned IPO, reflecting softer investor appetite for crypto-linked listings as public markets increasingly prioritise profitability and stable cash flows over pure exposure to digital assets.

Market Signals
The Month The Macro Excuse Expired
May was the month where Bitcoin continued its mid-timeframe uptrend after breaking out from the $72,000 range highs in April. BTC moved higher quite quickly, moving 8.5 percent higher off the Open within the first six days of May before retracing, altcoins saw rotational capital with some reaching new All-Time Highs (ATH) and others reaching multi-month highs.
Post the STRC May 15 ex-dividend date, price retraced sharply, recording a low of $72,487, 12.5 percent off the highs, leaving BTC trading well below the Monthly Open of $76,318. In contrast, traditional markets held firm into the monthly close. SPX finished May 5.15 percent higher at ATHs as crypto lagged once more

On a seasonal basis, BTC is tracking previous bear market patterns with a red May monthly close. The average May return is +7.36 percent, with a median above 3.5 percent based, on data since 2013.
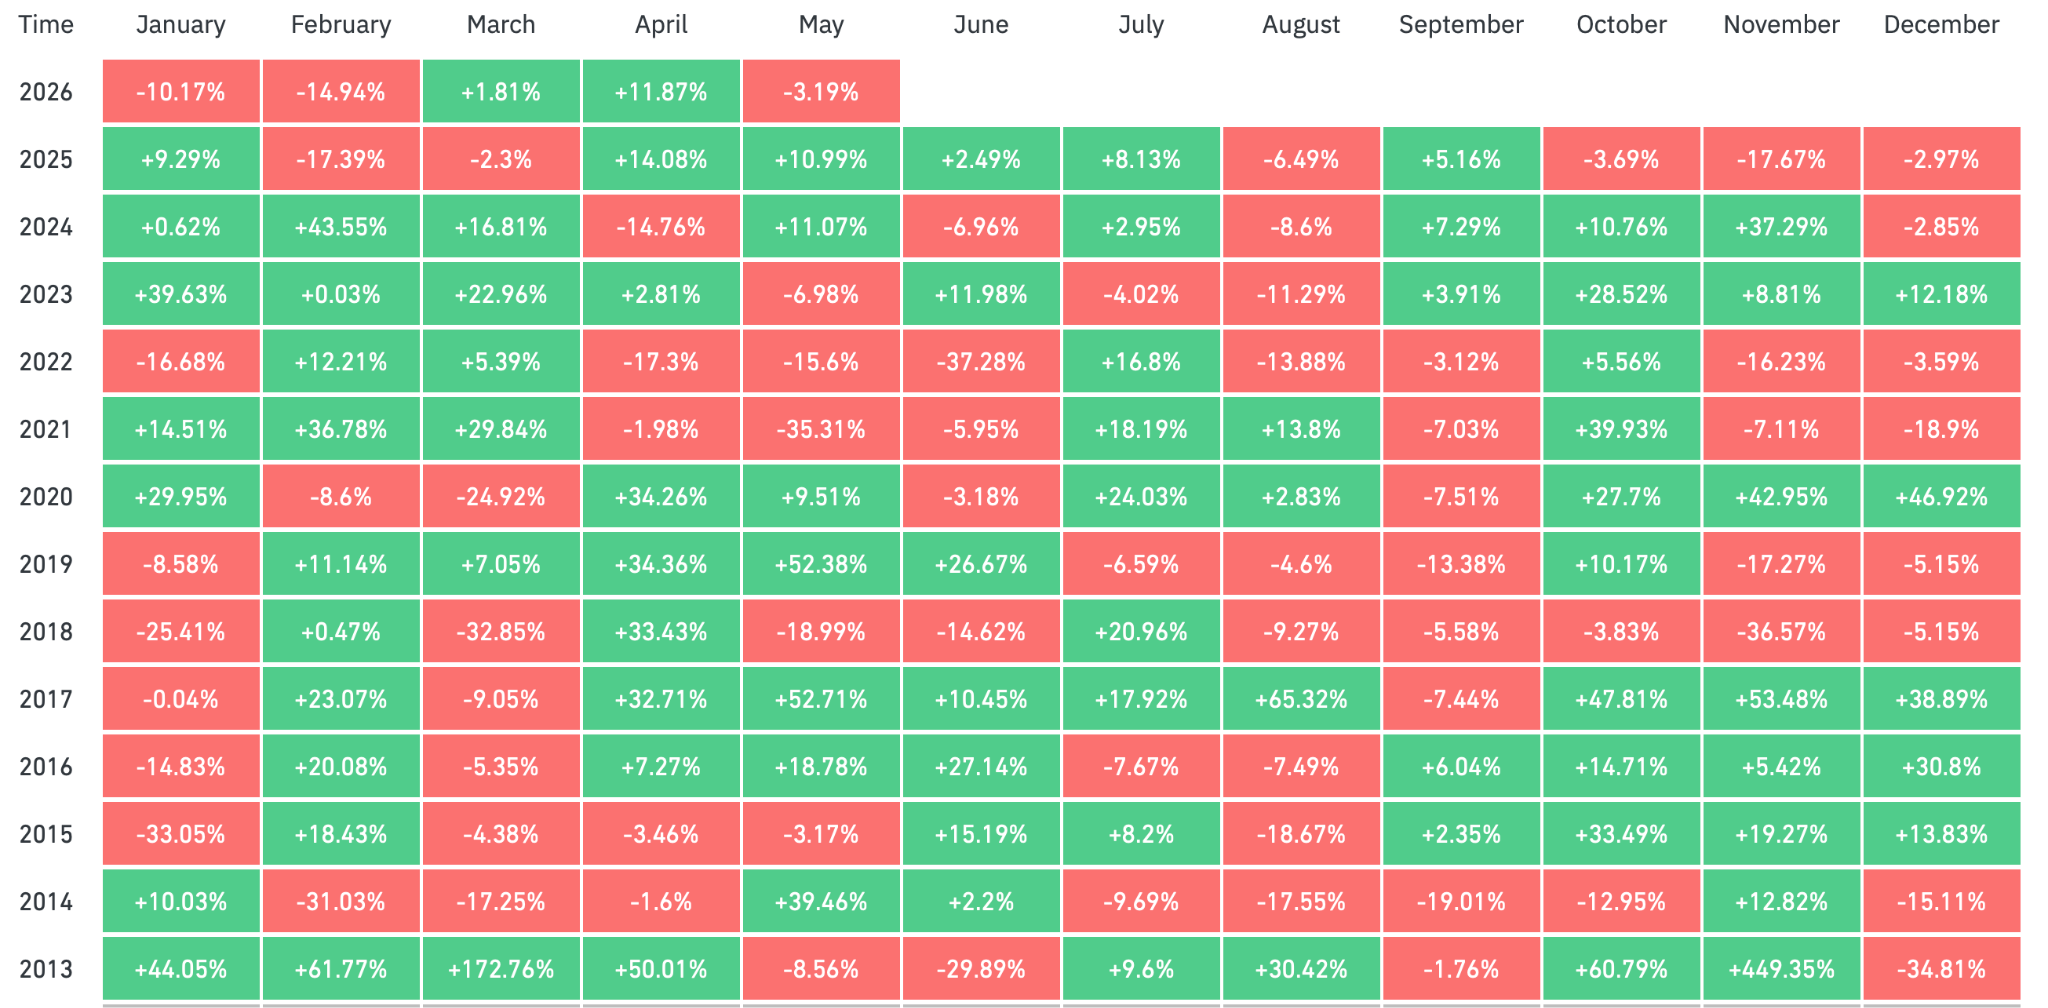
Bear market years, as seen in 2018 and 2022, usually see a brief recovery after a negative start to the year. Part of this seasonality effect appears tied to the global liquidity cycle and the halving cycle. However, the former has been displaced by geopolitical tensions over the past two years, first with the imposition of US tariffs and more recently, the Iran conflict. For now, BTC seems to be tracking a typical seasonality pattern seen in bear market years including a negative May close after a better start to the year, leaving the possibility of a negative June quite plausible.
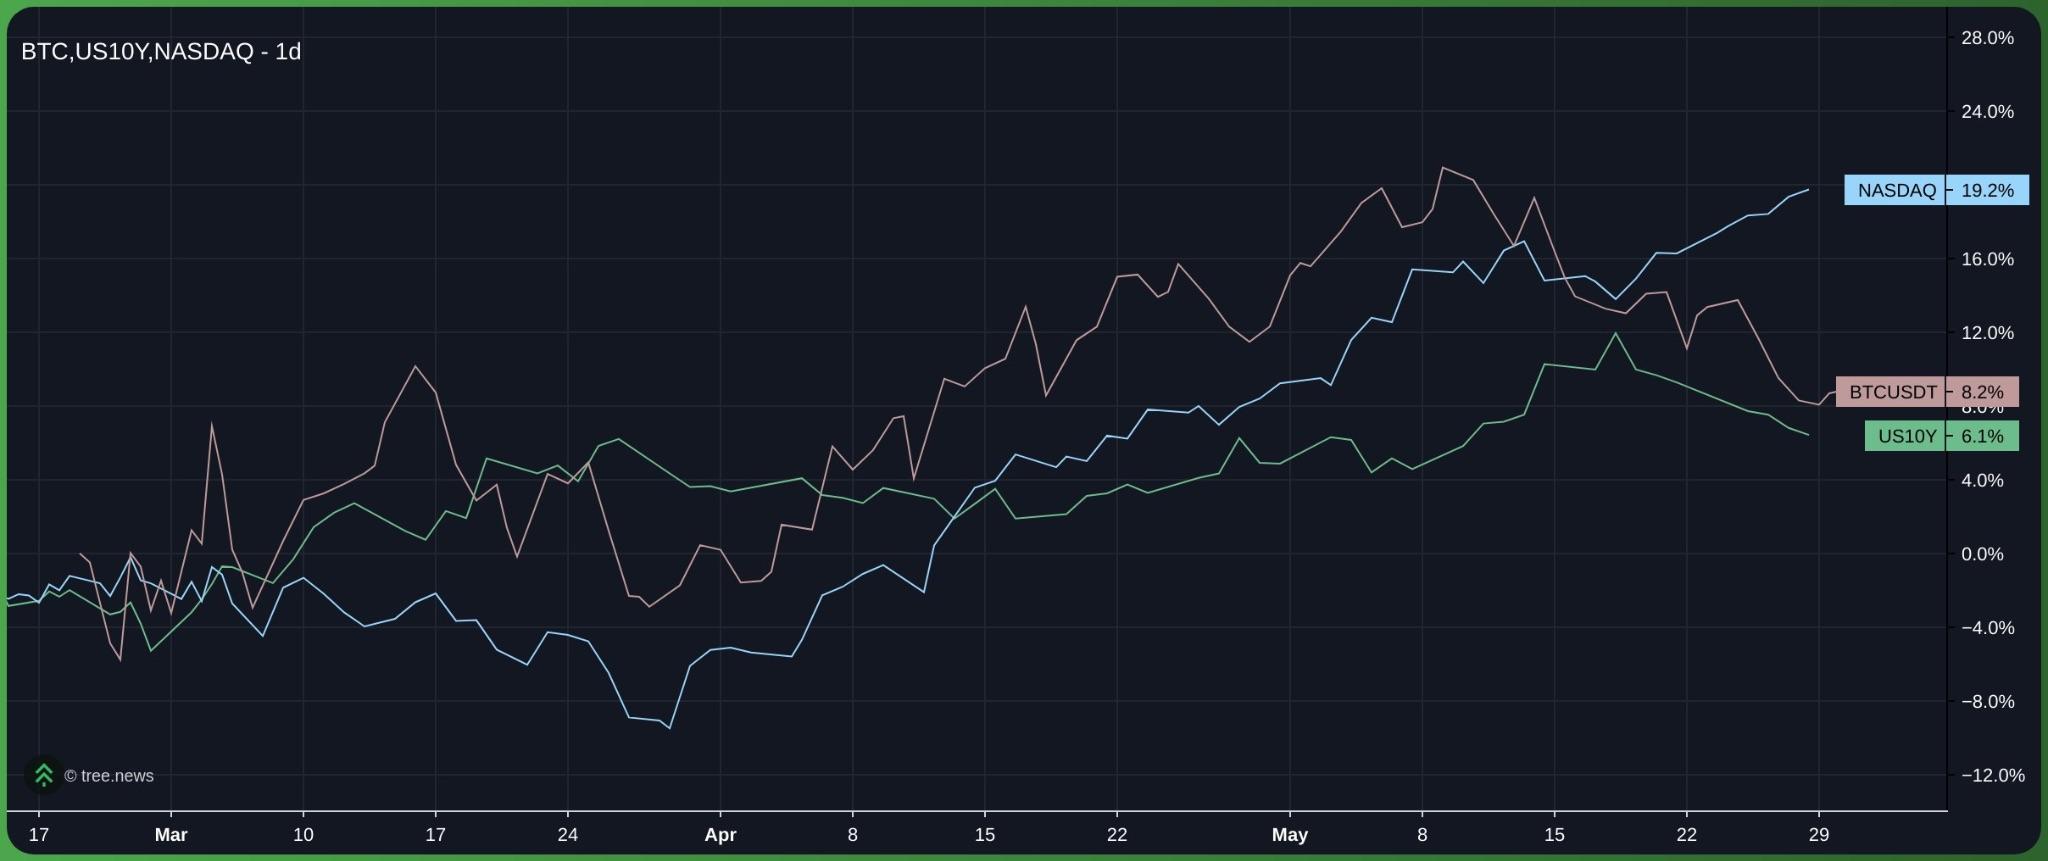
The most significant takeaway from May is not the BTC decline, it’s the timing and the context. In May’s final week, spot prices fell from a Monday high of $78,129 to a $72,487 low by Friday, even as the US 10-year Treasury yield eased from 4.67 percent to 4.45 percent. That divergence matters: the primary macro headwind for weeks in the form of real rates actually provided relief to risk assets as yields dropped, yet BTC sold off regardless. The recent drawdown was driven less by macro factors and more by internal distribution within the crypto complex, as sellers moved into a thinning bid. Over the past few weeks, we have covered weakening demand by ETFs, institutional products and short-term holder profit taking.
The early-month high. followed by 24 sessions of lower price action is a classic distributional pattern: initial buying momentum exhausts itself, and the market slowly bleeds out. By the monthly close, BTC has given back 3.2 percent for the month and is down 12.5 percent from its local top, as anticipated institutional support failed to materialise during the retracement.
We view May as a three-part narrative. It began with an aggressive squeeze breaking above the April highs toward the $82,000 zone, which acted as a firm structural ceiling across the first ten days. The second phase was a macro-driven shock, where spiking yields and inflation data triggered significant liquidations around 18 May. The third act: the quiet bleed into month-end, is most telling about structural weakness, particularly as other risk assets continued to move higher into the close.
If seasonality follows the same pattern as previous bear market years, June is likely to be a negative month for cryptocurrency. A strong shift in structural inflows across ETFs and institutional products like STRC could change that materially.
From a market-structure perspective, institutional channels defined the monthly trajectory. Throughout the post-April recovery, the US spot ETF ecosystem functioned as a critical structural supply sink, absorbing bitcoin sell pressure at a pace three to six times greater than miner issuance. In May, however, this absorption mechanism inverted. The past three trading weeks saw successive cumulative outflows exceeding $1 billion, adding to selling pressure that already existed via short-term holder distribution, which has calmed considerably over the past week.

Spot Demand Withers While Volatility Dies Alongside
Spot Volume Delta has begun to roll over following a transient recovery earlier in May, with recent trading sessions returning to a state of net sell-side dominance as Bitcoin retreats from structural resistance in the low-$80,000 zone. Simultaneously, implied volatility continues its sustained downward trajectory across the term structure, with the most pronounced compression visible in front-end contracts. This leads us to believe that even if the downtrend is to continue, large price deviations from the mean in either direction are extremely unlikely, with derivatives and options open interest reaching multi-month lows as well.
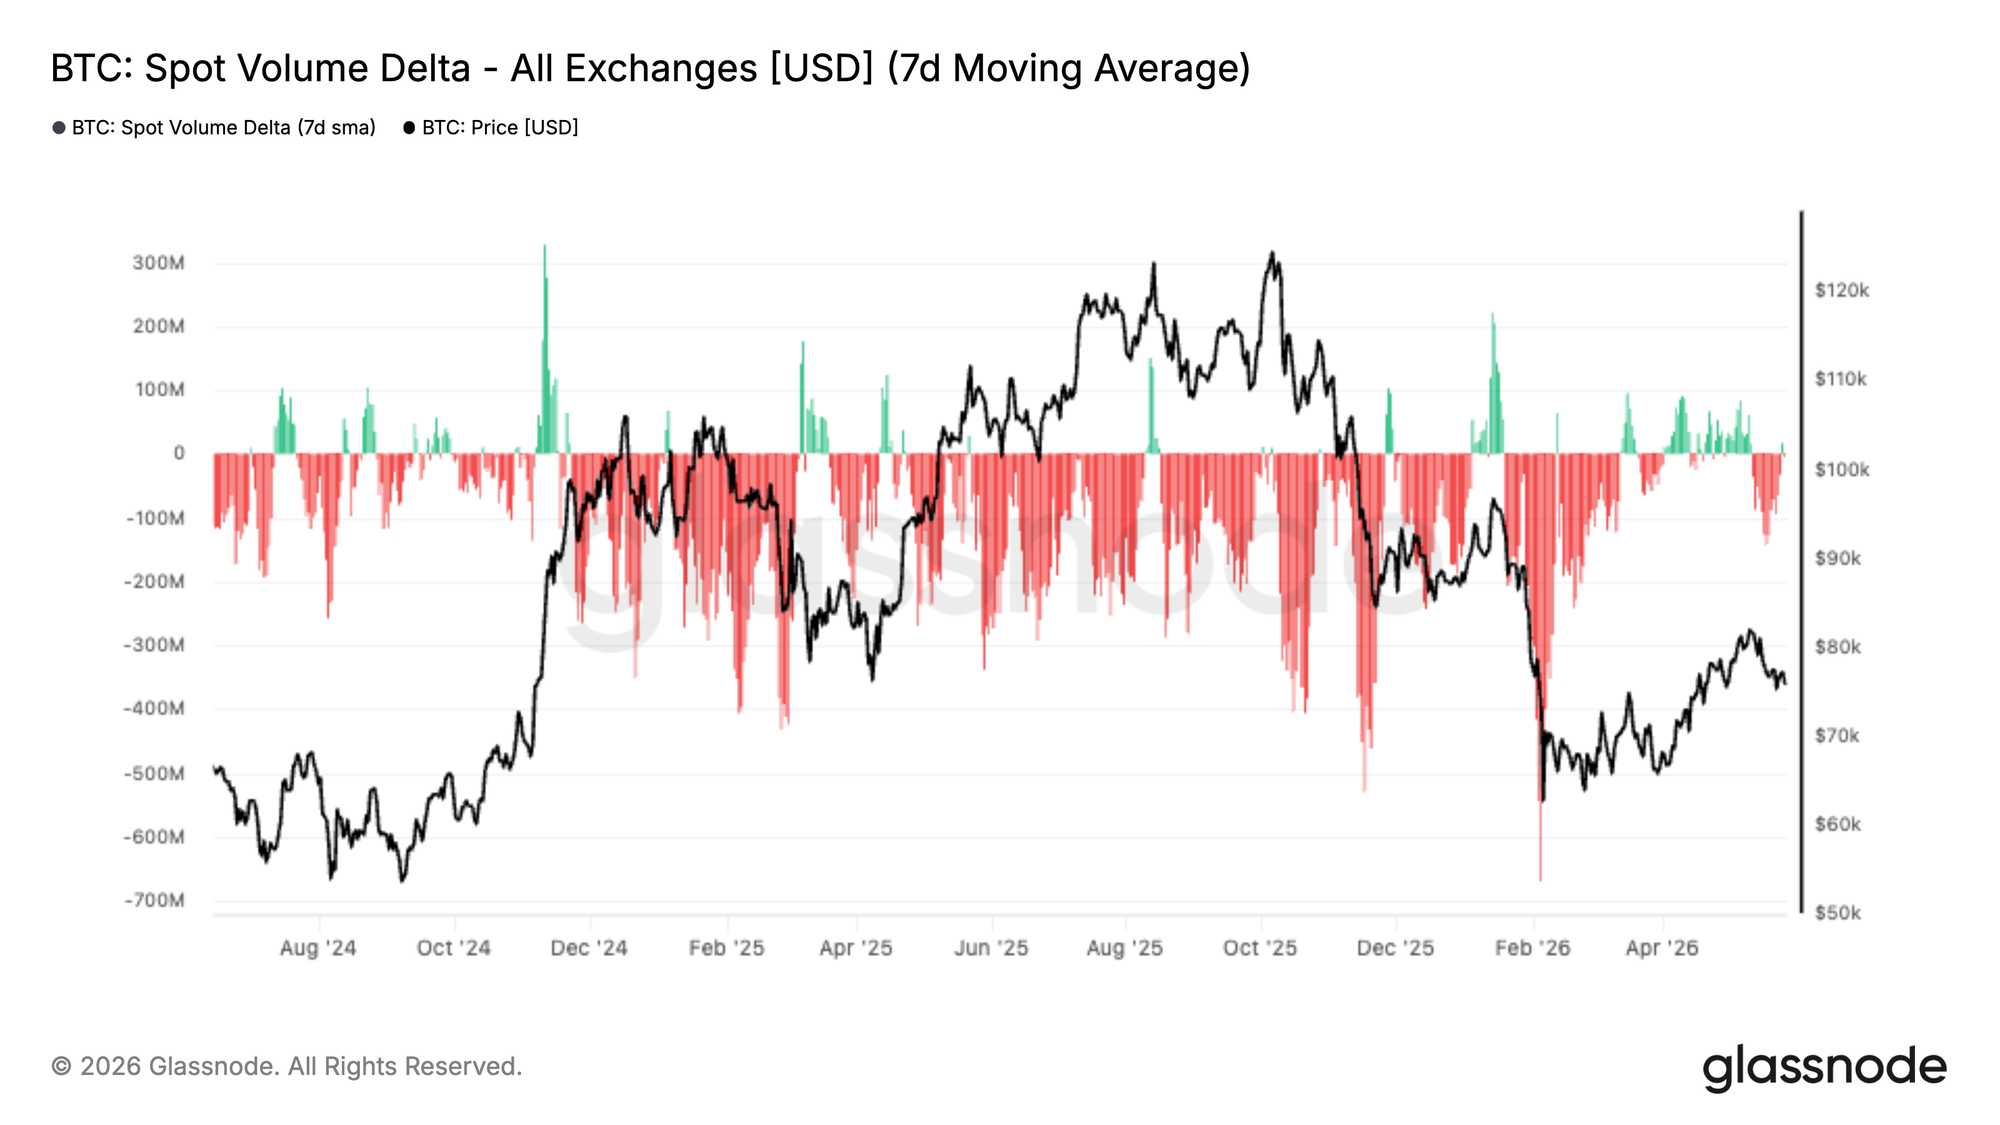
From a market-structure perspective, this shift in the spot taker (market) orders carries weight as the rally originating from February lows was largely supported by intensifying spot aggression, creating a durable floor. However, that has now visibly eroded over the past two weeks, with buying momentum exhausting itself near structural ceilings while sell-side flows increasingly dictate the trajectory of spot liquidity.
Ultimately, a meaningful repricing of BTC towards higher prices requires a sustained return of spot-driven demand. Without this catalyst, the asset risks sliding back into the fragmented, distribution-led landscape that hampered headline activity throughout the initial stages of the year.
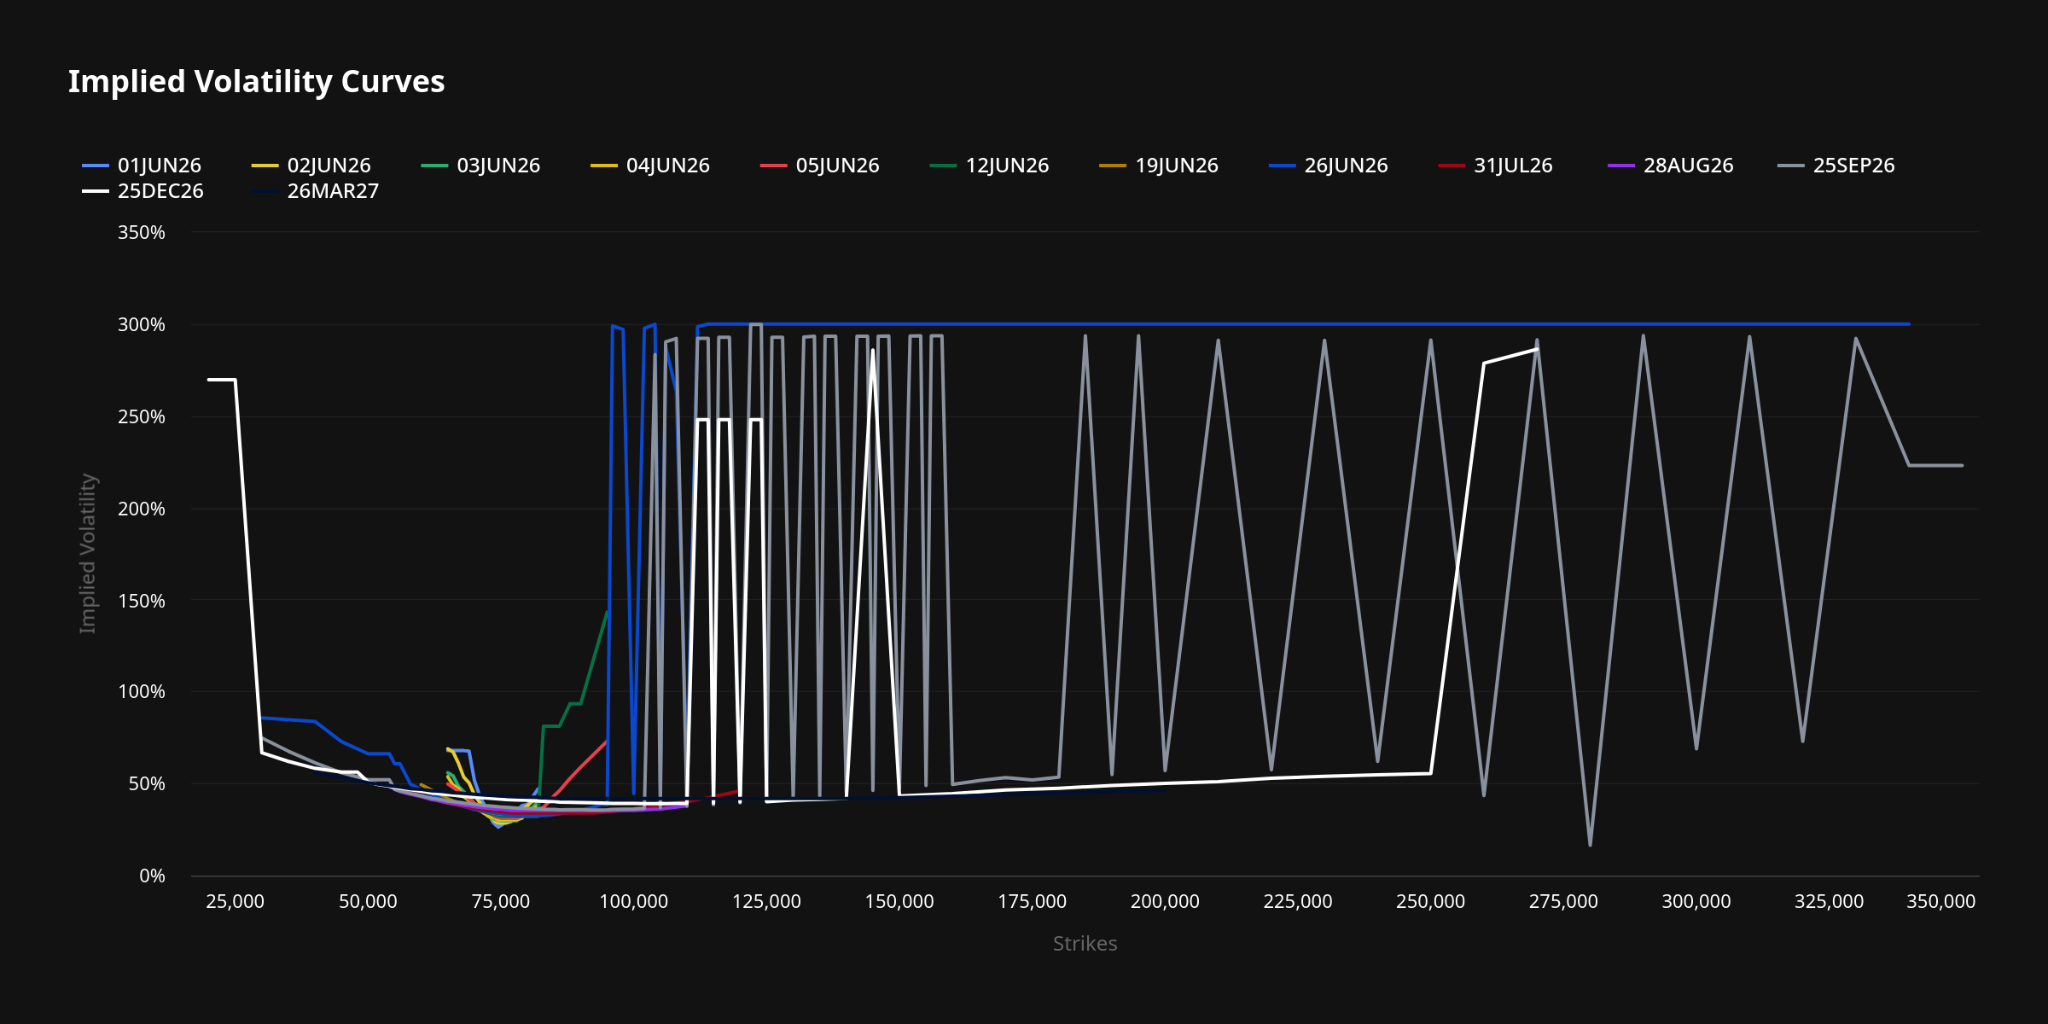
Over the past two trading weeks, the 30-day tenor on BTC options, collapsed from roughly 38.5 percent toward 33 percent, while longer-dated expiries reflecting a similar, albeit less aggressive, softening in volatility expectations.
This shows that options traders have an increasingly diminishing appetite for paying high premiums for either hedging or directional bets. As these IV numbers continue to erode, we are now in a regime where volatility sellers dictate terms and the chances for explosive price swings in either direction remain low. This aligns with our perp market based observations where OI continues to trickle down instead of a “leverage flush”, resulting in a slow bleed rather than a quick or explosive move down or up.

General Macro Update
Rising Real Yields Highlight Growing Economic Risks
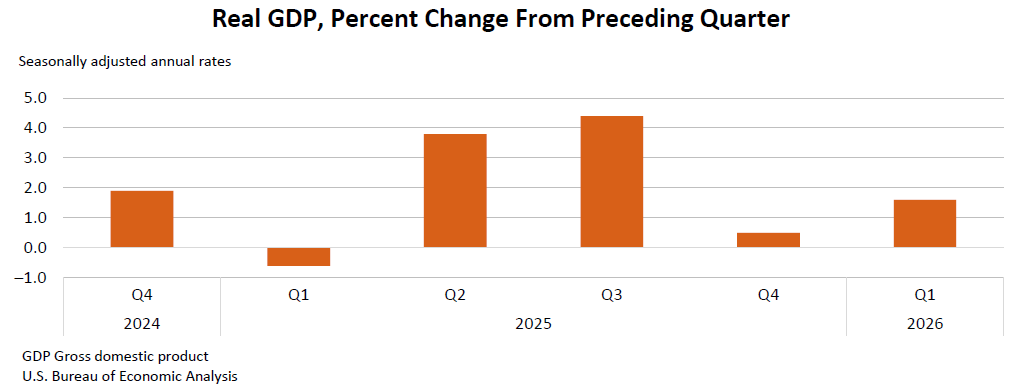
GDP Slows As Q1 Earnings Reach Record Pace
The US economy continued to expand in the first quarter of 2026, but the pace has slowed. Real gross domestic product (GDP) increased at an annual rate of 1.6 percent according to the second estimate released by the Bureau of Economic Analysis on 28 May 2026, revised down from the 2.0 percent advance reading on weaker investment and consumer spending. Against that slowdown, corporate earnings have remained exceptionally strong. The S&P 500 blended Q1 2026 earnings growth rate is running at 28.4 percent with 94 percent of companies reported, the highest year-on-year pace since Q4 2021, with 84 percent of companies posting positive earnings-per-share surprises. The S&P 500 index is up roughly 11 percent year-to-date and trading near record highs. Rising Treasury real yields, however, suggest investors are growing increasingly concerned about inflation pressures, fiscal deficits and the long-term cost of capital, creating a growing divergence between optimism in equity markets and caution in bond markets.
Strength Concentrated In A Narrow Set Of Sectors
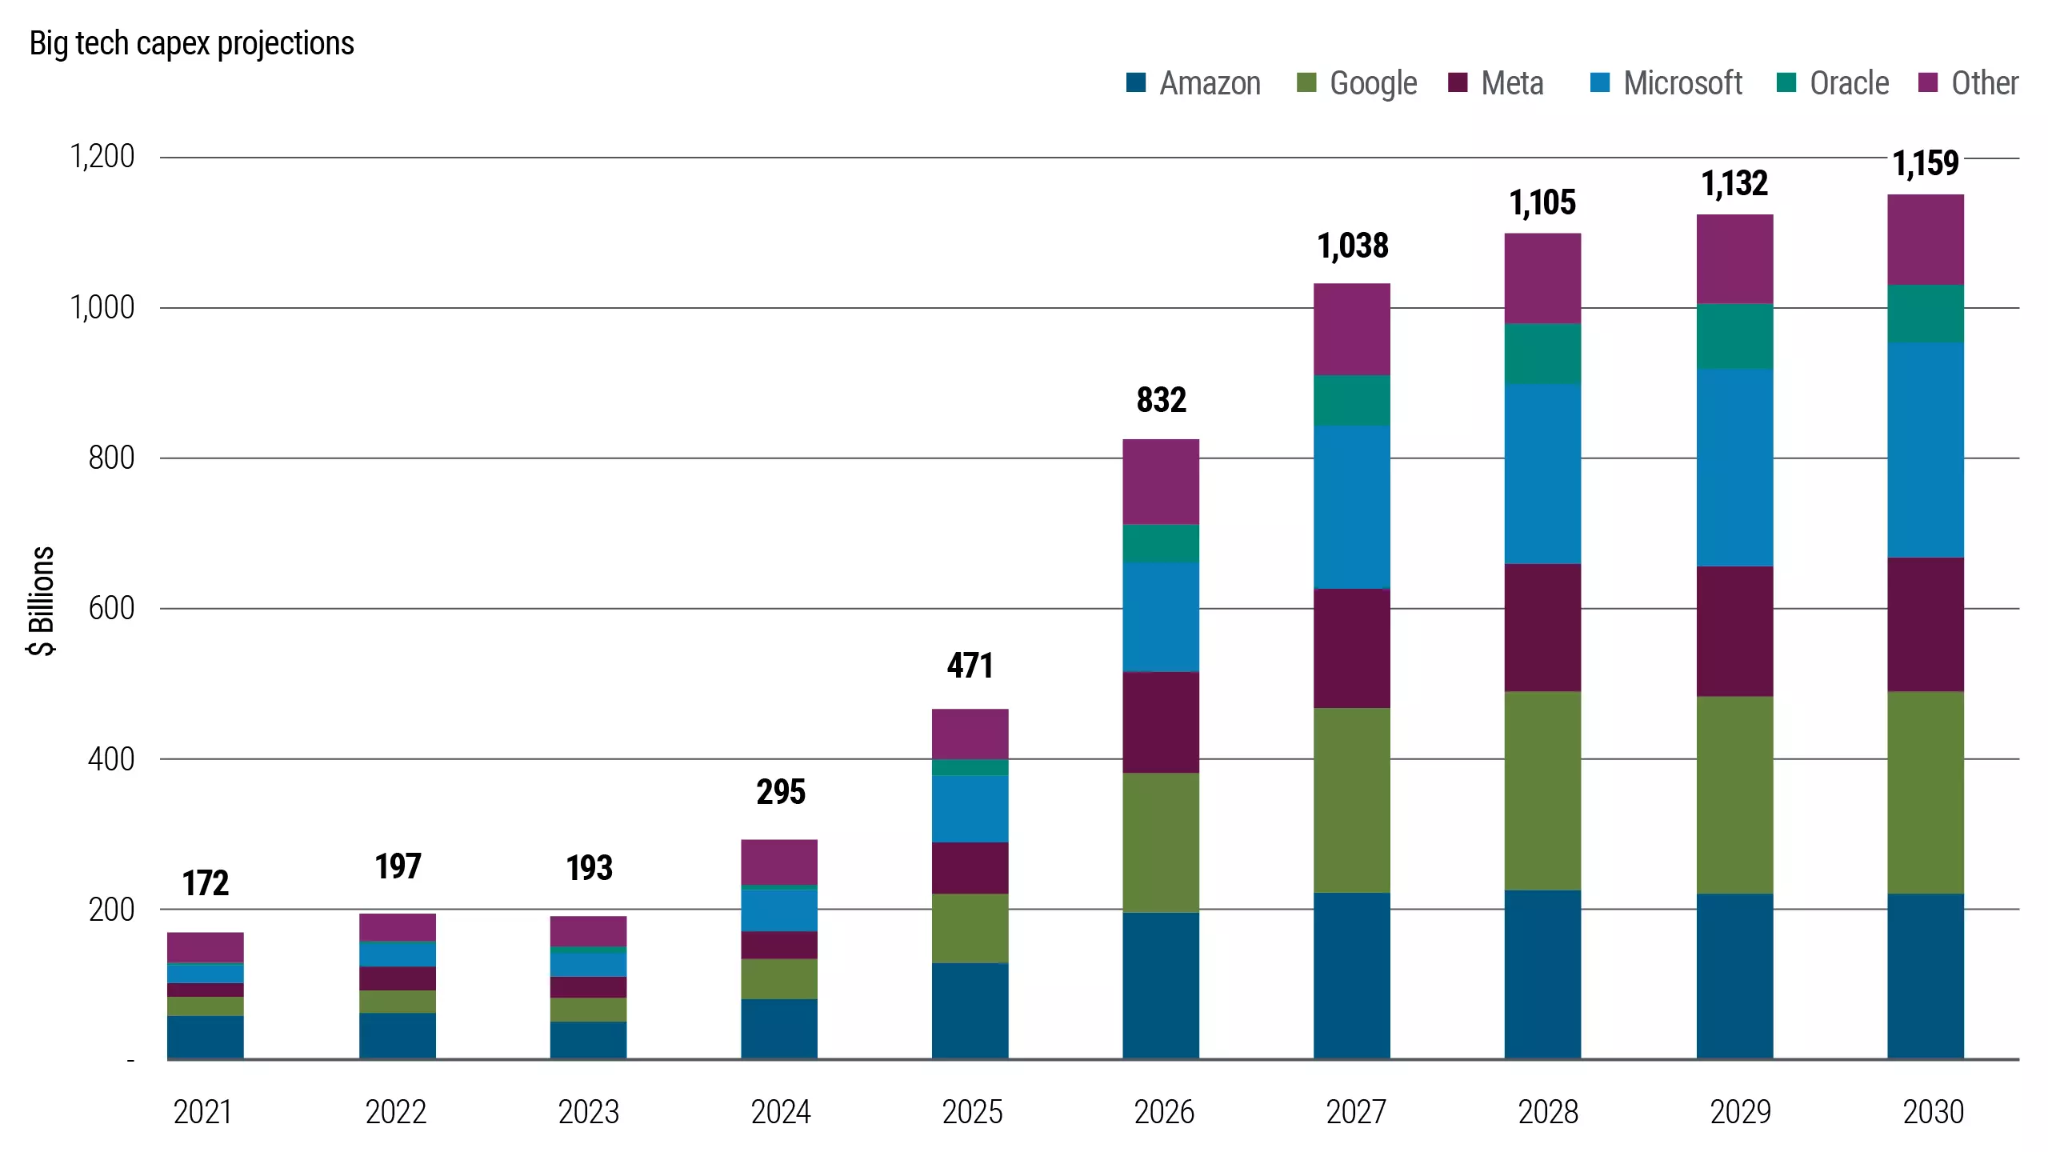
While headline activity remains positive, several structural imbalances are becoming more apparent. These include persistent fiscal deficits, accelerating investment in artificial intelligence infrastructure, growing concentration within technology stocks and an increasing share of consumer spending coming from higher-income households.
The Q1 2026 earnings strength has been disproportionately driven by a small number of large technology names. According to FactSet, the Magnificent Seven reported actual earnings growth of 63.2 percent for the quarter, compared with 17.4 percent for the remaining 493 companies in the index, with NVIDIA, Alphabet, Amazon and Meta Platforms ranking among the five largest contributors to overall index growth. Together, these trends suggest that economic strength is becoming increasingly dependent on a relatively narrow set of drivers.
The Bond Market Signal: Real Yields At Multi-Year Highs
Bond markets have reflected these concerns through a broad increase in real yields, which measure borrowing costs after accounting for inflation. Real yields matter because they influence business investment decisions, mortgage affordability and government financing costs. Higher real yields generally indicate tighter financial conditions and a higher cost of capital across the economy.
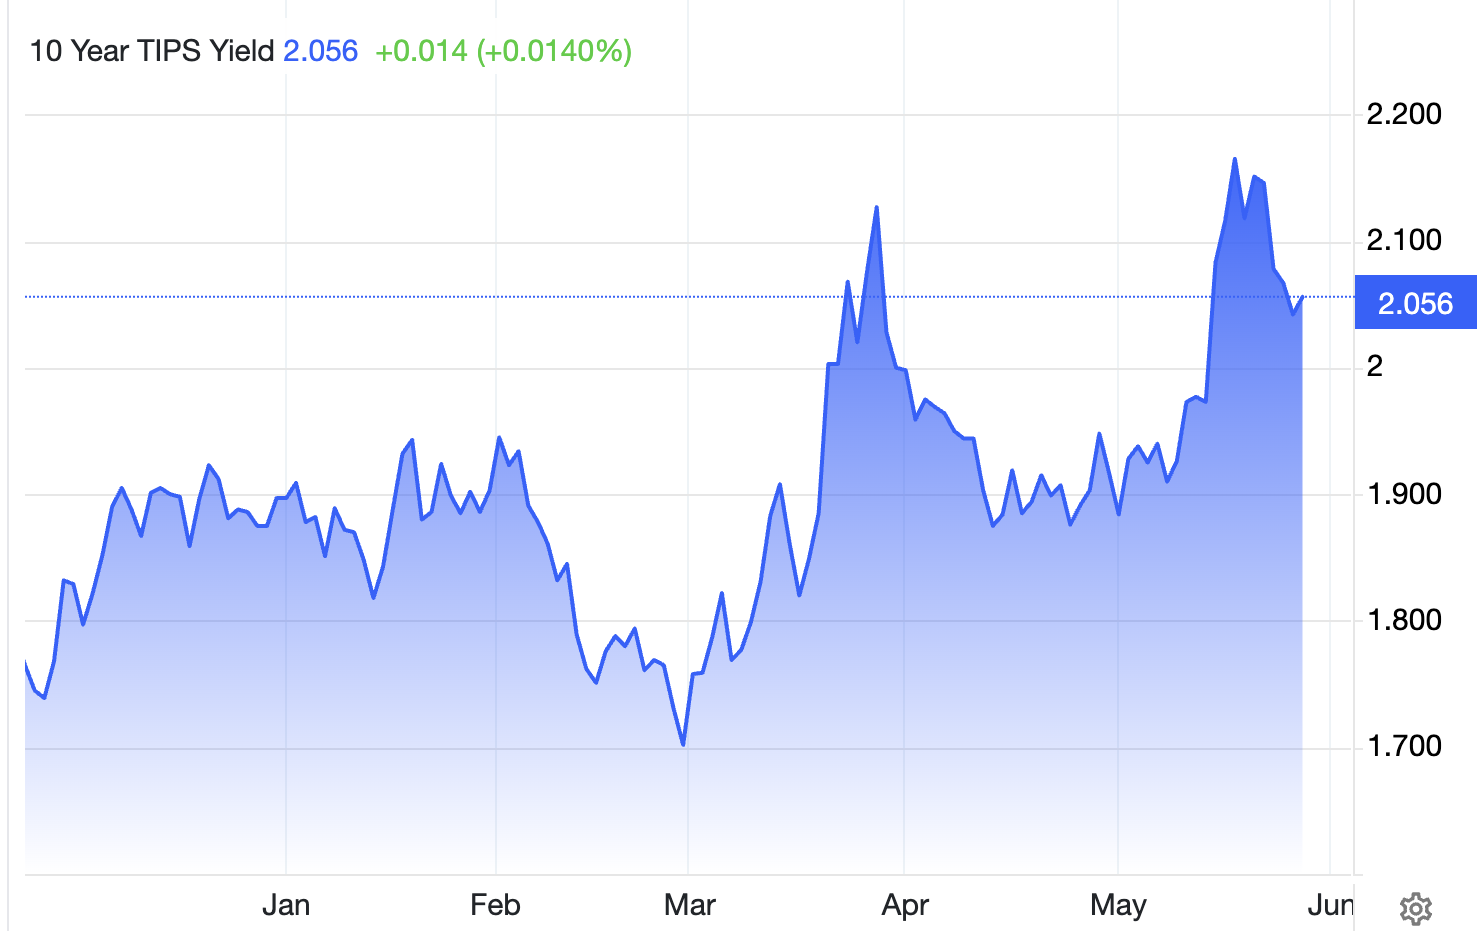
Since the escalation of conflict in the Middle East, real yields on Treasury Inflation-Protected Securities (TIPS) have risen significantly, particularly at the front end of the yield curve. The 10-year TIPS real yield stood at approximately 2.04 percent as of 29 May 2026, up around 13 basis points in May, while the 10-year nominal Treasury yield closed near 4.46 percent on the same date. These levels suggest investors expect inflationary pressures to remain elevated in the near term and increasingly believe interest rates may stay higher for longer.
What Is Driving Real Yields Higher
The rise in borrowing costs is being driven by several factors. Increased government debt issuance is absorbing capital from financial markets, while technology firms continue to invest heavily in data centres and artificial intelligence infrastructure. At the same time, supply constraints in energy markets and shortages of advanced materials are adding to inflation risks.
The Configuration Is Unusual: What Resolves The Divergence
Strong earnings growth and continued business investment are supporting headline expansion, but the configuration is unusual: a 28.4 percent Q1 earnings print sits against a 1.6 percent GDP reading and a 10-year real yield above 2 percent.
The divergence between equity and bond markets highlights growing uncertainty about whether productivity gains and technological investment can offset the inflationary pressures and fiscal challenges emerging beneath the surface of the economy.
That discrepancy historically demands either a productivity step-change or a meaningful repricing of one of the three.

Inflation Turns Economic Growth Increasingly Dependent On Higher-Income Households
The divergence flagged in the preceding section is visible at the household level too. Inflation continues to compress lower-income spending power while higher-income households remain insulated by rising asset values, and the latest data shows both pressures intensifying. This split is becoming a defining feature of the current economic environment: higher-income households benefit from accumulated savings, stronger access to credit, and asset appreciation that sustains their consumption, while lower-income consumers face mounting pressure from elevated living costs and stagnant real incomes. As a result, the composition of US growth is becoming increasingly concentrated among wealthier households.
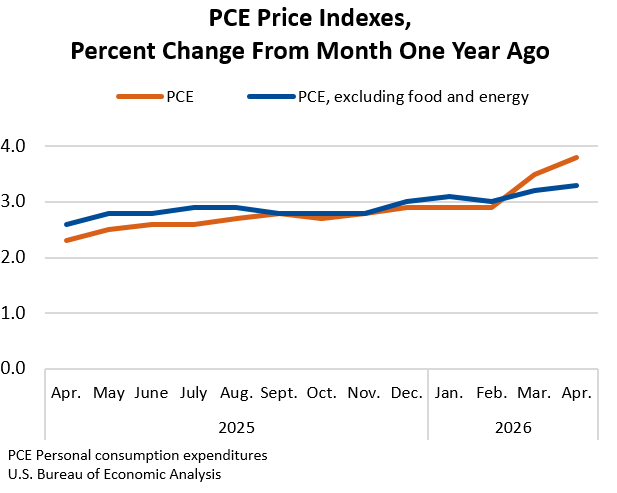
Inflation Remains Persistent Above Target
The Personal Consumption Expenditures (PCE) Price Index released by the Bureau of Economic Analysis showed headline PCE rising 0.4 percent month-on-month and 3.8 percent year-on-year in April, with core PCE up 0.2 percent and 3.3 percent on the same basis, while real disposable income fell 0.5 percent. These prints show that even as headline consumer spending has yet to contract, weakening real incomes and declining savings are placing growing financial pressure on a meaningful share of households.
Headline PCE has now remained above the Federal Reserve’s (the Fed) 2 percent target for 60 consecutive months. The fact that core PCE, which excludes food and energy prices, also continues to print well above target signals that underlying price pressures are persistent rather than transitory, even as the headline growth backdrop slows.
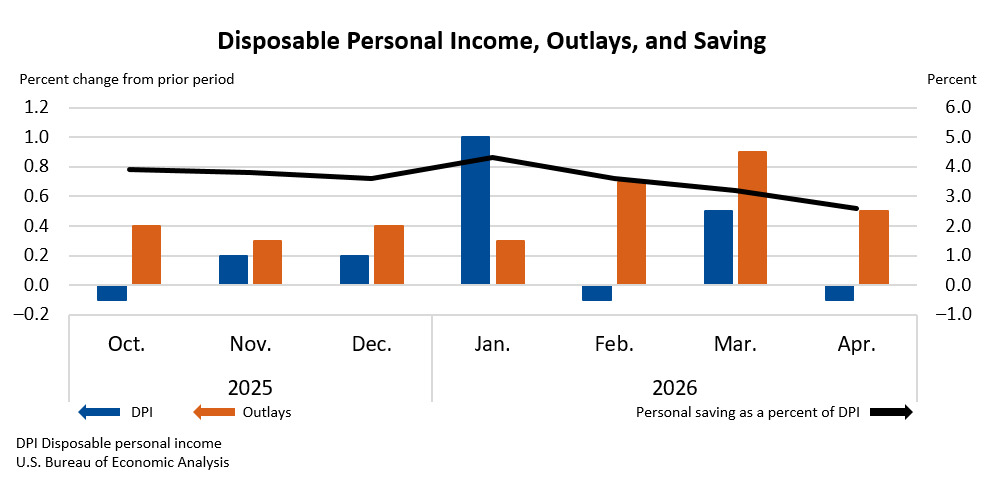

Household finances continued to weaken alongside the inflation print. Personal income was unchanged during the month, real disposable income declined by 0.5 percent and real personal income excluding government transfers fell by 0.4 percent. The personal savings rate dropped to 2.6 percent in April, its lowest level since June 2022, confirming that households are actively drawing down savings to maintain spending as inflation erodes purchasing power.
Strength Concentrated
Despite these pressures, consumer spending has remained resilient. Inflation-adjusted spending increased by 0.1 percent in April. That resilience is already narrowing: with real income growth weakening and savings buffers depleted, the burden of sustaining consumer spending is shifting to households with stronger balance sheets and greater financial resources.
The Two-Track Consumer
This divergence is becoming a defining feature of the current economic environment. Higher-income households continue to benefit from the rising asset values highlighted in the preceding section, alongside accumulated savings and stronger access to credit, allowing them to sustain consumption. Meanwhile, lower-income consumers face increasing pressure from elevated living costs and slower income growth. As a result, economic growth is becoming increasingly dependent on spending by wealthier households.
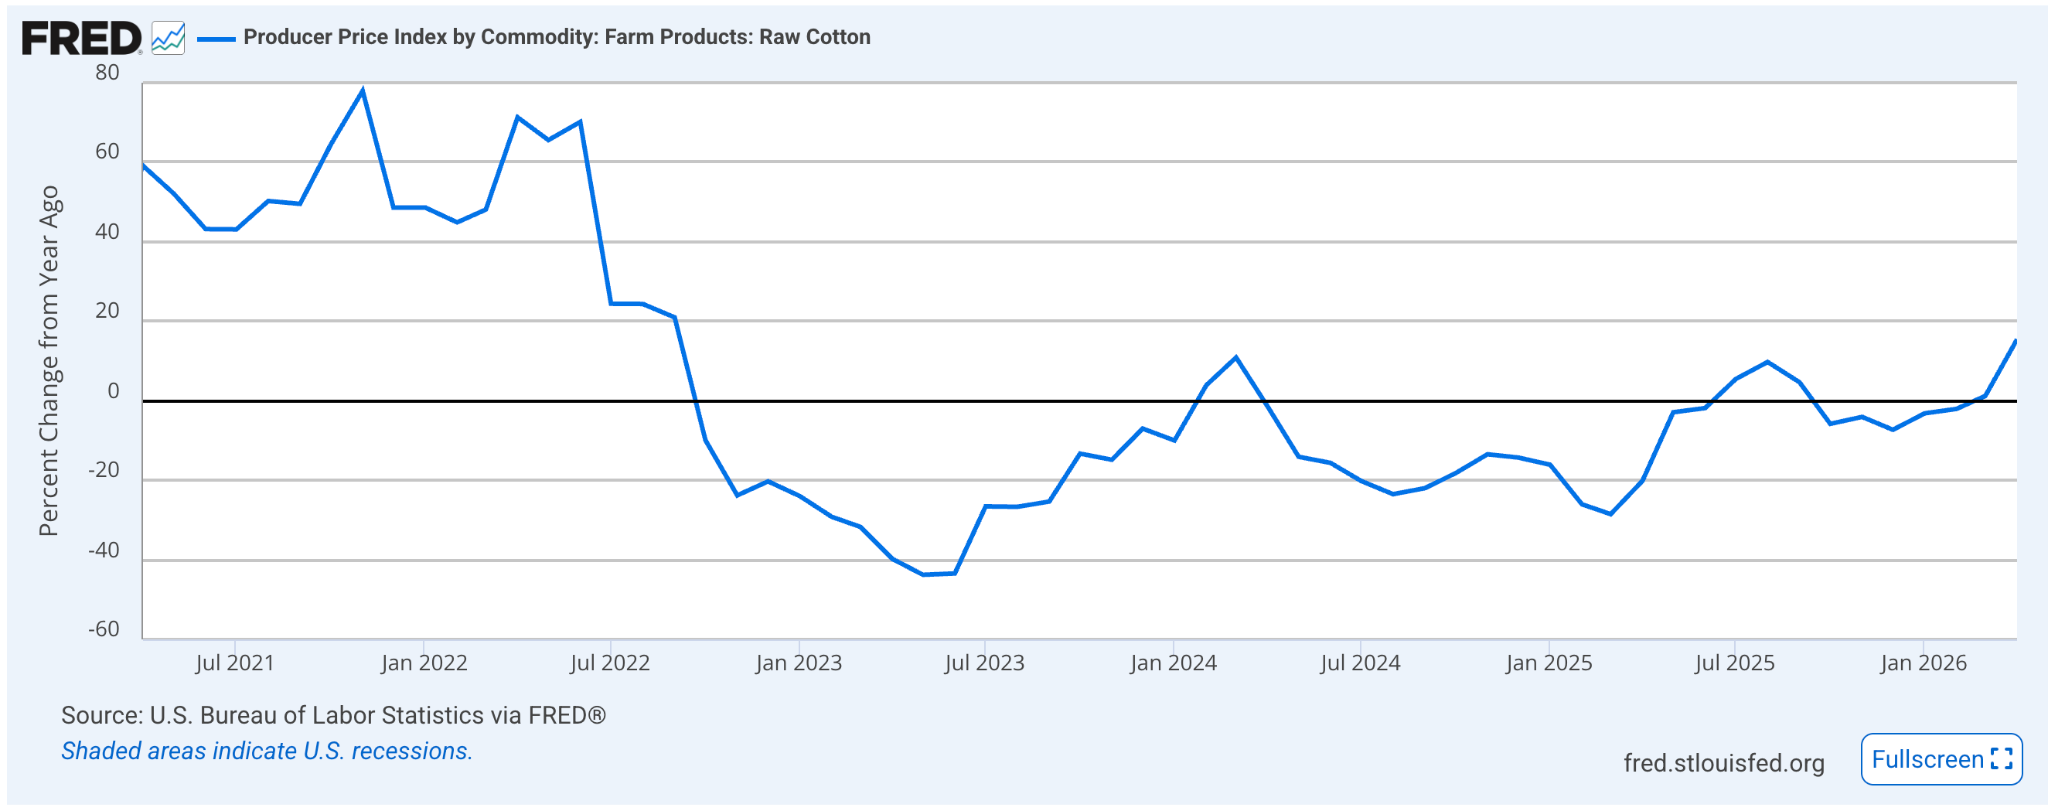
Supply-Side Inflation: Cotton As An Early Signal
Inflation risks are also being reinforced by supply-side developments. Higher energy prices are now affecting a broader range of goods beyond fuel and transport. One example is the cotton market, where prices have risen sharply following disruptions in global energy markets and tightening supply conditions.
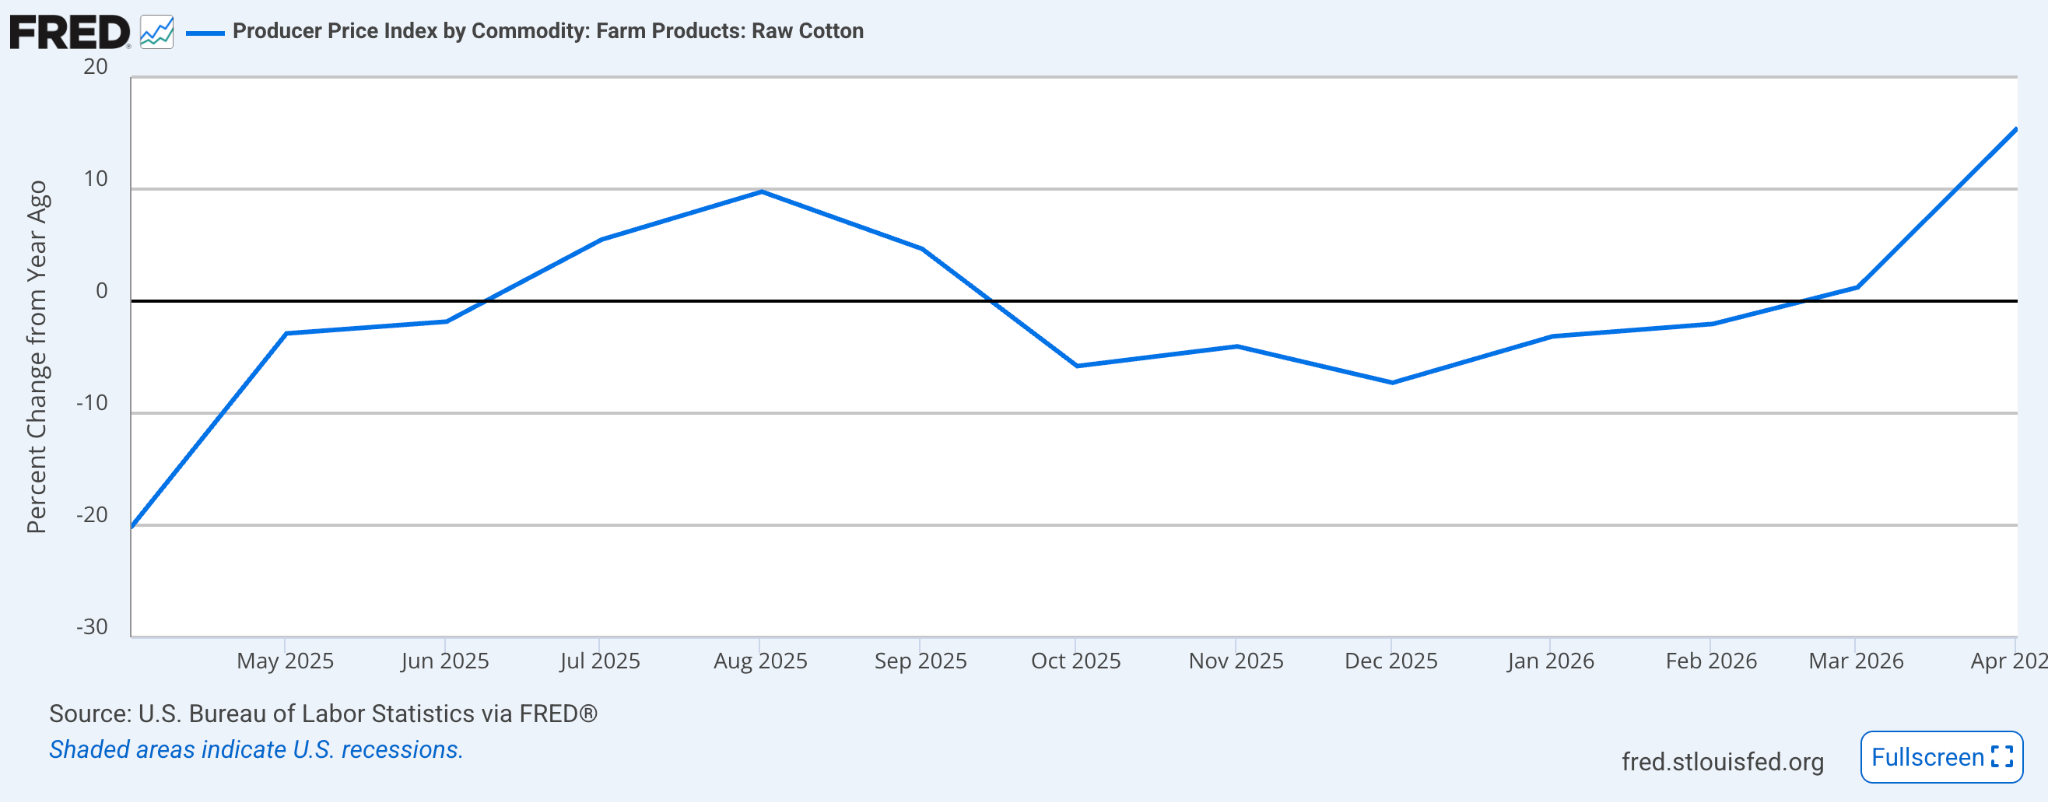
According to the US Department of Agriculture, declining cotton inventories, resilient demand and drought conditions in key growing regions have all contributed to higher prices. According to the report, cotton inventories are projected to decline globally because consumption is expected to exceed production in 2026/27, creating a supply deficit and drawing down stocks. Reflecting these pressures, the US Producer Price Index for cotton increased by 15.5 percent from a year earlier in April.
The broader implication is that supply shocks are continuing to spread throughout the economy. Rising costs for both synthetic and natural fibres are likely to filter into consumer goods prices over time, making it more difficult for inflation to return to the Fed’s 2 percent target.
Ultimately, the challenge for policymakers is becoming more complex. With inflation remaining above target while real incomes and savings buffers continue to erode, the economy may continue to grow on the back of higher-income consumption, but the foundations of that growth are becoming narrower and more vulnerable to future shocks.

Labour Market Remains The Last Pillar Holding Up Resilient Consumer Spending
The US labour market continues to provide the foundation that allows higher-income spending to sustain headline growth, but the supporting indicators beneath it are softening in ways that warrant close attention. As long as employment income remains broadly intact, the divergence between resilient consumption at the top of the income distribution and rising financial pressure at the bottom can persist. Once the labour market turns, that divergence typically narrows quickly.
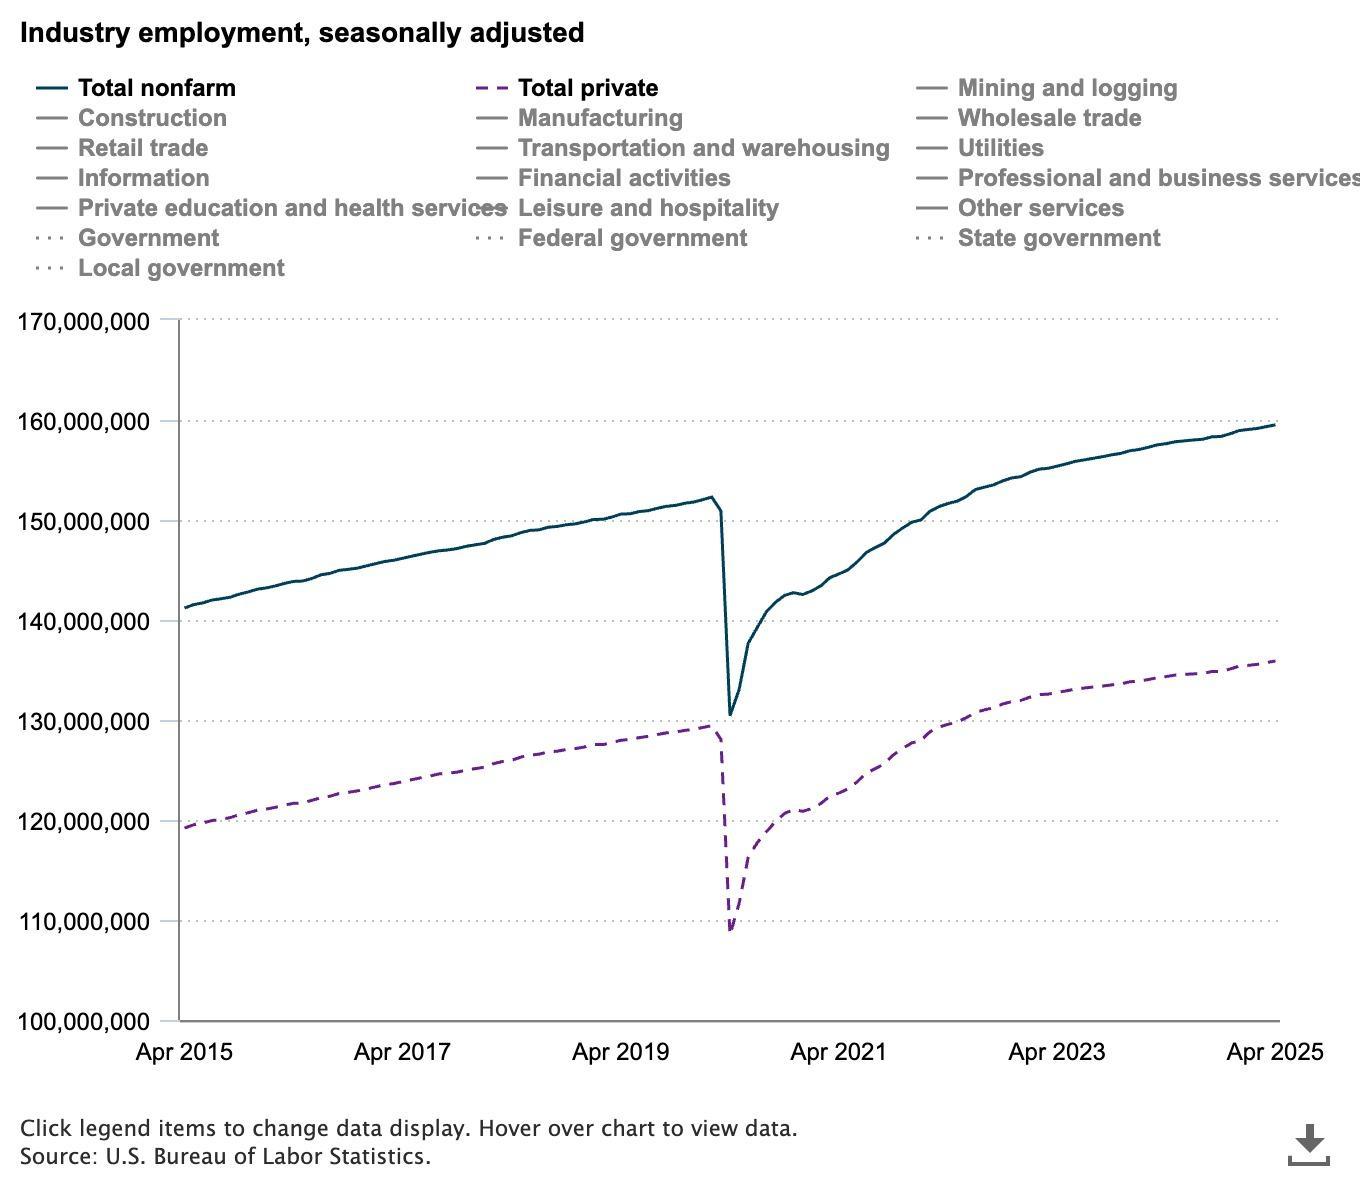
Headline Employment Remains Positive
The most recent release from the Bureau of Labor Statistics (BLS) showed that the US economy added 177,000 nonfarm payroll positions in April, while the unemployment rate held steady at 4.2 percent. Average hourly earnings increased by 0.2 percent on the month and 3.8 percent from a year earlier, broadly consistent with the prior three-month trend. Headline payrolls remain positive, but the pace has slowed compared with the average above 200,000 observed during the first quarter of 2026.
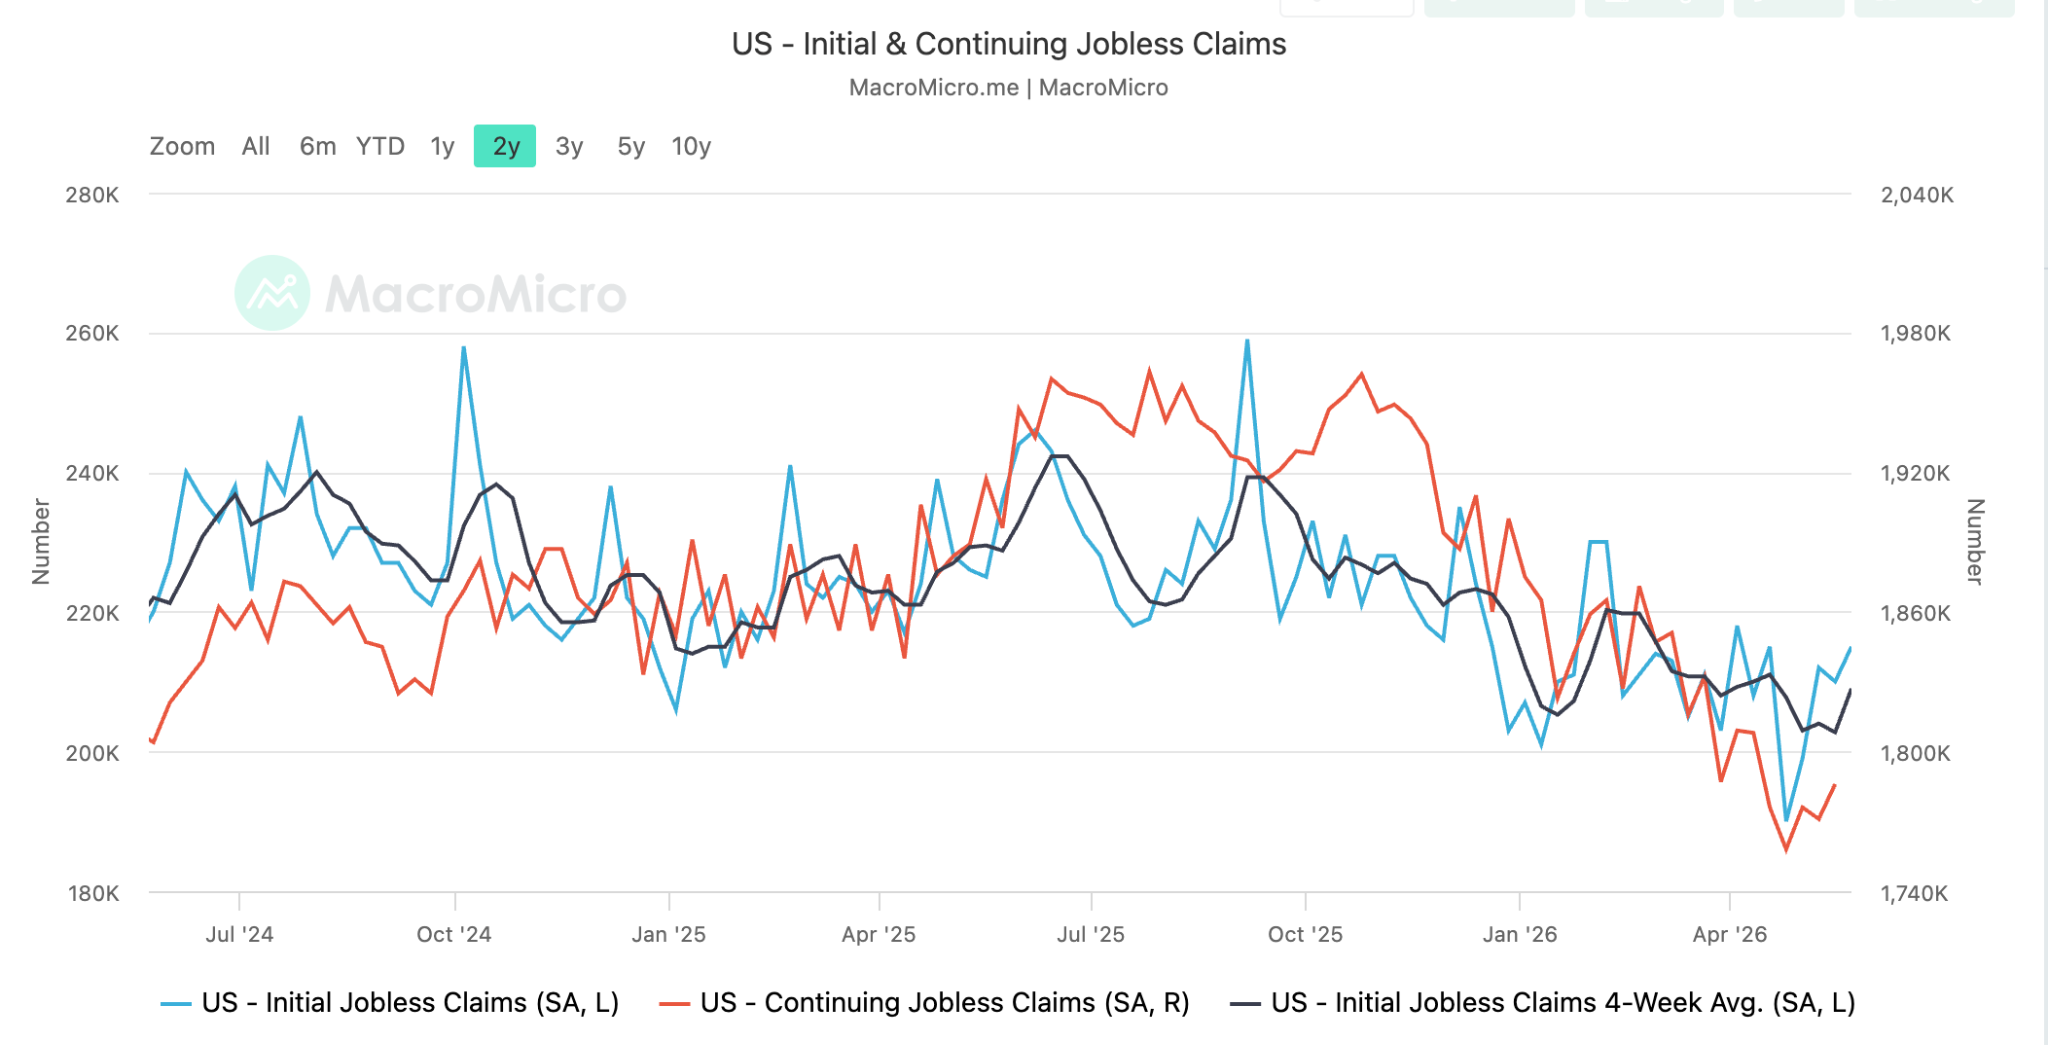
Hiring Intensity Is Fading Beneath The Headline
Weekly initial jobless claims continue to print near 220,000, with the four-week moving average holding close to 215,000. Both readings remain well below the levels that typically accompany recessions. However, continuing claims have moved higher, rising above 1.9 million in mid-May, which suggests that workers who lose their jobs are taking longer to find new ones. This widening gap between initial and continuing claims is an early signal that hiring intensity is fading even while layoffs remain contained.
The same pattern is visible in the Job Openings and Labor Turnover Survey (JOLTS), also published by the BLS. The job openings rate has eased to 4.3 percent, down from 4.8 percent a year earlier, while the quits rate has fallen to 2.0 percent, a four-year low. A declining quits rate reflects reduced worker confidence in finding better-paid positions elsewhere, which historically precedes a slowdown in wage growth and a softening in voluntary mobility across the labour force.
Hiring Is Concentrated In A Narrow Sectoral Base
The composition of payroll gains reinforces the income-concentration pattern identified in the previous section. Hiring continues to be concentrated in healthcare, government and leisure services, while goods-producing sectors, professional services and temporary help have contracted on a three-month basis.
The narrow sectoral base means that a single negative print in any of the resilient categories could pull headline payrolls below the level needed to absorb new entrants to the labour force.
Why The Labour Market Determines The Two-Track Path
The labour market is the variable that determines whether the divergence between higher-income and lower-income spending can continue. Higher-income households generate income from wages, equity compensation and asset returns. Lower-income households rely almost entirely on hourly wages and benefits. A meaningful rise in unemployment would compress income for the cohort already drawing down savings to maintain consumption, while leaving higher-income spending intact only until asset markets reprice the slowdown.
Equally significant is the position of the Federal Reserve (the Fed) within this configuration. Sticky inflation in services and shelter prevents an immediate shift toward easing, while a softening labour market raises the cost of delay. The Fed faces a narrower window in which to act before either inflation expectations drift higher or the unemployment rate begins to rise more decisively.
The labour market is doing the structural work of holding the current expansion together.
Headline employment growth remains positive, but the underlying indicators, including the quits rate, the hiring rate and the duration of unemployment claims, suggest that the load-bearing pillar is being slowly tested. The two-track consumer environment can sustain itself only for as long as that pillar holds. Once it shifts, the foundations of the higher-income spending story will be reassessed quickly by both consumers and markets.

News From the Cryptosphere
Intensifying Political Revolt Against Proposed Crypto Tax Regime in South Korea

South Korea’s planned cryptocurrency taxation framework is facing mounting political and public resistance. A national petition demanding its abolition surpassed 50,000 signatures in just over a week, automatically triggering a formal parliamentary review process. The petition targets the government’s proposal to impose a 22 percent tax on crypto investment gains exceeding 2.5 million won annually, consisting of a 20 percent capital gains levy and an additional 2 percent local tax. The measure, originally legislated under the Income Tax Act administered by the Ministry of Economy and Finance, is currently scheduled to take effect in January 2027 after multiple previous delays.
Critics argue the proposed framework creates a significant disparity between digital assets and traditional financial markets. Under current South Korean tax rules, stock investors are exempt from taxes on annual gains of up to 50 million won (approximately $36,000), while cryptocurrency investors would become subject to taxation once gains exceed 2.5 million won (approximately $1,800). Petitioners argue the gap disproportionately affects younger retail investors, many of whom have turned to digital assets as an alternative avenue for wealth accumulation amid elevated housing costs and subdued wage growth.
The backlash also reflects broader dissatisfaction with South Korea’s crypto regulatory infrastructure. Investors argue authorities are attempting to tax digital assets as mature financial instruments without first implementing comparable investor protections, market surveillance systems, or institutional safeguards present in equity markets.
Concerns surrounding exchange oversight, unfair trading practices, staking income, DeFi activity, and offshore exchange reporting remain unresolved.
Political pressure has intensified further after members of the conservative People Power Party introduced legislation seeking to completely abolish digital asset taxation provisions from the Income Tax Act rather than merely delaying implementation again.
The debate increasingly reflects a larger strategic question for South Korea: whether aggressive taxation risks undermining its position as one of the world’s most active retail crypto markets and accelerating capital migration toward offshore platforms and competing jurisdictions.
The South Korean episode belongs to a broader trajectory of geopolitical competition for jurisdiction in which retail-heavy markets are being forced to choose between treating digital assets as a parallel tax base or as a strategic component of household wealth formation. The outcome will help define whether the country preserves its dominant retail trading footprint or accelerates the structural shift of activity toward jurisdictions with lighter and more harmonised regimes.

Grayscale Delays IPO As Crypto Listing Wave Loses Momentum Amid Weak Market Sentiment

Grayscale, one of the largest digital asset managers, has postponed its planned initial public offering (IPO), underscoring a broader cooling in the crypto listings market as investor enthusiasm for newly public crypto firms fades. The company had previously filed confidentially for a US listing in late 2025 through a draft registration statement reviewed by the US Securities and Exchange Commission (SEC), but is now expected to pause preparations until at least the fourth quarter of 2026.
The decision reflects deteriorating conditions across crypto-linked equities, where weaker trading volumes and underwhelming post-IPO performance have reduced appetite for new offerings. After a wave of successful listings in prior years, market momentum has slowed significantly. Major crypto firms, including Kraken’s parent Payward, Consensys and Ledger, pointed to the same adverse conditions after delaying their own IPO plans.
At the core of the slowdown is a shift in investor sentiment. Public markets are increasingly demanding clearer profitability, more stable cash flows and reduced exposure to crypto volatility before assigning premium valuations. For asset managers like Grayscale, whose revenues are tightly linked to crypto asset prices and fund flows, this creates a difficult timing environment for going public.
The delay highlights a structural issue in the crypto IPO cycle: early enthusiasm tends to cluster around bullish market phases, but fades quickly when liquidity tightens or post-listing performance disappoints.
As a result, companies are becoming more cautious, opting to wait for stronger market conditions rather than risk undervaluation or weak debuts.
The postponement signals that the convergence between crypto firms and traditional capital markets is now subject to the same cyclical discipline that governs other growth sectors.
