

Issue #211:
BTC’s Floor Gives Way
Higher for Longer Meets a Demand Drought
Bitcoin has fallen below the key $61,500 support level, reaching a new bear cycle low of $58,136 on 25 June, 2026. The move reflects weakening spot demand, driven by exchange-traded fund outflows, short-term holder selling, negative gamma pressure, and the collapse of the digital asset treasury channel.
BTC is now down 53.9 percent from its All-Time High and remains below the True Market Mean of $77,000, confirming a bearish structure. While forced selling has eased, renewed spot demand is still needed for a durable bottom. If weakness continues, $53,400 is the key support to watch, with a deeper move toward $40,000 still possible by Q4 2026.
Meanwhile, latest macro and market developments point to a US economy facing easing headline inflation but persistent underlying pressure. Lower oil prices should provide near-term relief to households and may soften the next inflation print, but core inflation remains sticky due to service-sector prices, tariff-related goods pressure, and future demand from artificial intelligence infrastructure and defence spending. This keeps the Federal Reserve cautious, with Treasury markets increasingly pricing a higher-for-longer rate environment and greater policy uncertainty.
At the same time, the US consumer economy is becoming more uneven. Spending remains supported by higher-income households and asset owners, while weaker real wage growth, lower savings, and rising reliance on credit suggest broader consumer fragility. The equity market rally may support aggregate demand, but because stock ownership is highly concentrated among wealthier households, its benefit to the wider economy is limited.

Market Signals
Bitcoin Breaks Under Range Lows Yet Again
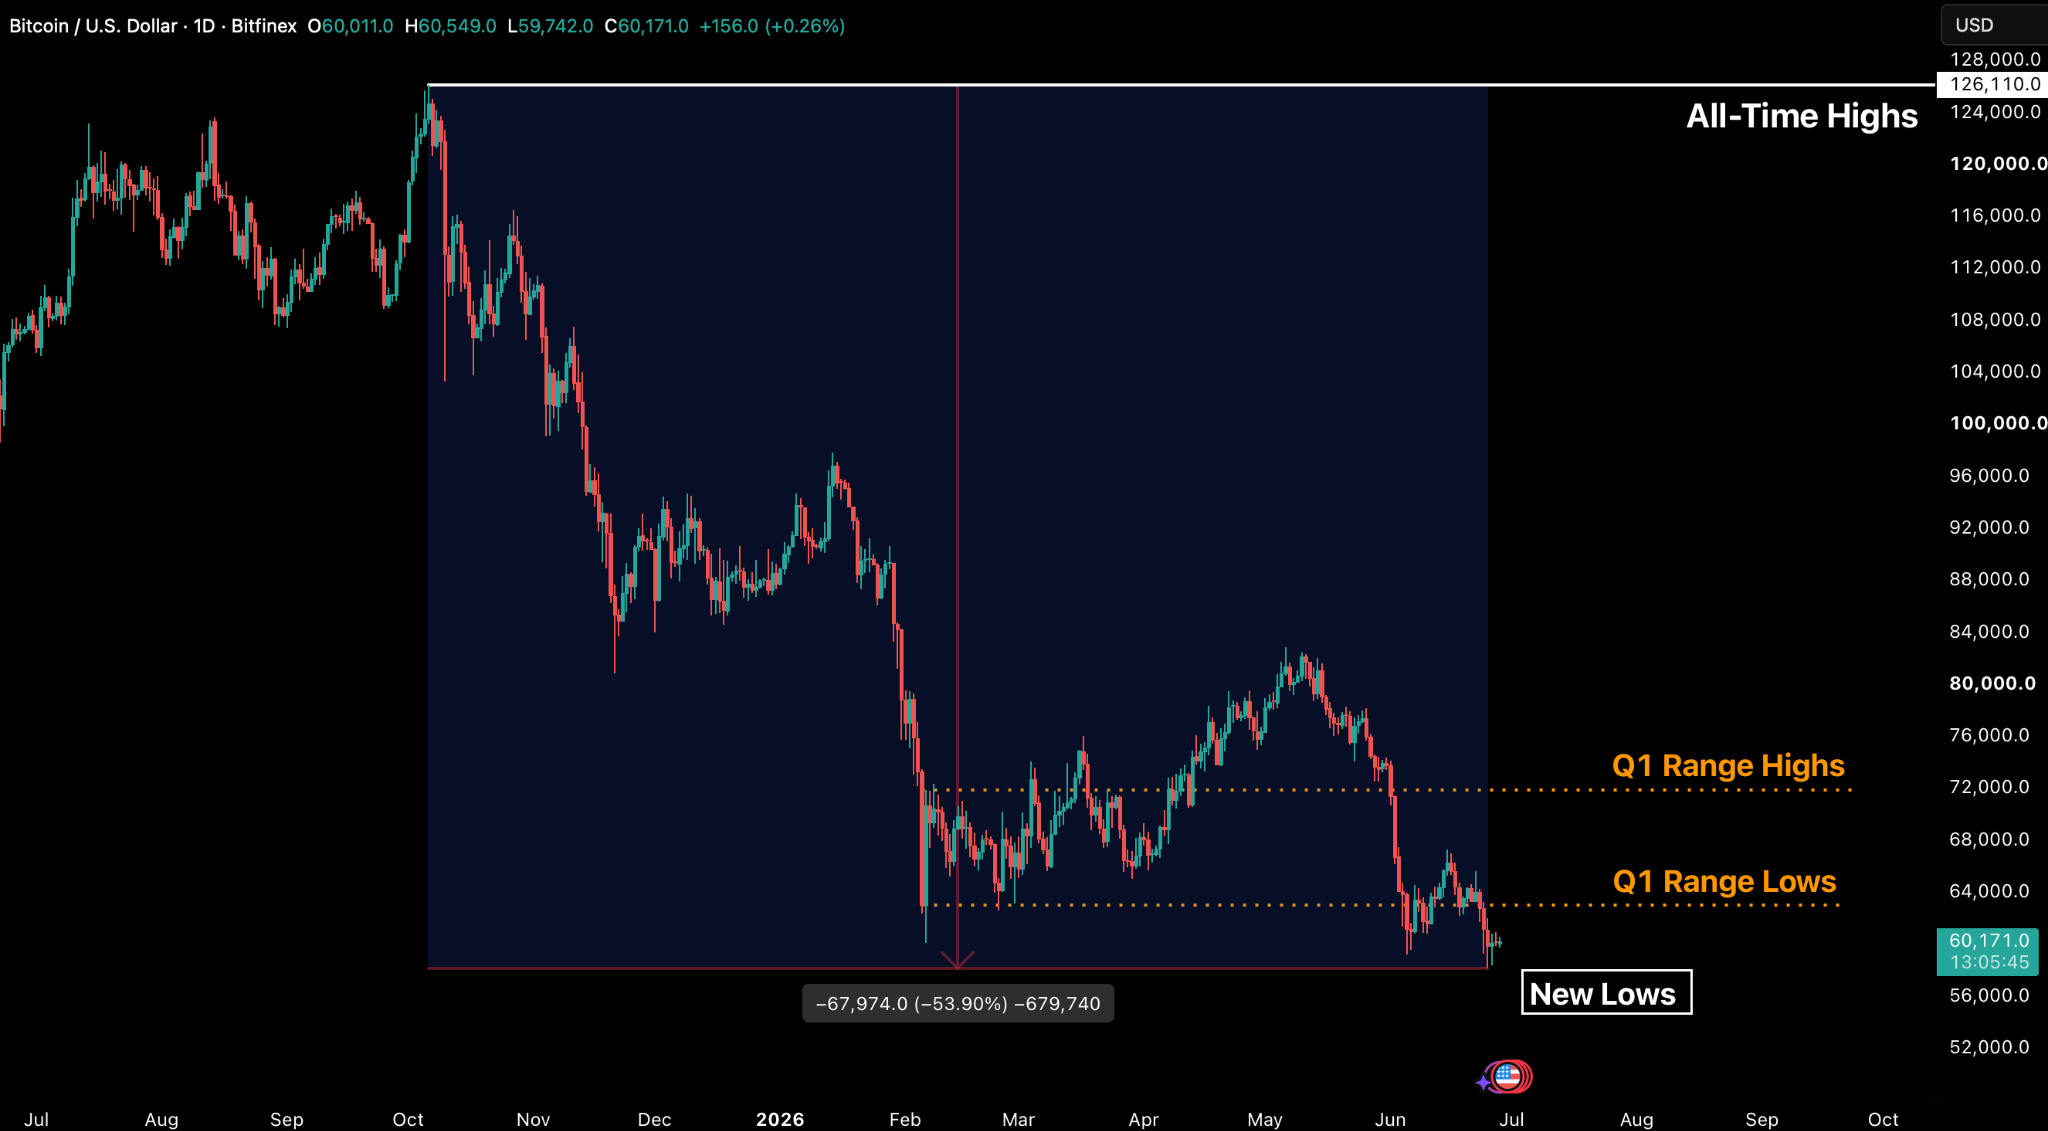
Bitcoin decisively breached the $61,500 support level that was the anchor of the market throughout the first quarter of 2026, hitting a new bear cycle low on 25 June, 2026 of $58,136. Unlike earlier retracements toward $60,000, which were primarily characterised by large-scale liquidations and flushes in open interest, this move reflects a structural exodus in the spot markets.
The downturn has been exacerbated by a confluence of significant ETF outflows, constant selling from short-term holders realising losses and downside volatility being fuelled by forced dealer hedging in a negative gamma environment. Simultaneously, the collapse of the DAT/treasury channel effectively stalled new capital raises, blunting a crucial demand channel for BTC, and leaving the market without its primary demand engine and pushing the total drawdown from its All-Time High (ATH) to 53.9 percent.

That said, any forced selling pressure in BTC (in the form of long liquidations, traders getting stopped out and a negative gamma environment leading to dealers selling into weakness) has subsided in scale. But the market awaits a resurgence of spot demand to be able to find a floor and potentially turn higher.
Given past four year cycles, and the diminishing returns and drawdowns pattern that BTC and crypto have usually followed, the current 53.9 percent drawdown from ATH could potentially deepen before a cycle bottom is found.
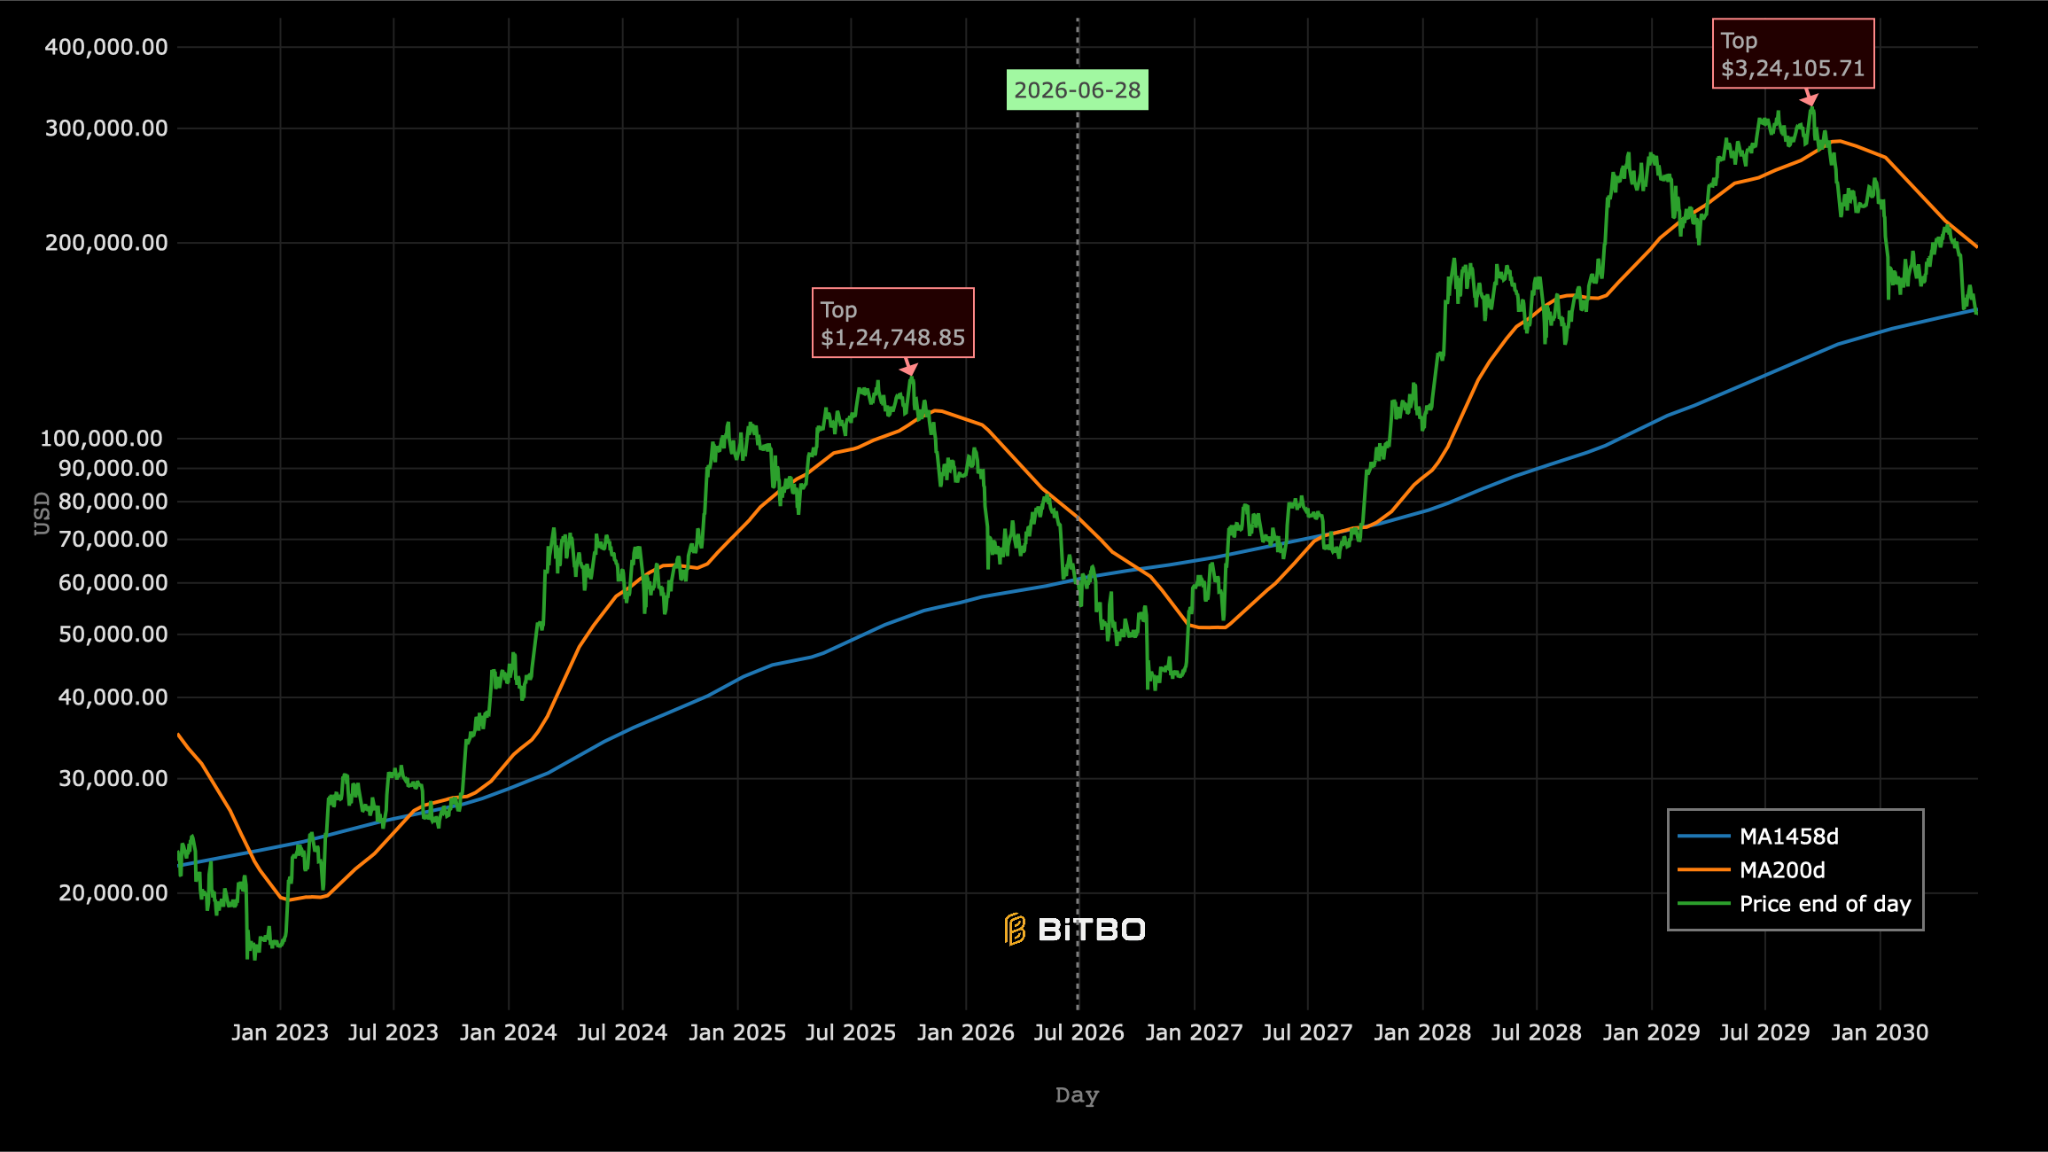
The 2022 bear market lows were 78 percent below the cycle highs at around $69,000. The 2018 bear market lows were ~86 percent below the cycle highs near $20,000. Mapping past models on the current cycle and factoring for similar drawdowns and time horizons between tops and bottoms, BTC’s move lower could extend to about $40,000 which would be roughly a 68 percent drawdown from the current all time highs. Overall, if the cycle estimates factoring in price moves relative to the moving averages also play out, BTC could find its cycle bottom in Q4 2026.
Where are BTC’s structural levels?
Currently trading near $60,000, the key structural levels for BTC remain the same, given that the outflow streak on ETFs has not broken and the demand channel via treasury products has not made a comeback.
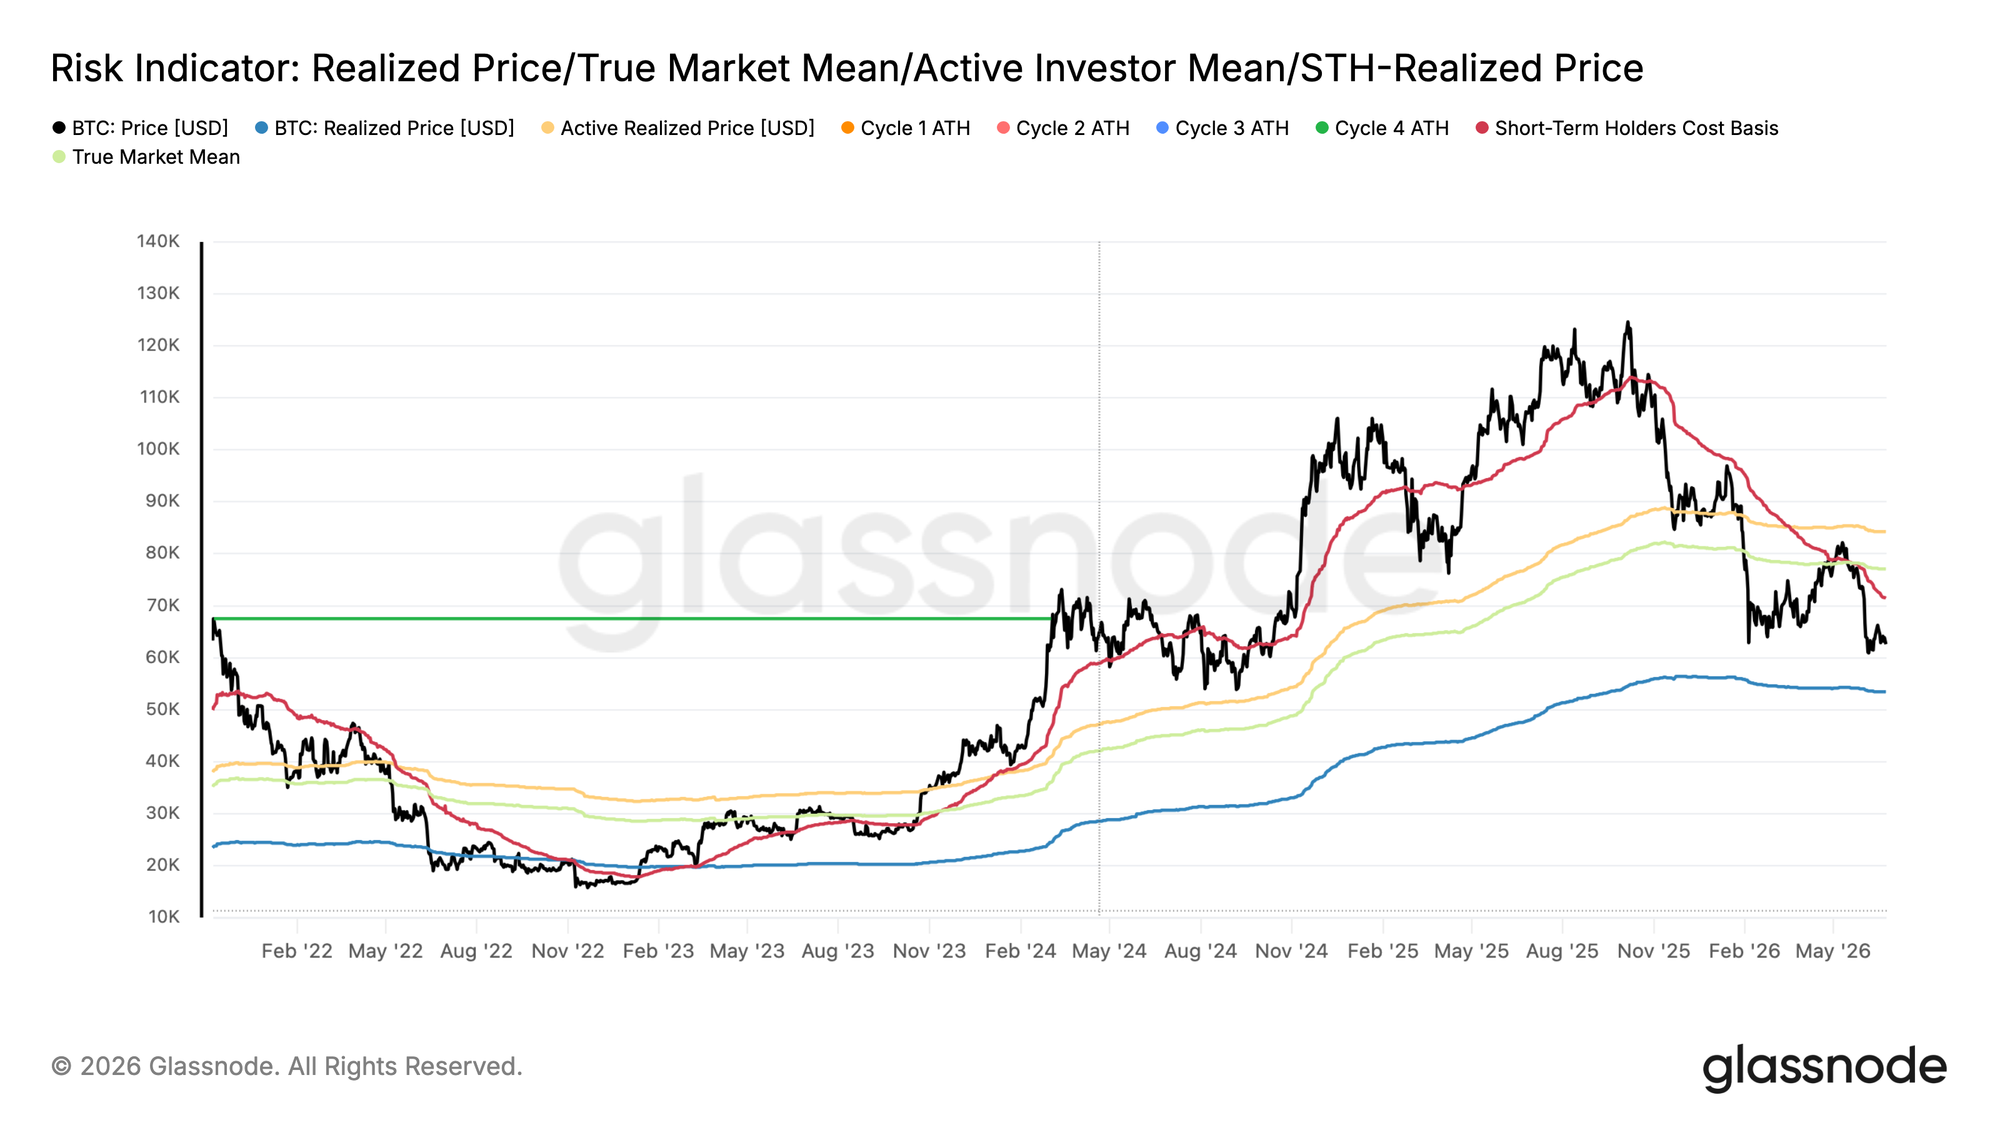
A test of one of these key levels, and the reaction, would be more telling of future direction than order flow which is currently quite stagnant. BTC remains positioned significantly beneath the True Market Mean of $77,000. This level represents the average cost basis for active investors excluding miners and serves as the critical demarcation between bullish and bearish market regimes. Trading at a 23 percent discount to this threshold, the price action continues to be defined by a structural bear market environment.
An important shift is occurring as the Short-Term Holder Cost Basis has compressed to $71,400. This decline indicates that fresh capital is entering the market well below the cycle’s broader mean, a development that is typically constructive for cyclical bottoming. This transition suggests that new accumulation is taking place at valuations that are increasingly decoupled from the previous period of market overheating.
Supply captured during this phase of the cycle often demonstrates higher levels of conviction, as the potential downside risk for these newer participants is narrower compared to the overhang of supply from higher entries.
Should a macro catalyst trigger another leg lower in the near term, the Realised Price at $53,400 stands as the most compelling technical floor within the current bear market range. That reading is grounded in on-chain cost basis dynamics and typical short-term holder behaviour.
Going by historical four-year cycle, even after accounting for diminishing returns, a final wick into the $40,000s before sustained recovery remains entirely possible.

General Macro Update
Oil Relief Masks A Stickier Inflation Problem
The sharp fall in oil prices suggests that headline inflation has likely peaked, and June inflation data could show a clear easing in month-on-month price growth. However, core inflation remains the more important risk, as service prices, tariff-driven goods inflation, artificial intelligence infrastructure demand, and future defence spending may keep price pressure above the Federal Reserve’s target.
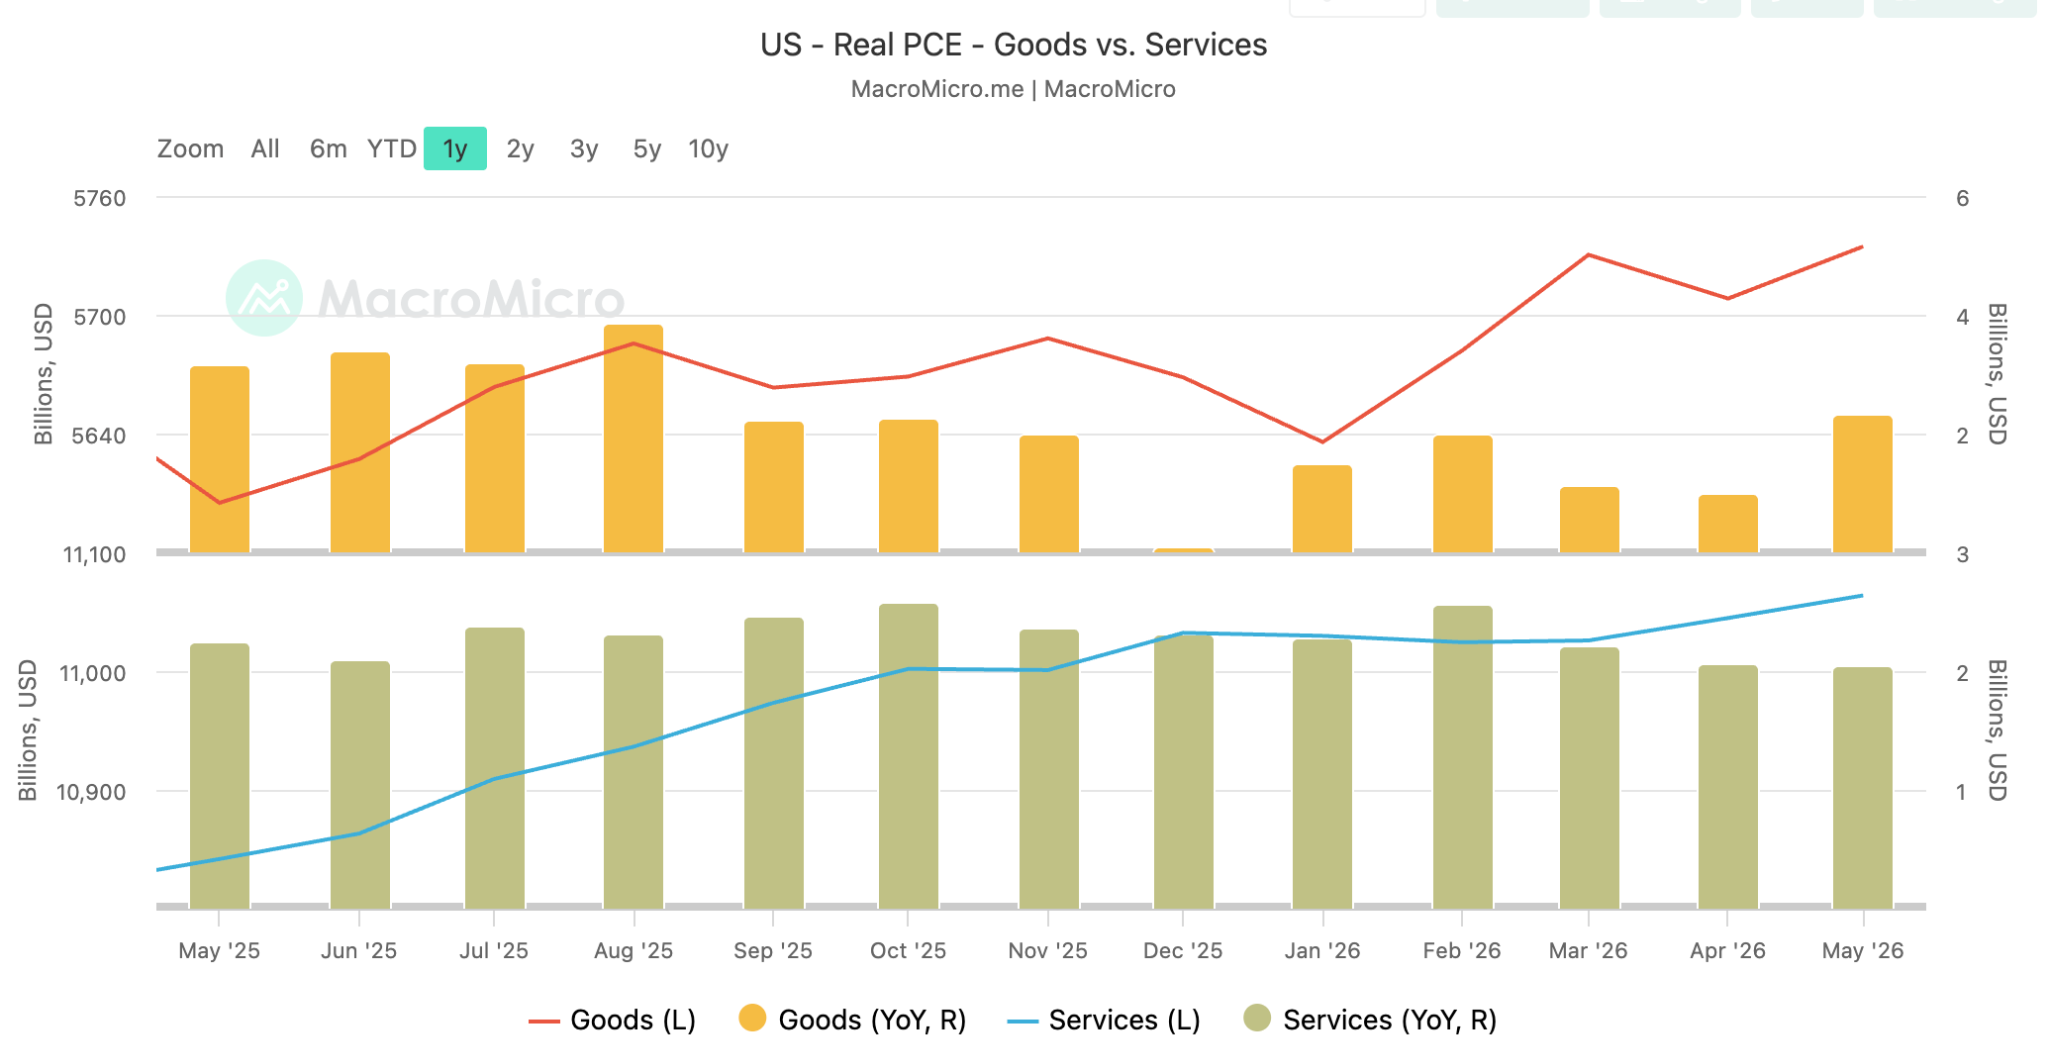
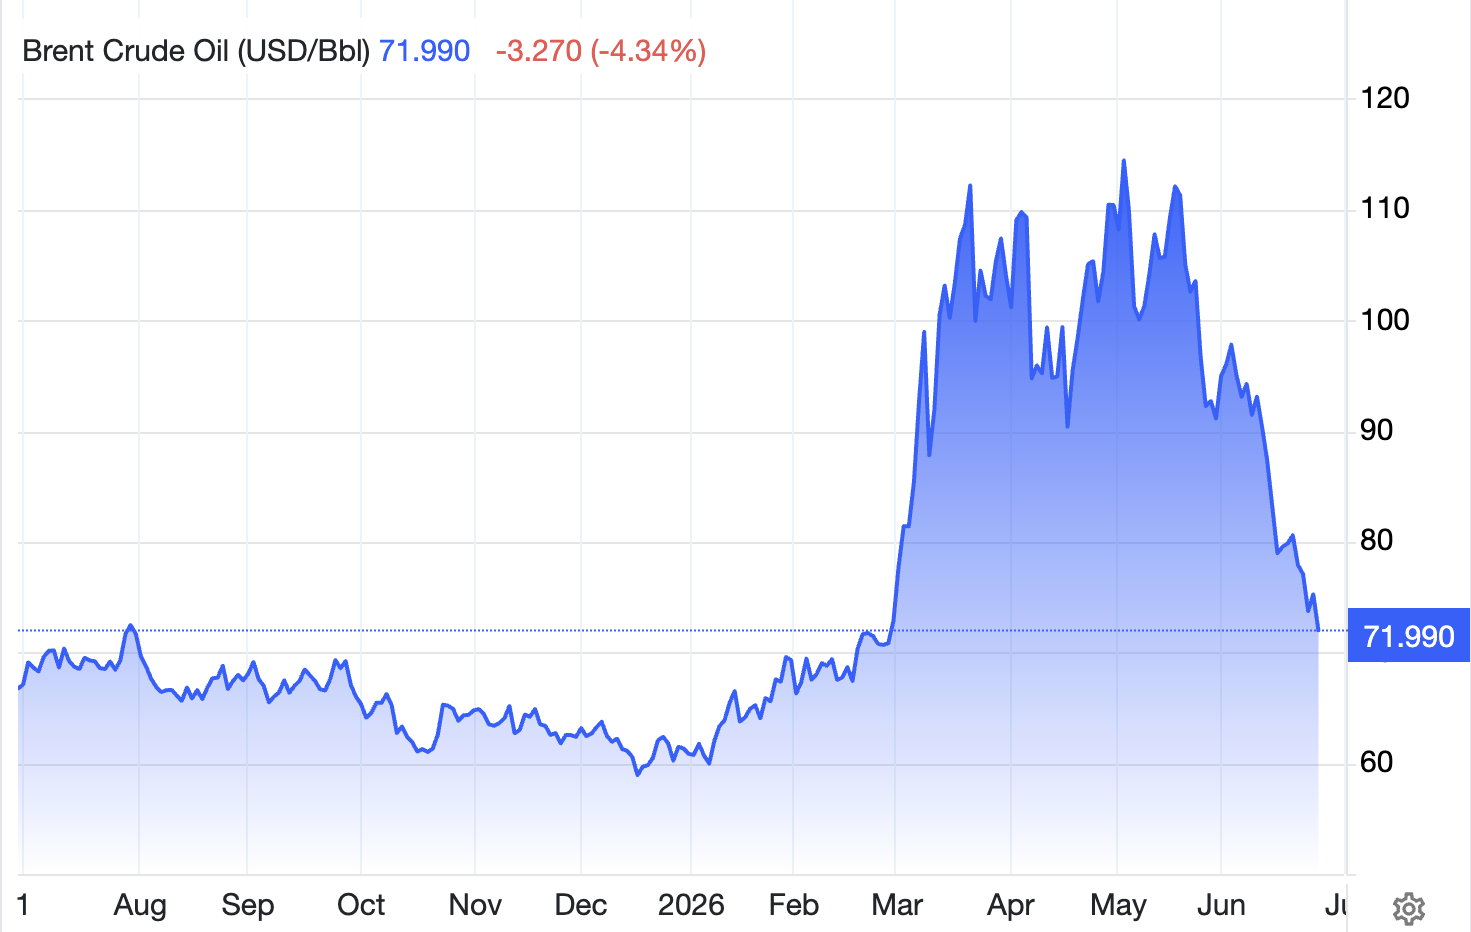
The Personal Consumption Expenditures (PCE) Price Index showed headline inflation rising 0.4 percent month on month in May and up 4.1 percent from a year earlier. However, those headline figures may already look dated because West Texas Intermediate crude oil prices have fallen sharply from their May peak, which should feed into lower energy and gasoline costs in the coming months.
The problem is that headline inflation can fall while underlying inflation stays firm. Headline inflation includes volatile items such as food and energy, while core inflation removes them to show the broader price trend. In May, core inflation rose 0.3 percent month on month and 3.4 percent from a year earlier. On a three-month annualised basis, core inflation is running at 4 percent, which points to price pressure that may not fade quickly.
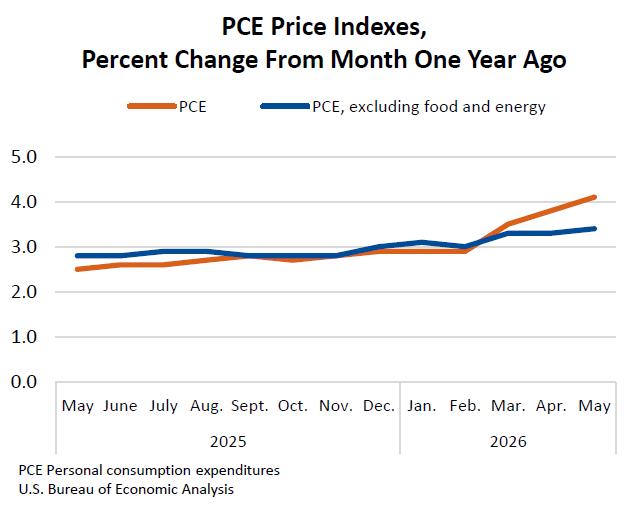
Several forces explain why core inflation may remain difficult to bring down. Service-sector prices are still sticky, goods prices are rising as tariffs move through the economy, and producer-price data has shown pipeline pressure building before it reaches customers. Goods prices rose 5.4 percent from a year earlier in May, with durable goods up 3.3 percent and non-durable goods up 5.6 percent. Service prices rose 3.8 percent, up from 3.5 percent previously.
The artificial intelligence investment cycle could add another layer of pressure. Data centres, chips, power equipment, construction inputs, and specialised labour all require scarce resources. At the same time, the US is expected to increase defence spending to rebuild weapons stockpiles and invest in drone and robotic warfare. That demand may compete with technology companies for some of the same industrial and electronic inputs.
Lower oil prices should still help households. Energy costs have been a large burden, and a decline in crude prices should eventually lower gasoline prices. This would support lower-income households in particular, as they spend a larger share of income on essentials. However, lower energy prices alone do not mean inflation will return quickly to pre-Iran war levels or to the Federal Reserve’s 2 percent target.
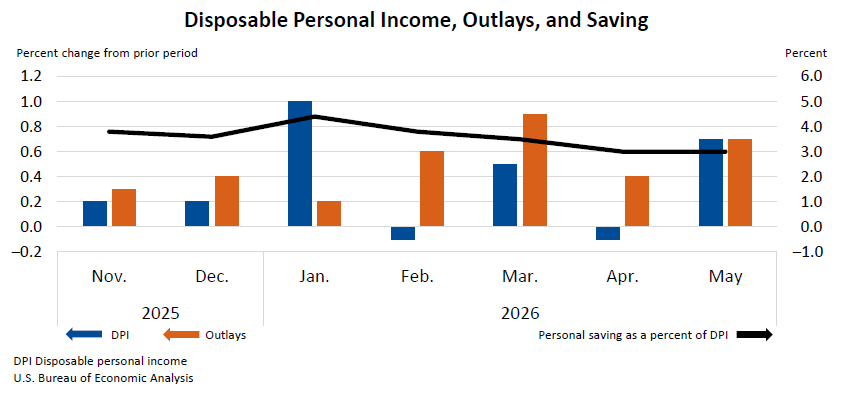
Household data also shows a softer consumer backdrop beneath the headline spending figures. Nominal personal spending rose 0.7 percent in May, but inflation-adjusted income rose only 0.3 percent. The savings rate fell to 3 percent in May from 4.4 percent in January, which suggests that households used savings and credit to maintain spending. Real wage growth also weakened, with inflation-adjusted wages down 0.7 percent from May 2025.
This matters because weaker real income can reduce demand. Demand destruction means people or businesses cut spending because prices become too high or income fails to keep up. The US appears to have gone through a temporary phase of demand destruction that likely peaked in May, while Europe and Asia show more structural weakness. That broader global slowdown, combined with more oil and refined product supply from the Persian Gulf, helped pull Brent crude prices back towards pre-war levels and also brought West Texas Intermediate close to those levels.
The policy implication is clear. The Federal Reserve may find it difficult to justify near-term rate cuts if core inflation remains firm, even if headline inflation falls in June. Monetary policy may still be too supportive for the current inflation backdrop, which means the debate could shift from when the Fed will cut rates to whether rates should stay higher for longer.
Overall, the fall in oil prices should bring near-term relief and may produce a softer headline inflation print in June. But the deeper inflation story is less comforting: core pressure remains persistent, the goods and services mix is still firm, and future demand from artificial intelligence and defence spending could keep inflation above target. That leaves markets facing a more hawkish Federal Reserve in the second half of the year, with a rate hike looking more plausible than a rate cut if underlying inflation fails to ease.

Treasury Markets Price A More Uneven Economy
US markets are now caught between two forces: a Federal Reserve that looks more hawkish under Chair Kevin Warsh, and an economy that depends more heavily on higher-income households and asset owners. Treasury yields show that investors expect rates to stay higher for longer, while the stock market rally is giving only limited support to wider consumer spending.
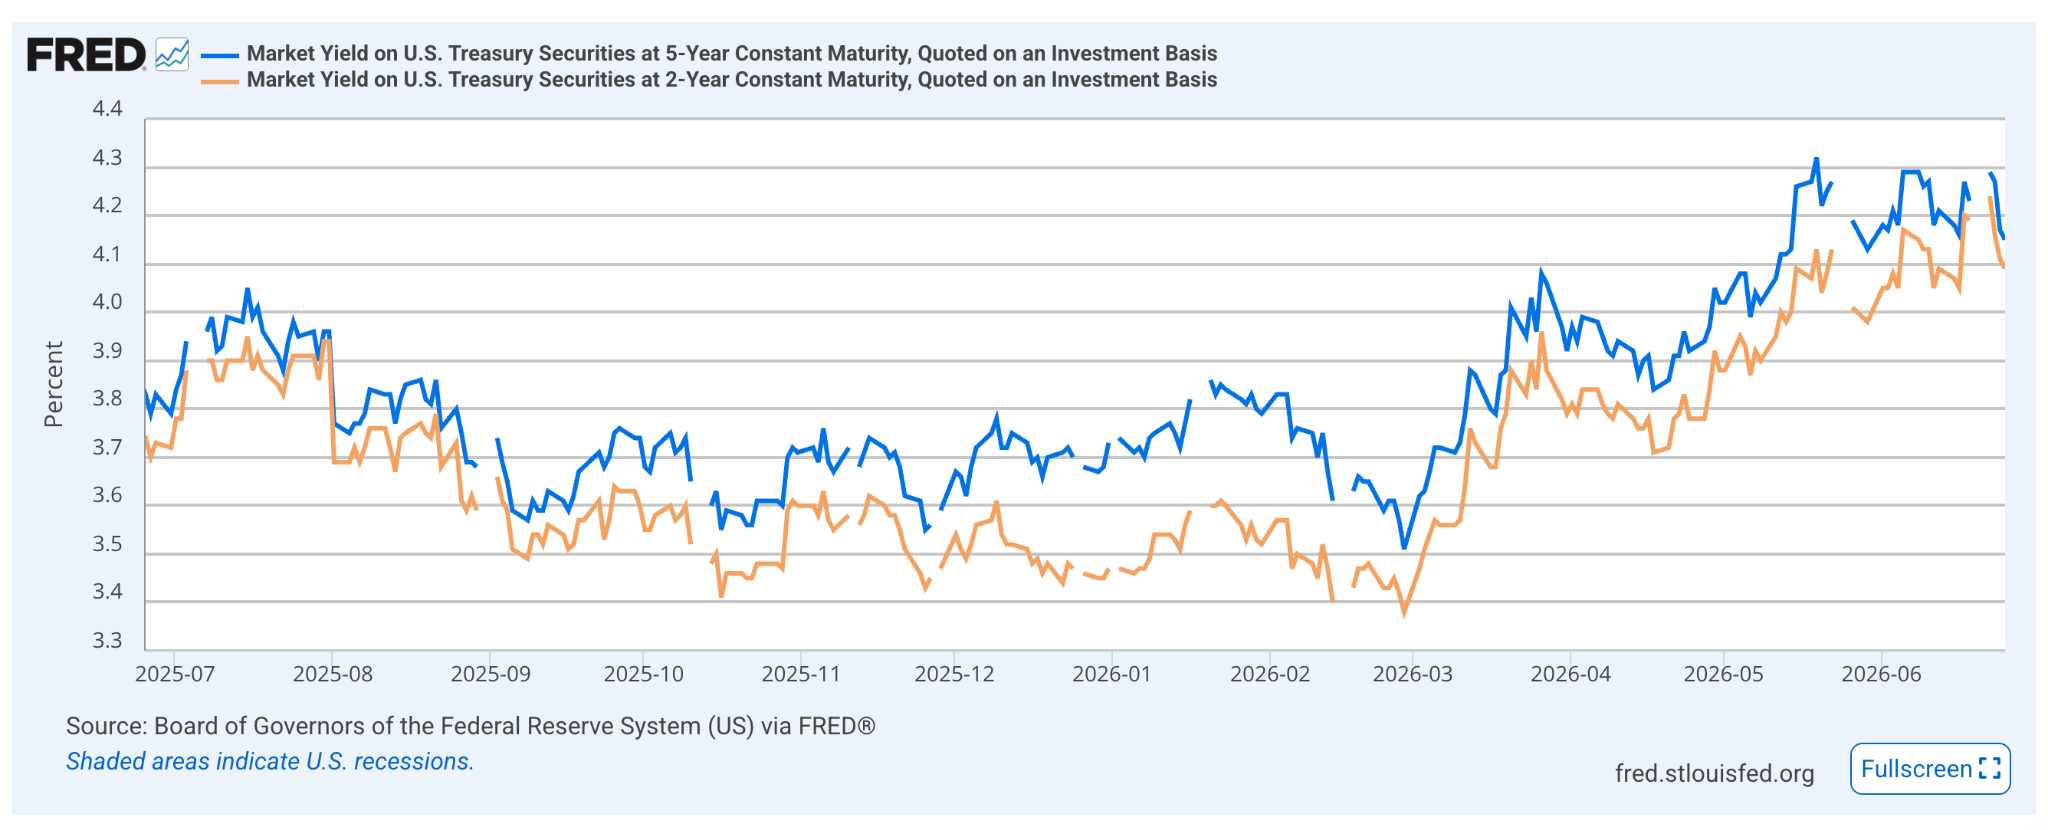
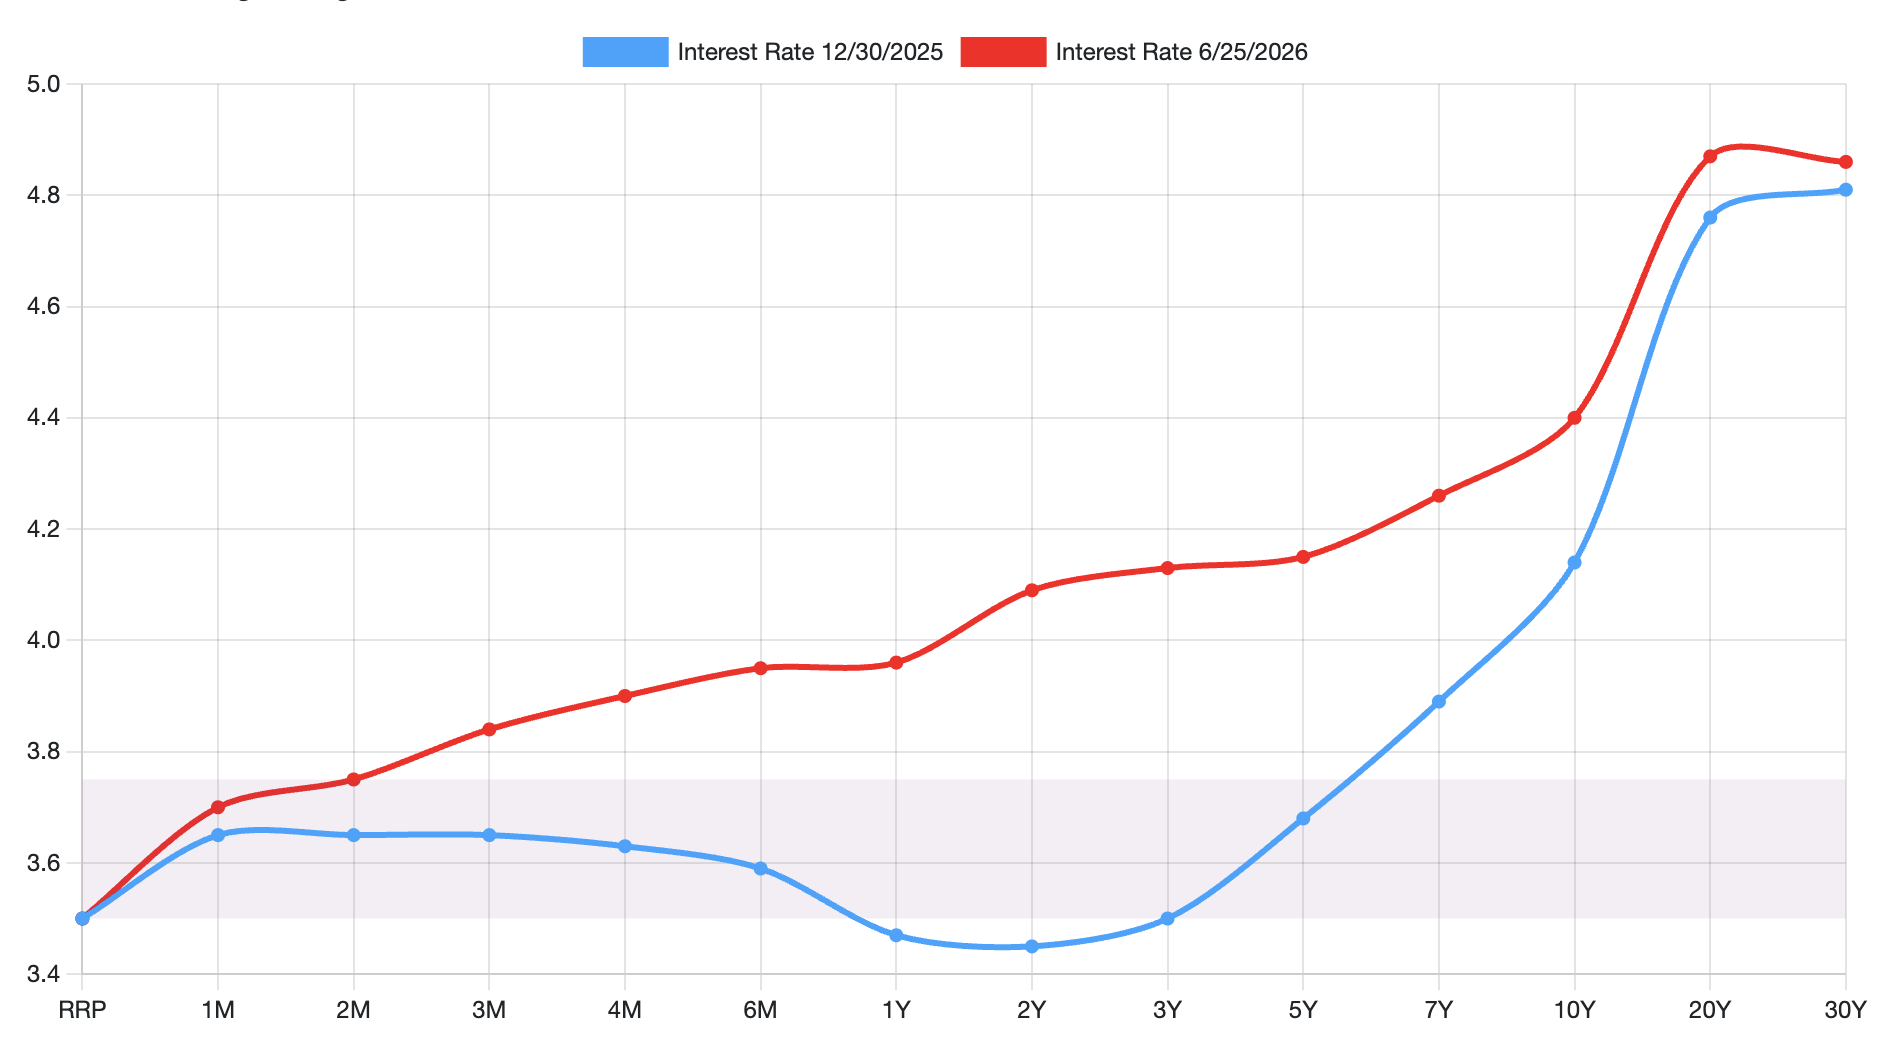
The US Treasury yield curve, tracked through Treasury market data and shaped by Federal Reserve policy expectations, has moved sharply since the last trading day before the Iran war on June 12 2025. Two-year Treasury yields are up 85 basis points to 4.23 percent, while five-year yields are 78 basis points higher to 4.29 percent. The move shows that investors now see a higher chance of a Federal Reserve rate increase as early as September.
Short-term Treasury yields often move when investors expect the Federal Reserve to raise or hold interest rates, because short-dated bonds are closely tied to the expected path of policy rates.
This shift to a more hawkish Fed under Warsh has made the central bank harder for Wall Street to forecast. Rate futures now price at least one rate increase by early autumn and another increase next year. Some asset managers disagree. They argue that inflation may ease as oil prices fall, wage growth slows, and housing remains weak. This split has created a wide gap between bank forecasts. Citi expects the next move to be a 25 basis point cut in October, while BofA Securities expects three 25 basis point rate increases this year.
The Treasury yield curve reflects this uncertainty, with short-term yields rising faster than long-term yields, resulting in a flatter curve than usual, and signalling that investors expect tight monetary policy to last.
The 10-year Treasury yield is at 4.37 percent, while the 30-year yield is at 4.95 percent. These long-term yields have eased from recent highs, even as front-end yields remain elevated. That pattern suggests that investors are not simply pricing stronger growth. They are also weighing the risk that higher rates and sticky inflation may weaken economic activity over time.
This matters for businesses and households. Lower long-term yields can help long-term investment and the mortgage market, because borrowing costs for these areas often follow longer-dated bonds. But the fall in long-term yields can also point to concern about future growth. In simple terms, investors may believe the Federal Reserve will keep policy tight enough to slow the economy.
A deeper policy shift may also be driving rising uncertainty. The Federal Reserve appears to be moving away from explicit forward guidance.
Less forward guidance may also result in an increase in the term premium. The term premium is the extra return investors demand to hold longer-term bonds instead of rolling over short-term bonds. When policy is harder to predict, investors may ask for more compensation for that risk. This means long-term yields can stay elevated even if inflation later cools.
The sharp pullback in real spending caused by high prices is easing, even as a longer-term concentration of spending persists. When the spike in energy prices
pushed living costs above what incomes could absorb, households cut back; now that oil has fallen back towards pre-war levels, that squeeze is fading. The US economy is becoming more dependent on higher-income consumers. The top 20 percent of earners account for between 36 percent and 57 percent of total consumer spending, depending on the measure used. This creates an increasingly two-track economy, where asset owners and higher-income households continue to do well while middle- and lower-income households face more pressure.
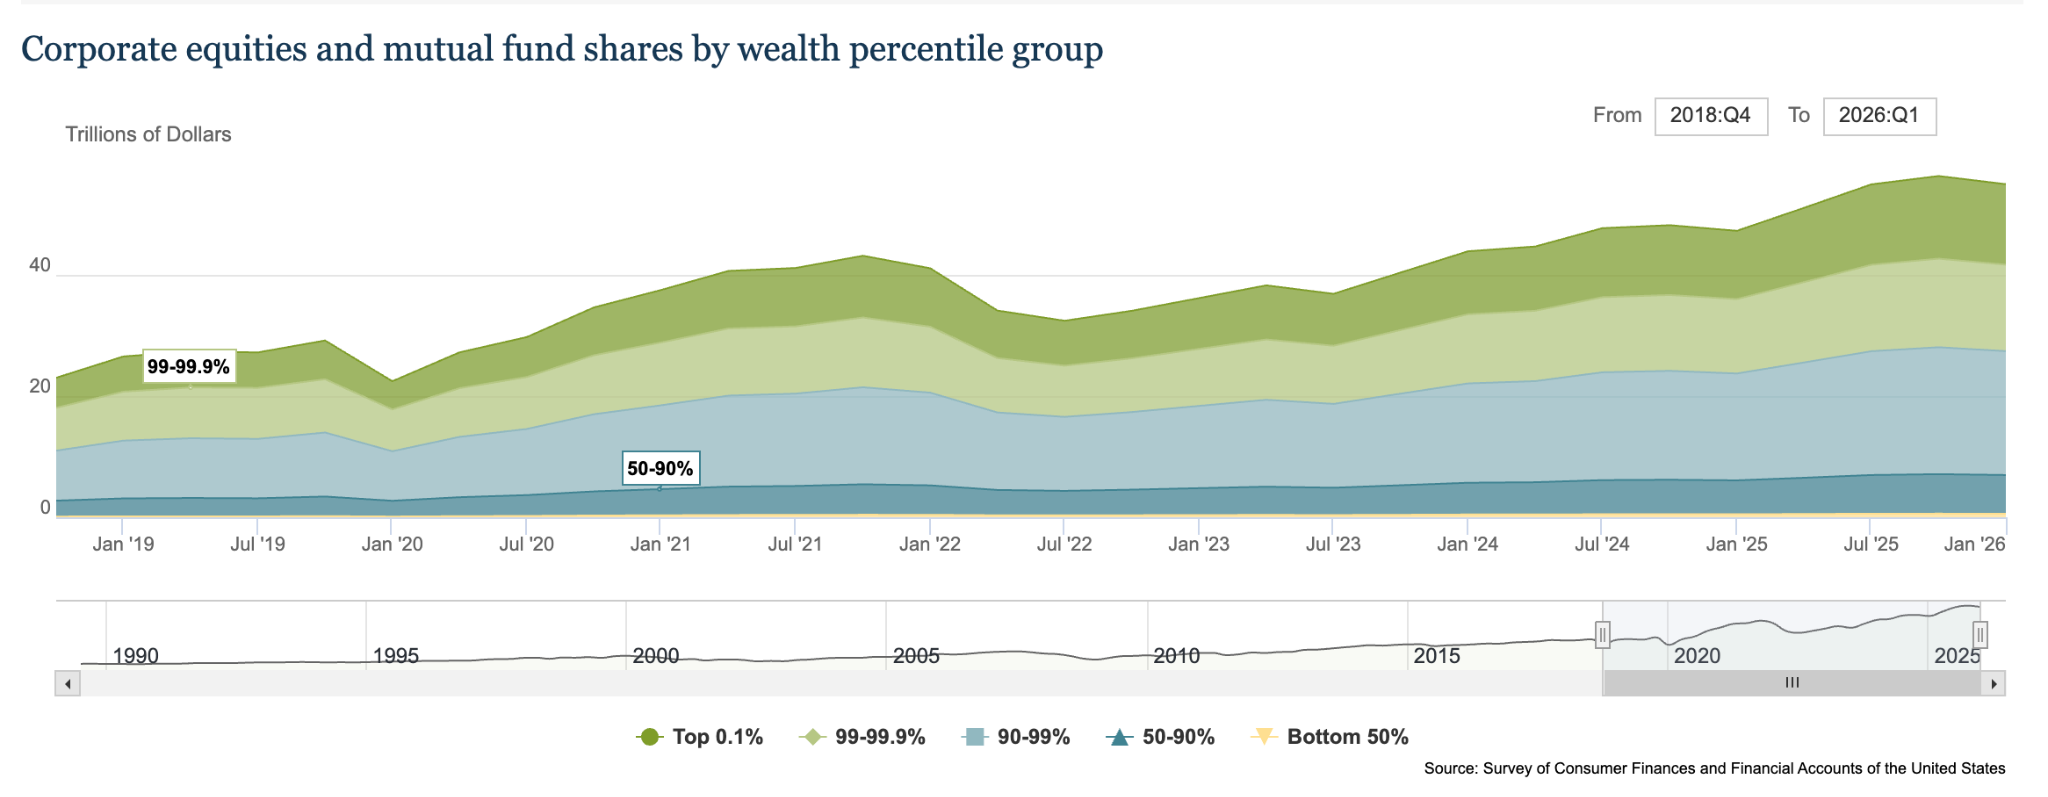
The stock market rally has reinforced this divide rather than reduced it. The top 10 percent of households owns about 87 percent of corporate equities and mutual fund shares, a pool worth about $46 trillion as of the first quarter of 2026. Because stock ownership is so concentrated, most of the spending effect from rising equity prices flows to higher-income households.
This is called the wealth effect. It means people may spend more when the value of their assets rises. But equities are a weak channel for turning gains into spending. A recent Federal Reserve study estimates that households spend only about 1.18 cents of each additional dollar of equity wealth, less than a quarter of the roughly 5.15 cents they spend out of each dollar of housing wealth. A stock market rally therefore lifts consumption by far less than its headline size suggests.
The distribution matters too. The same study finds that lower-income households spend more out of each dollar of equity wealth, about 1.49 cents for the bottom 80 percent, than the wealthy, at about 0.65 cents for the top 20 percent. Yet because the top 20 percent owns the overwhelming majority of stocks, most of the spending a rally does generate still flows to households that are already asset-rich. The group with the higher propensity to spend simply holds too little equity to move the broader economy. As a result, the rally does not carry the wider consumer economy. It mainly strengthens the part of the
economy that already has the most asset exposure.
This creates a difficult backdrop for the Federal Reserve. Higher stock prices can support headline economic activity, but they do not solve the pressure faced by down-market consumers. At the same time, sticky inflation keeps the Fed cautious. If the central bank focuses too much on aggregate spending, it may overlook how uneven that spending has become.
The policy conclusion is clear. Treasury markets are pricing a Federal Reserve that may keep rates high or even raise them, while the economy shows signs of dependence on a narrow group of asset-rich consumers. That combination points to more volatility, a flatter yield curve, and a harder investment environment. Unless inflation eases more clearly or growth weakens enough to force a policy shift, markets may need to adjust to a longer period of higher uncertainty and tighter financial conditions.
What Would Prove This Wrong
The central view here is that sticky core inflation keeps the Federal Reserve hawkish and rates higher for longer. Several developments would undercut that view. A sharp deterioration in the labour market, with rising jobless claims and slower payroll growth, would shift the Fed’s attention from inflation to growth and revive the case for cuts. A faster than expected cooling in core services and shelter inflation, confirmed across consecutive PCE and trimmed mean prints, would suggest underlying pressure is fading rather than persisting. A broad fall in goods prices as tariff effects wash out, rather than build, would weaken the cost-push argument. And if the recent decline in oil feeds through to lower inflation expectations and softer wage demands, the second-round pressure the thesis for higher rates for longer relies on may not appear. A renewed flight to safety that pulls long-term yields sharply lower would also challenge this framing, even if the front end stays elevated.
What To Watch Next
The June inflation data report is becoming the single most important near-term release. A soft headline print alongside firm core readings would confirm the need to keep rates elevated, while broad-based easing in both would challenge it. Producer price data also matters for pipeline pressure that has not yet reached consumers. On the consumer side, watch real wage growth, the savings rate and credit usage for signs that spending is being sustained by borrowing rather than income. For policy, the September FOMC meeting is the first realistic window for a move, and the path of front-end Treasury yields and rate futures will signal whether markets are leaning towards a hike or a cut. Oil remains the key swing factor: a renewed spike from the Persian Gulf would quickly revive headline inflation and harden the Fed’s hawkish stance.