

Issue #219:
Can BTC Sustain Its Rally?
Bitcoin Hits $77,000 As Shorts Capitulate on Liquidity and ETF Flows Increase
Bitcoin broke out of the range that had held it since 8 July, clearing $71,000 on 20 August and closing the week above $77,000, up roughly 22 percent, in a month that historically carries a negative median return. The trigger was the US Treasury’s announcement of enlarged bond buybacks, and the mechanics were a record short squeeze: roughly $3 billion of crypto short positions were liquidated in two days, while bitcoin futures open interest still rose, a sign of fresh positioning entering rather than the market simply deleveraging. The breakout carried the price through the cost basis of every buyer from the past six months, turning the summer’s overhead supply into support. The caveat is participation: bitcoin moving on the network sits near eight-year lows, so the durable version of this rally still needs real volume to arrive after the squeeze.
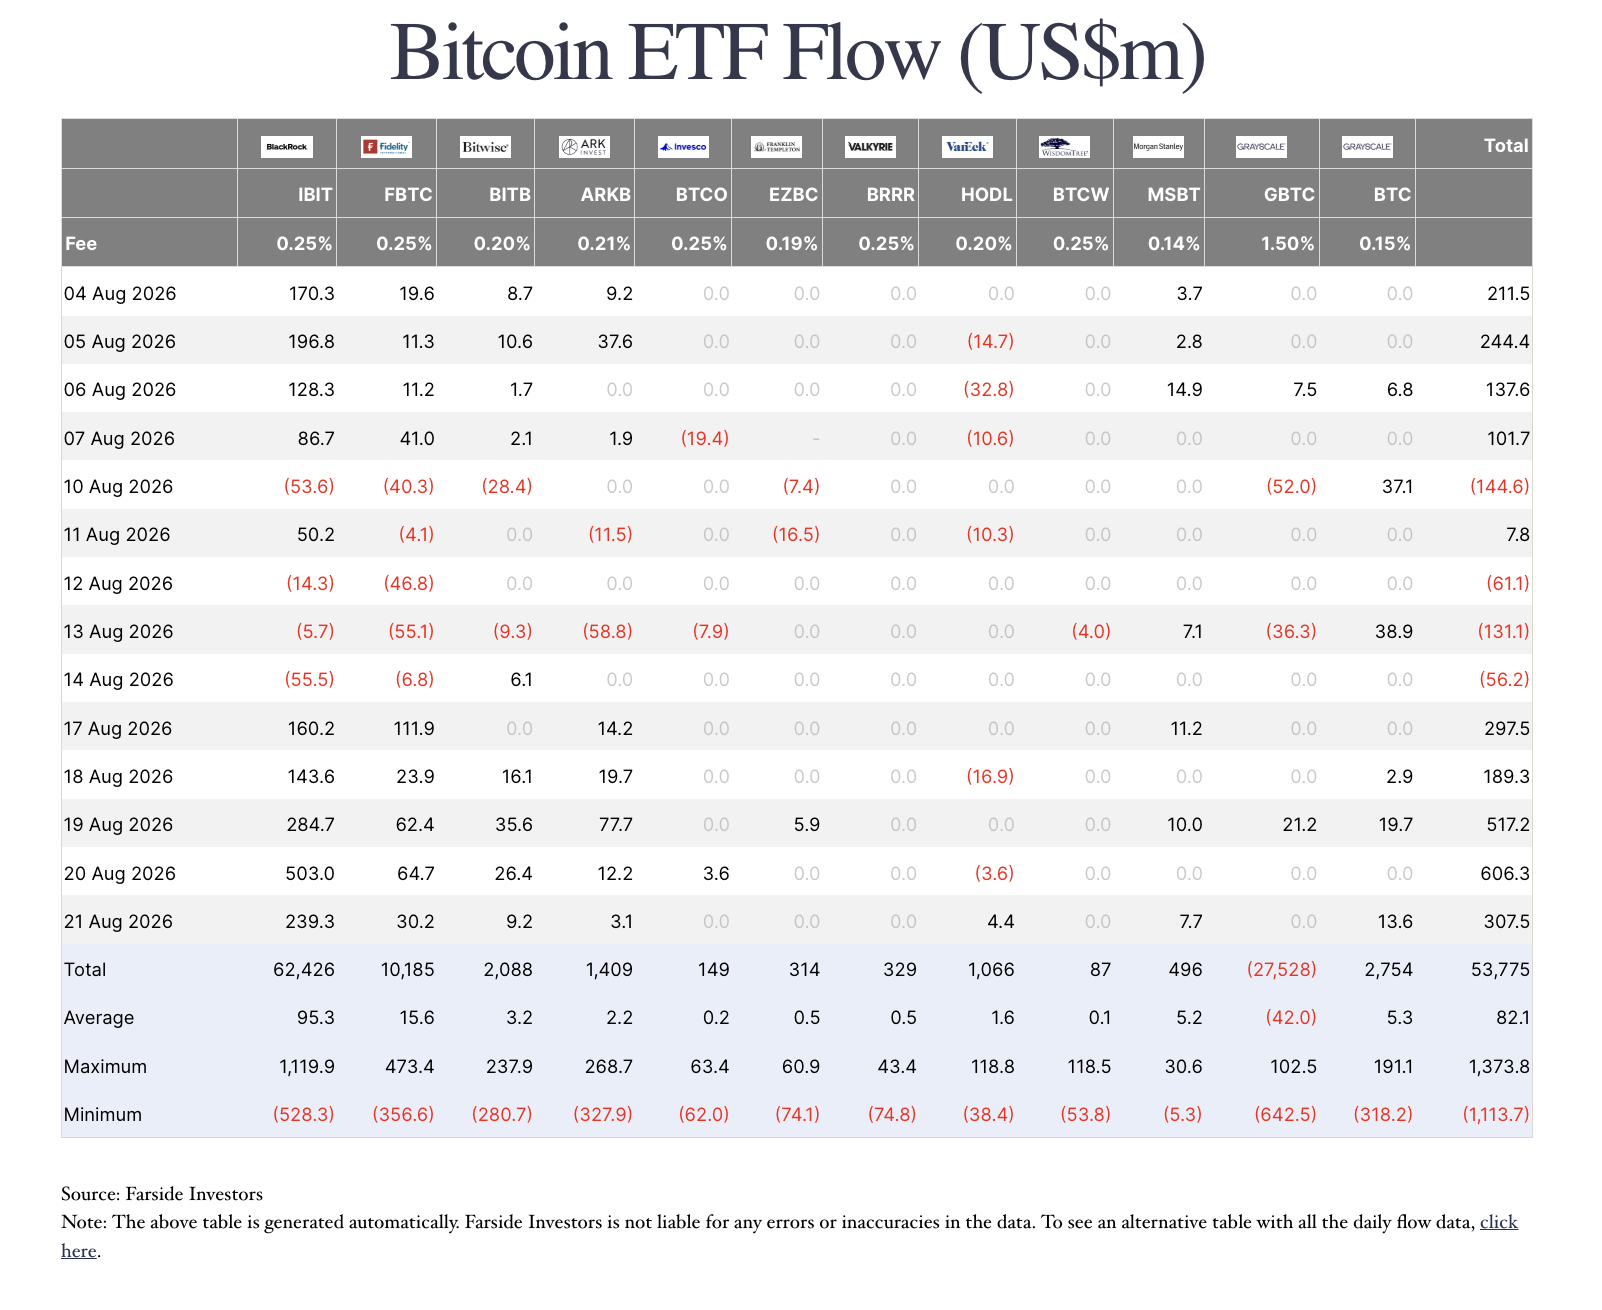
US spot Bitcoin ETFs took in roughly $1.92 billion, their strongest week since October 2025, with inflows triggered by the buyback announcement. Strategy, the largest corporate holder of BTC, reported no purchases and no sales, ending its selling streak with BTC’s spot price now above its $75,385 average cost for the first time since it started to sell last month.
Strategy’s filing this week is an important swing factor: renewed selling into strength restores the overhead pressure, a return to buying puts both ETF and corporate buyers on the same side for the first time since June.
The Treasury’s buyback announcement only brought volatility to the market, not regime change. The 20-year yield, the centre of the maturities the Treasury is buying, fell 11 basis points and gave a quarter of that back the next day, while the two-year did not move at all, the fingerprint of a supply event rather than a shift in rate expectations. Yields are high because investors are charging the government more to fund its deficit, and that is not a problem the Fed’s policy rate can fix easily.
Housing shows why the transmission that matters now runs through markets, not activity. Mortgage rates fell for a second straight week — buyer traffic was flat, builders cut prices for a 16th consecutive month, and starts fell 12.4 percent even as permits rose. With the construction channel frozen and financial conditions still loosening through a 19-year high in the 30-year yield, whatever easing arrives will transmit through asset prices and liquidity rather than through the real economy, and crypto sits at the far end of exactly that pipe.

Market Signals
Record Short Squeeze and Liquidity Signal Sends Bitcoin To The Upper $70,000s
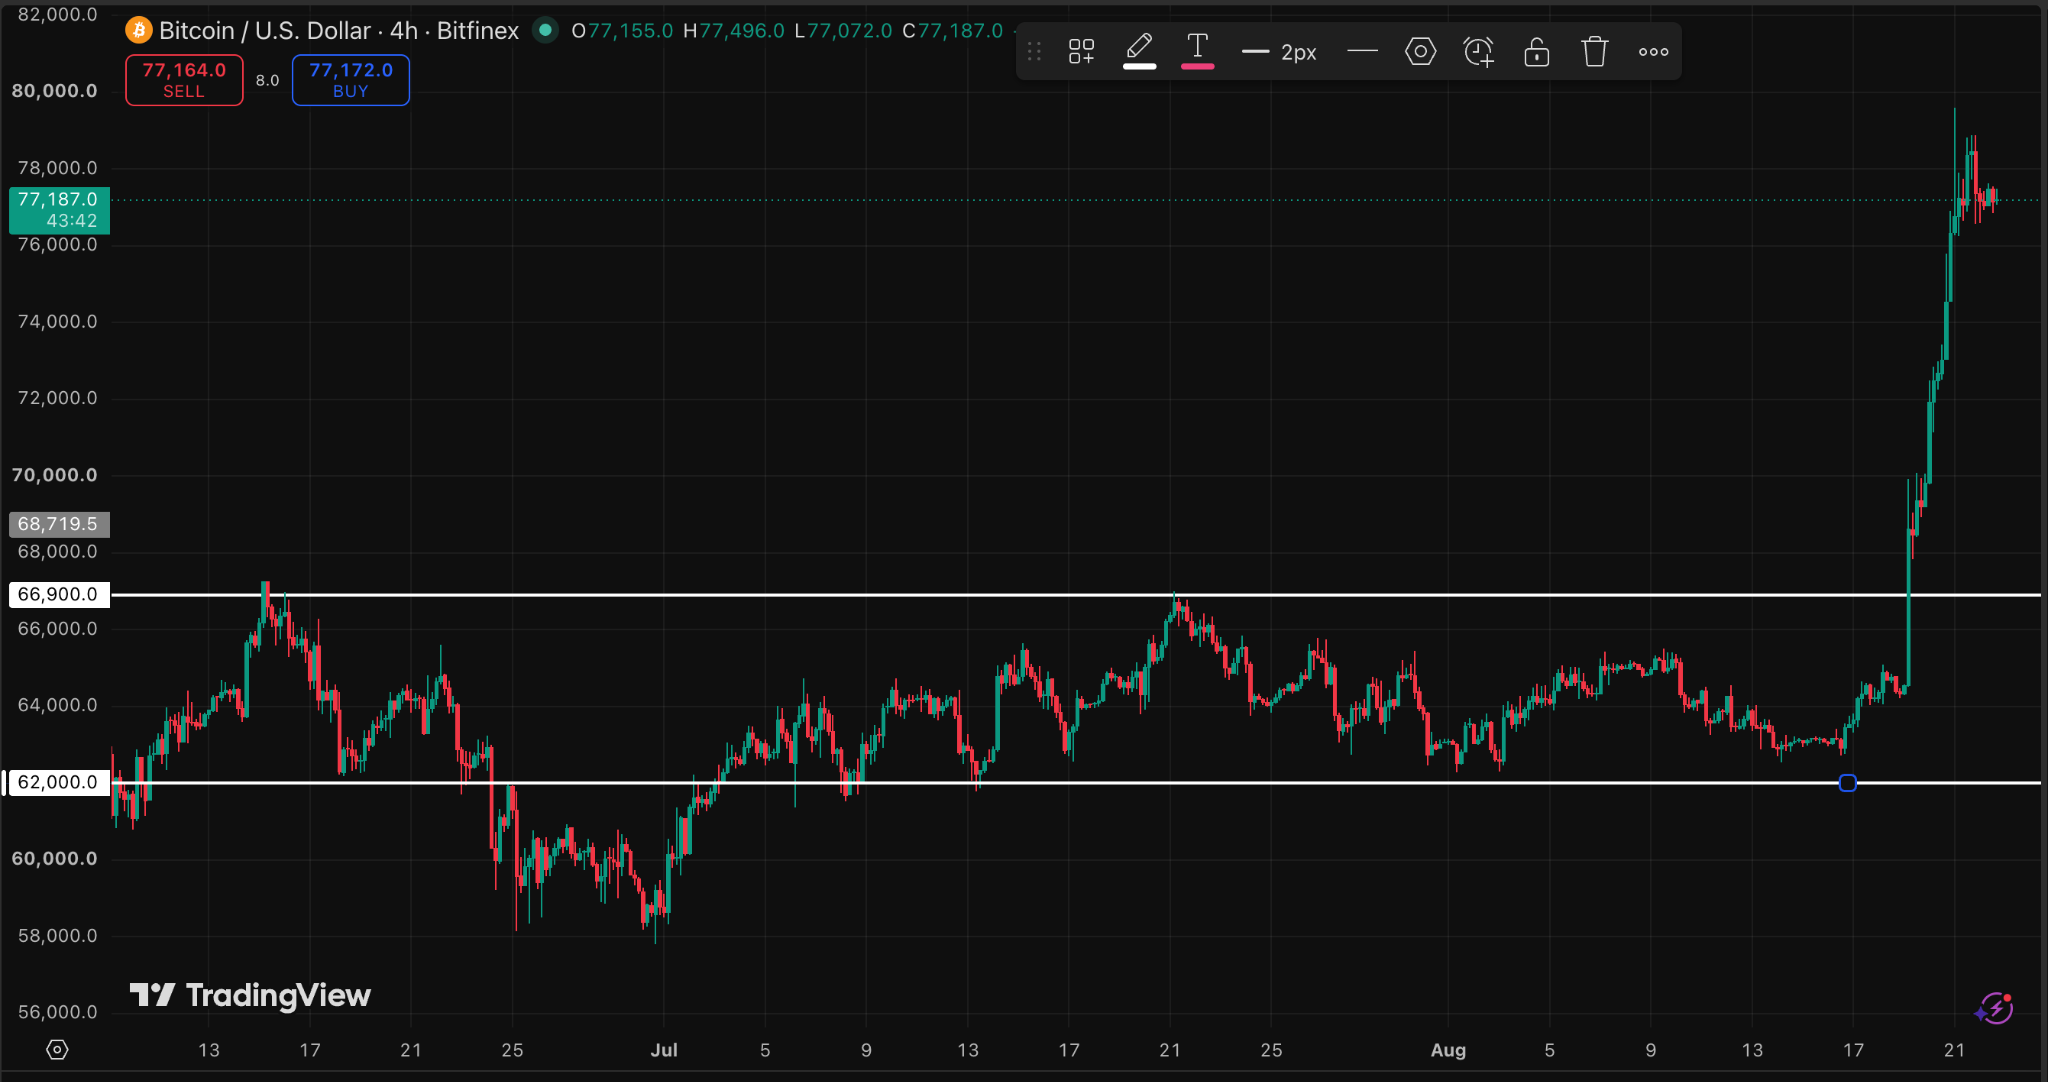
Bitcoin broke out of the $62,000 to $65,000 range that had contained the price since 8 July, clearing $71,000 on 20 August and extending into the upper $70,000s, up roughly 22 percent on the week, against an August seasonality that carries a median return of minus 6.99 percent since 2013.
The main catalyst was the US Treasury’s announcement of enlarged long-end buybacks, the first concrete liquidity-support signal of the quarter.
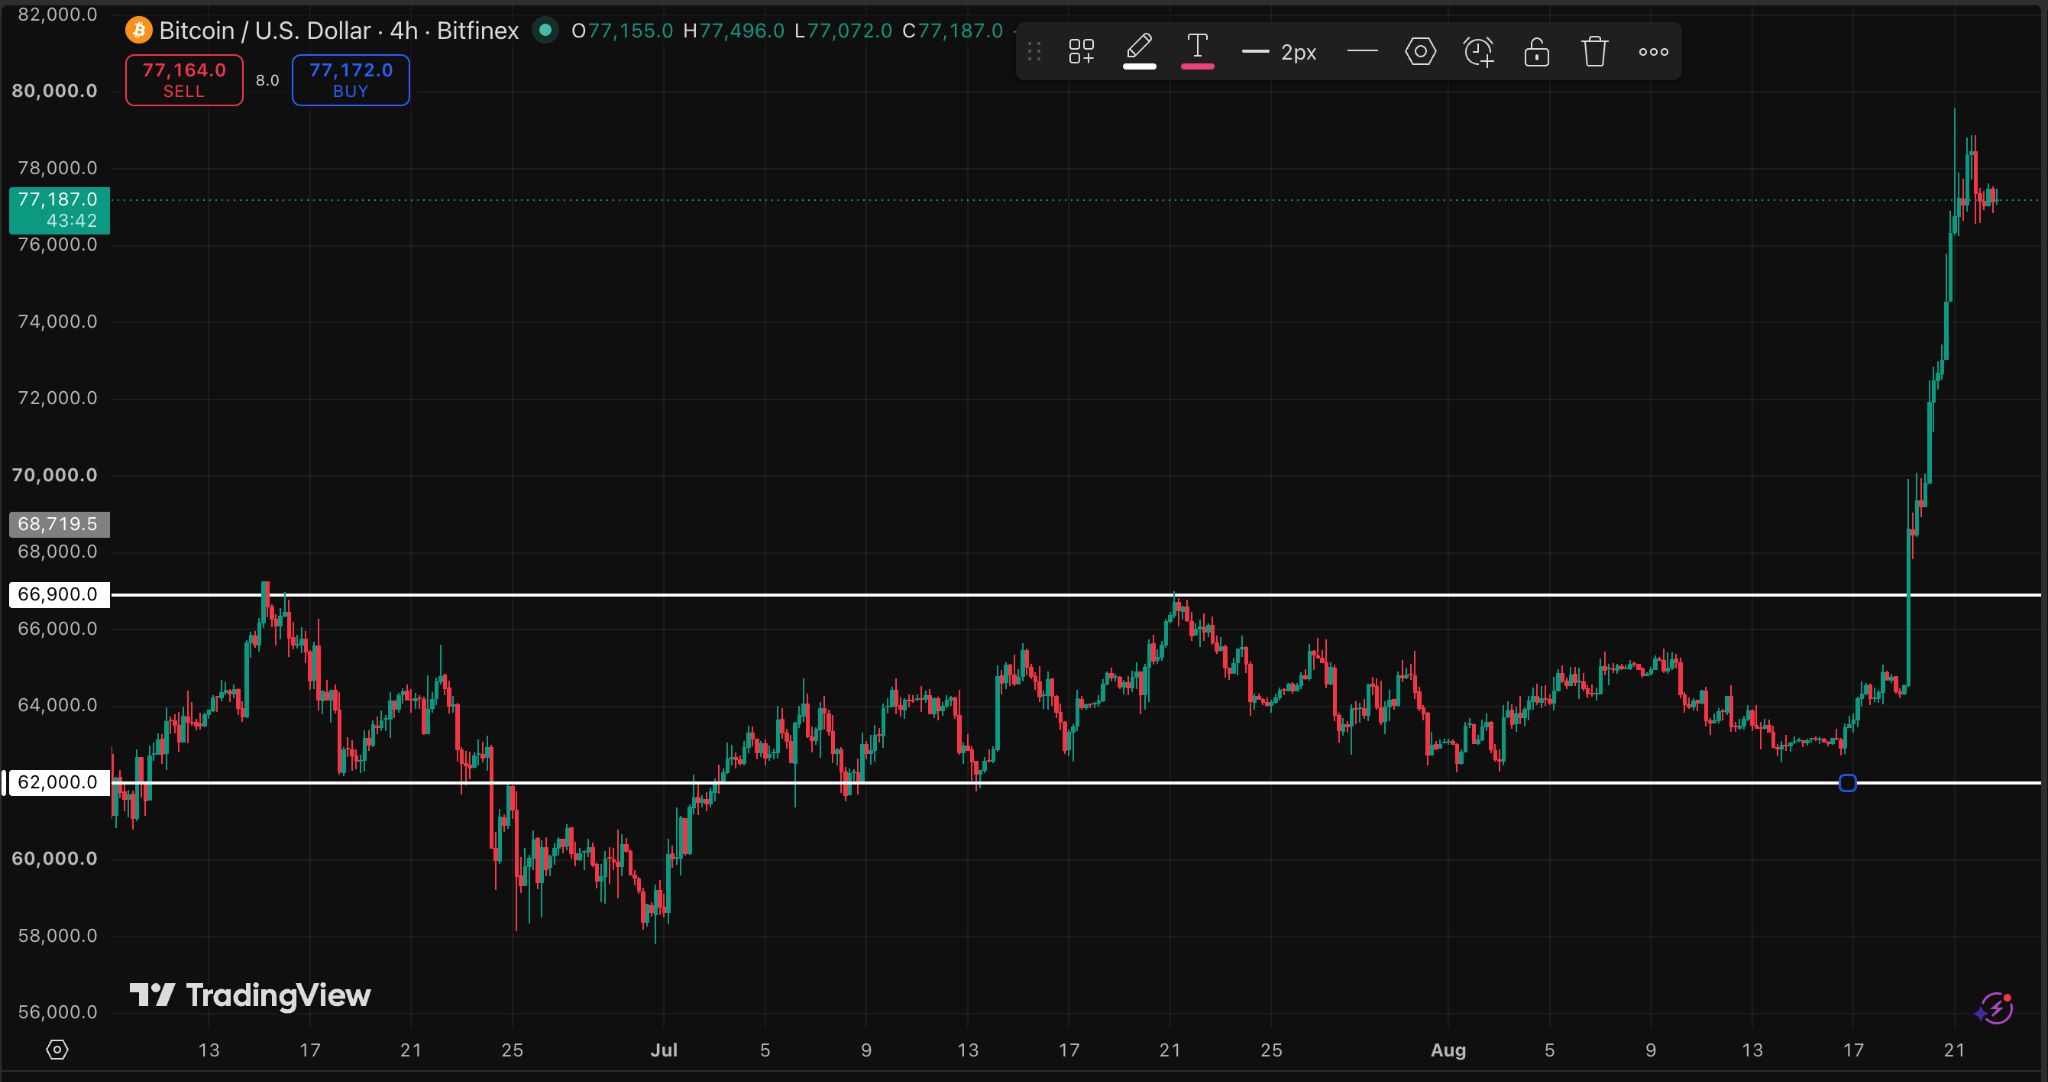

The mechanics matter as much as the direction. Last week we noted that thin tape rewards outsized moves. The breakout proved the same mechanism in reverse: once price cleared the range top, forced buying took over.
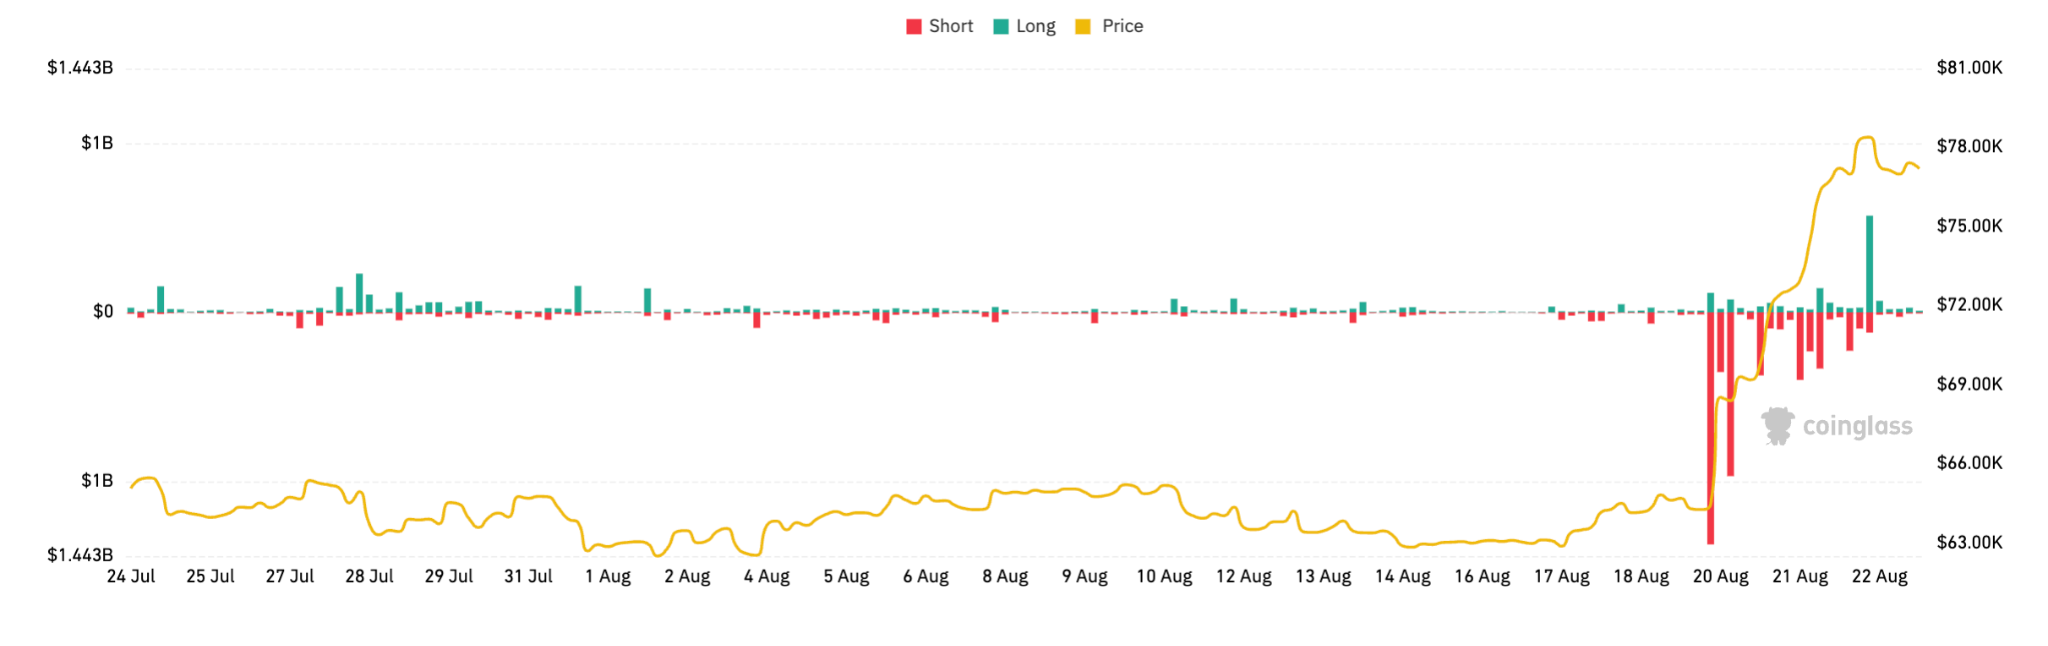
Roughly $3 billion of total crypto short positions were liquidated between August 19- 20 against just $337 million of longs, the largest short-side liquidation on record, and roughly the seventh-largest liquidation day overall. Despite the squeeze, Bitcoin futures open interest rose to around $51.36 billion over the three days ending August 20, indicating that fresh derivatives positioning was entering the market even as existing shorts were forced out. Ether also participated in the rally, rising over 27 percent since August 19.


Realised price by age band shows what each cohort paid. The one-to-three month band sits near $64,500 and the three-to-six month band near $73,500. Price had traded below both since June, but the breakout put both cohorts into profit in a single session. This cost basis now converts from overhead supply into the first line of support.
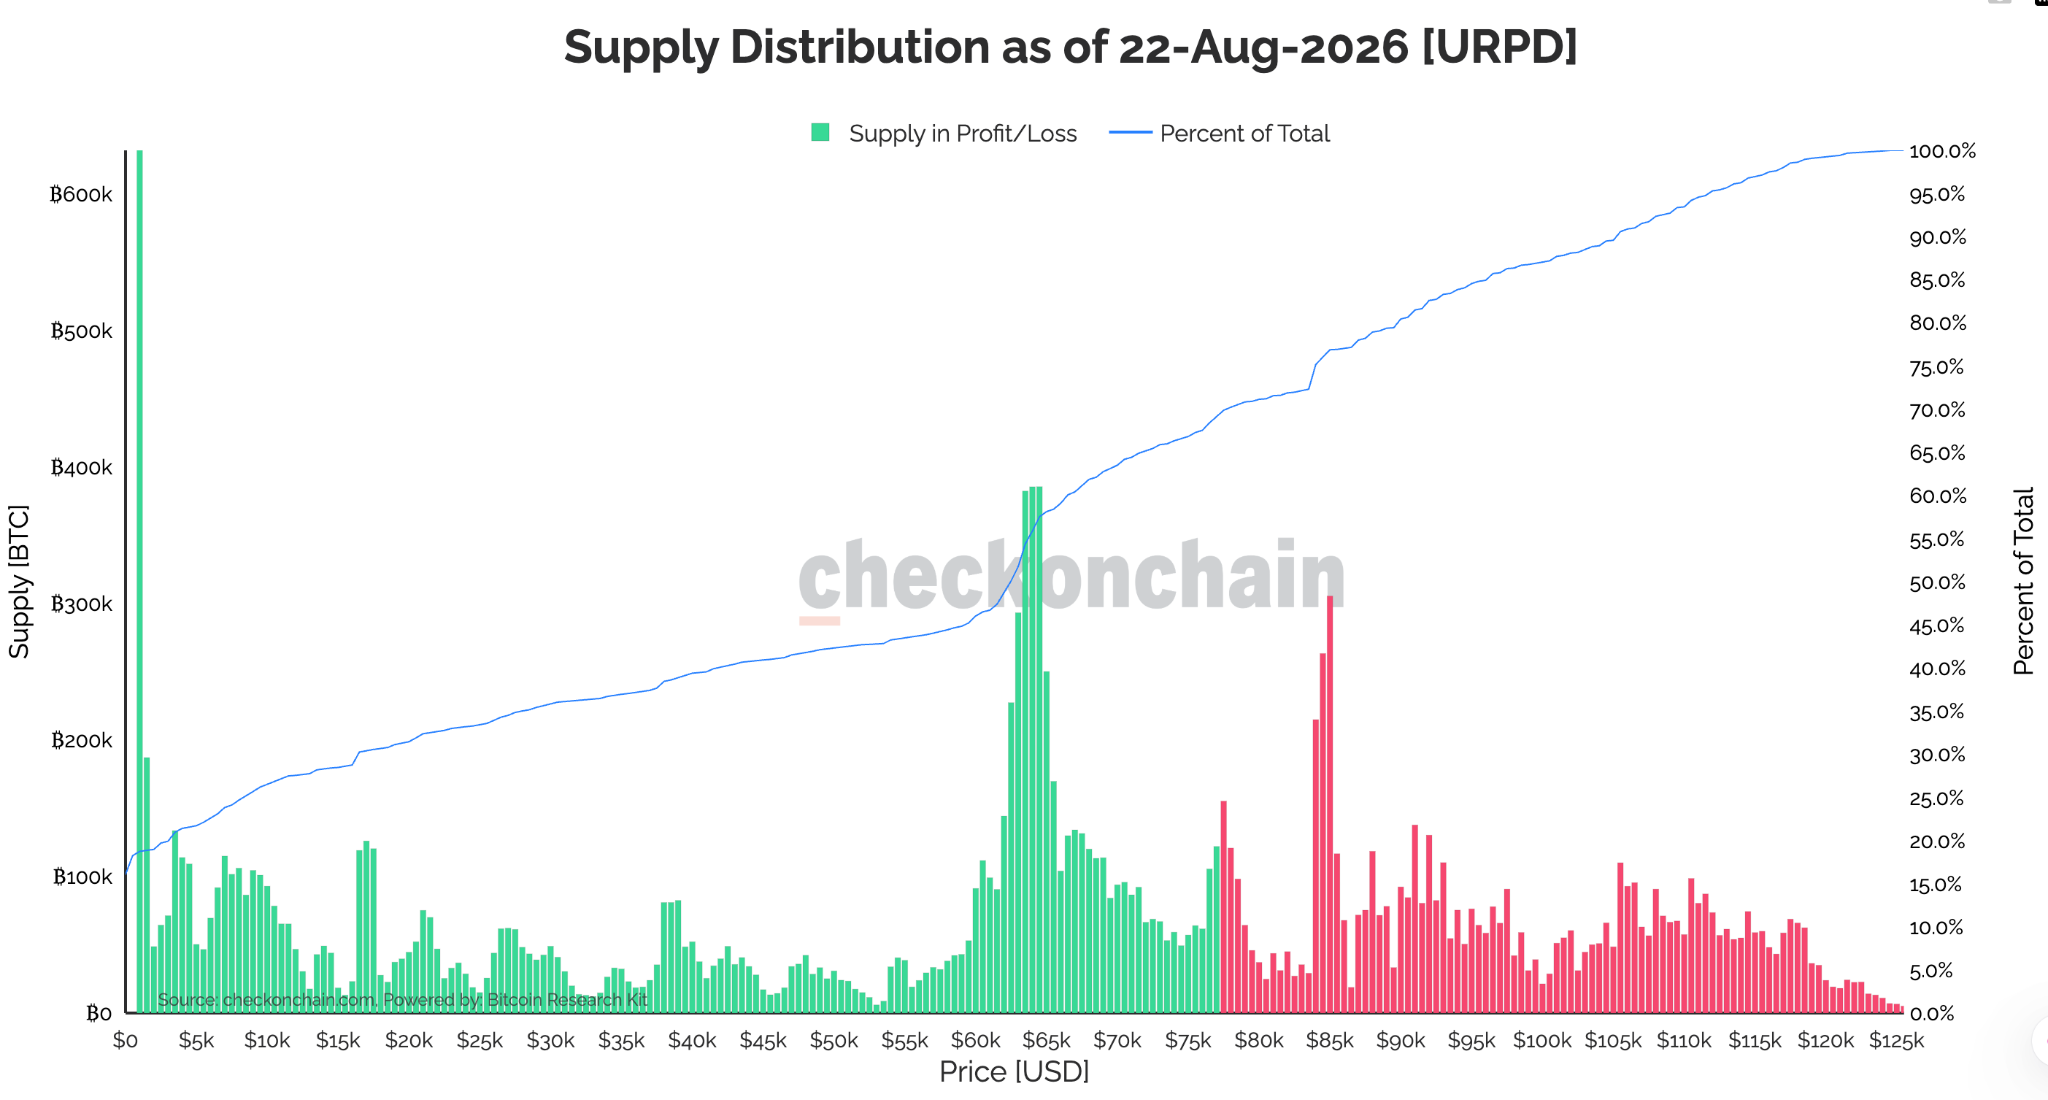
Relatively little bitcoin supply sits between the current price and the next major concentration around $84,000 to $85,000. Thinner supply overhead points to lighter selling pressure on the way up, though the cluster at $84,000 to $85,000 remains a credible resistance zone.
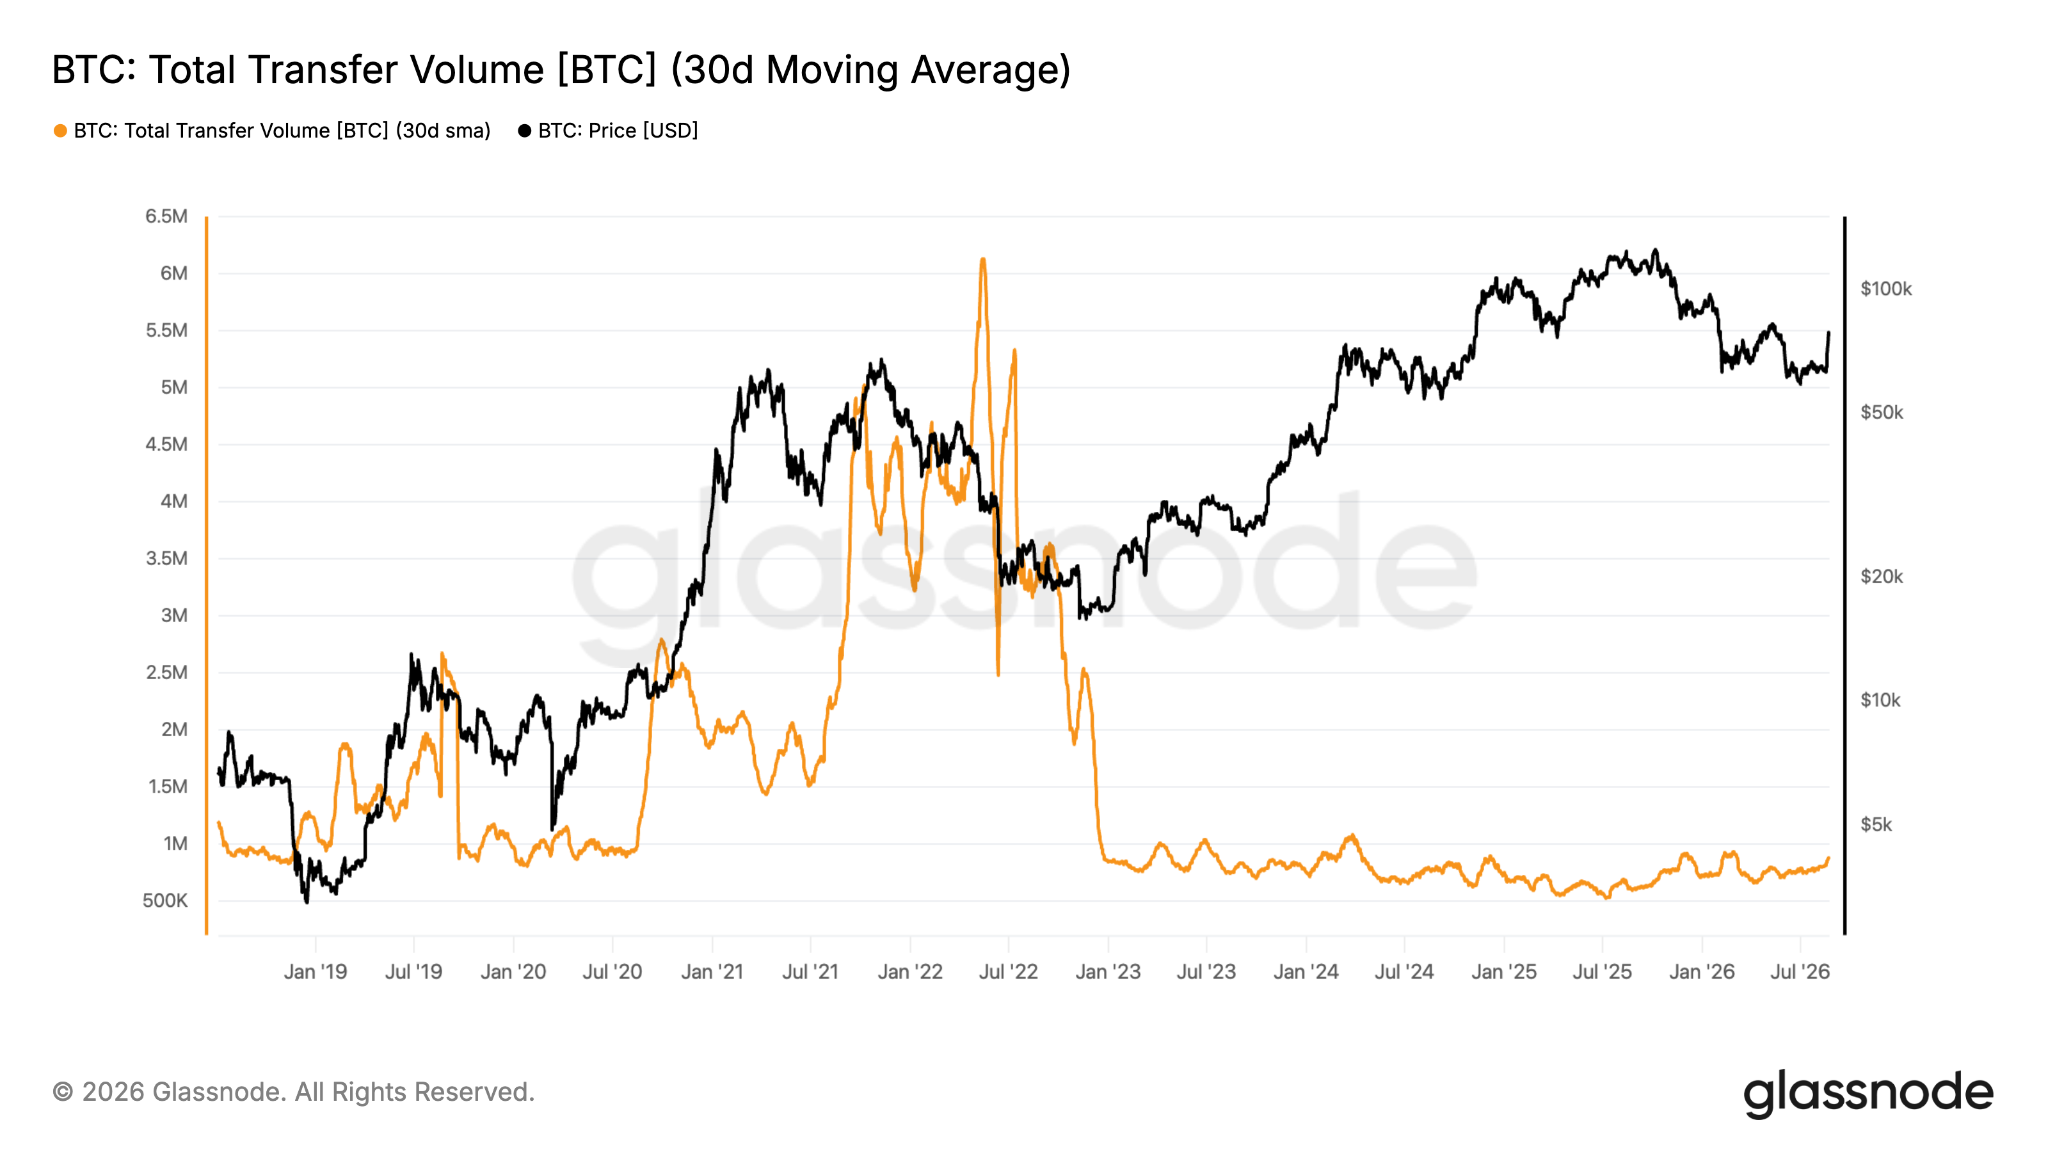
The one caveat is that forced buying has been a key driver behind the rally, and actual bitcoin transfers (see Figure 7) remain near the bottom of their eight-year range. The 30-day average entered last week around 875,000 BTC a day, roughly where it ran through 2019, when BTC traded under $10,000, and in fact has remained there since 2023, a stretch during which price went from about $16,000 to above $100,000.
Indicators to watch to confirm the rally
The next few weeks carry two clear signals. On the upside, a weekly close above roughly $73,500, the average paid by buyers from the past three to six months, followed by a successful retest, would confirm the recovery. The next area above that sits near $86,500, where buyers from 18 months to two years ago are still waiting to break even.
On the downside, a fall back below about $64,500, the average paid by the most recent cohort, would mark the rally as an overshoot on forced buying and put the summer range back in play.
ETFs Drive The Spot Bid
The two key buyers of BTC remain the US spot Bitcoin Exchange Traded Funds (ETFs), and public companies that hold BTC on the balance sheet. The pair is referred to here as the Two-Complex Spot Bid. Its value is that it ignores traders passing coins to each other and counts only money that arrives and stays.
The ETFs were an important driver of last week’s rally (in addition to the ‘forced buying’ mentioned previously). ETFs took in roughly $1.92 billion over the week, their strongest since October 2025, after a week of net withdrawals, starting 19 August, when the US Treasury announced its larger bond buybacks. Total ETF assets have now recovered from roughly $77.6 billion at the June low to above $96.1 billion.
In contrast, Strategy, the largest corporate treasury holder of BTC, reported no new purchases or sales in its 17 August filing, ending three straight weeks of prior selling. Instead it revealed $333.7 million raised through share issuance and a cash reserve of roughly $4.8 billion, the largest the company has disclosed this cycle. The seller that had been capping the range stepped away days before the range broke.
The current spot price is above Strategy’s reported average purchase price of $75,385 for the first time since its selling began.
This week’s filing will be an important indicator for market direction. If it discloses BTC sales into the current strength, that could create a source of overhead pressure. A return to buying would reinforce the rally.
General Macro Update
Treasury Buybacks Inject Liquidity Into The System
The US Treasury announced that it would be at least doubling its bond buyback programme on 19 August. The 20-year Treasury yield fell 11 basis points, before retracing by a quarter, reflecting the limitations of the announcement, and the fact that higher yields are driven by investor concern over debt levels in the economy.
The Treasury said it would at least double the maximum size of liquidity support buybacks for longer-dated nominal coupon securities, from $2 billion to at least $4 billion per operation, of 10-year to 20-year and 20-year to 30-year paper.
The larger operations begin on 9 September and run through 4 November, when the next quarterly refunding sets sizes for the following quarter. Treasury framed the change as a response to demand, citing “consistent strong sponsorship from market participants” in longer-dated operations.
The 30-year Treasury yield closed at 5.31 percent on 17 August, its highest in 19 years, and the 20-year at 5.30 percent.
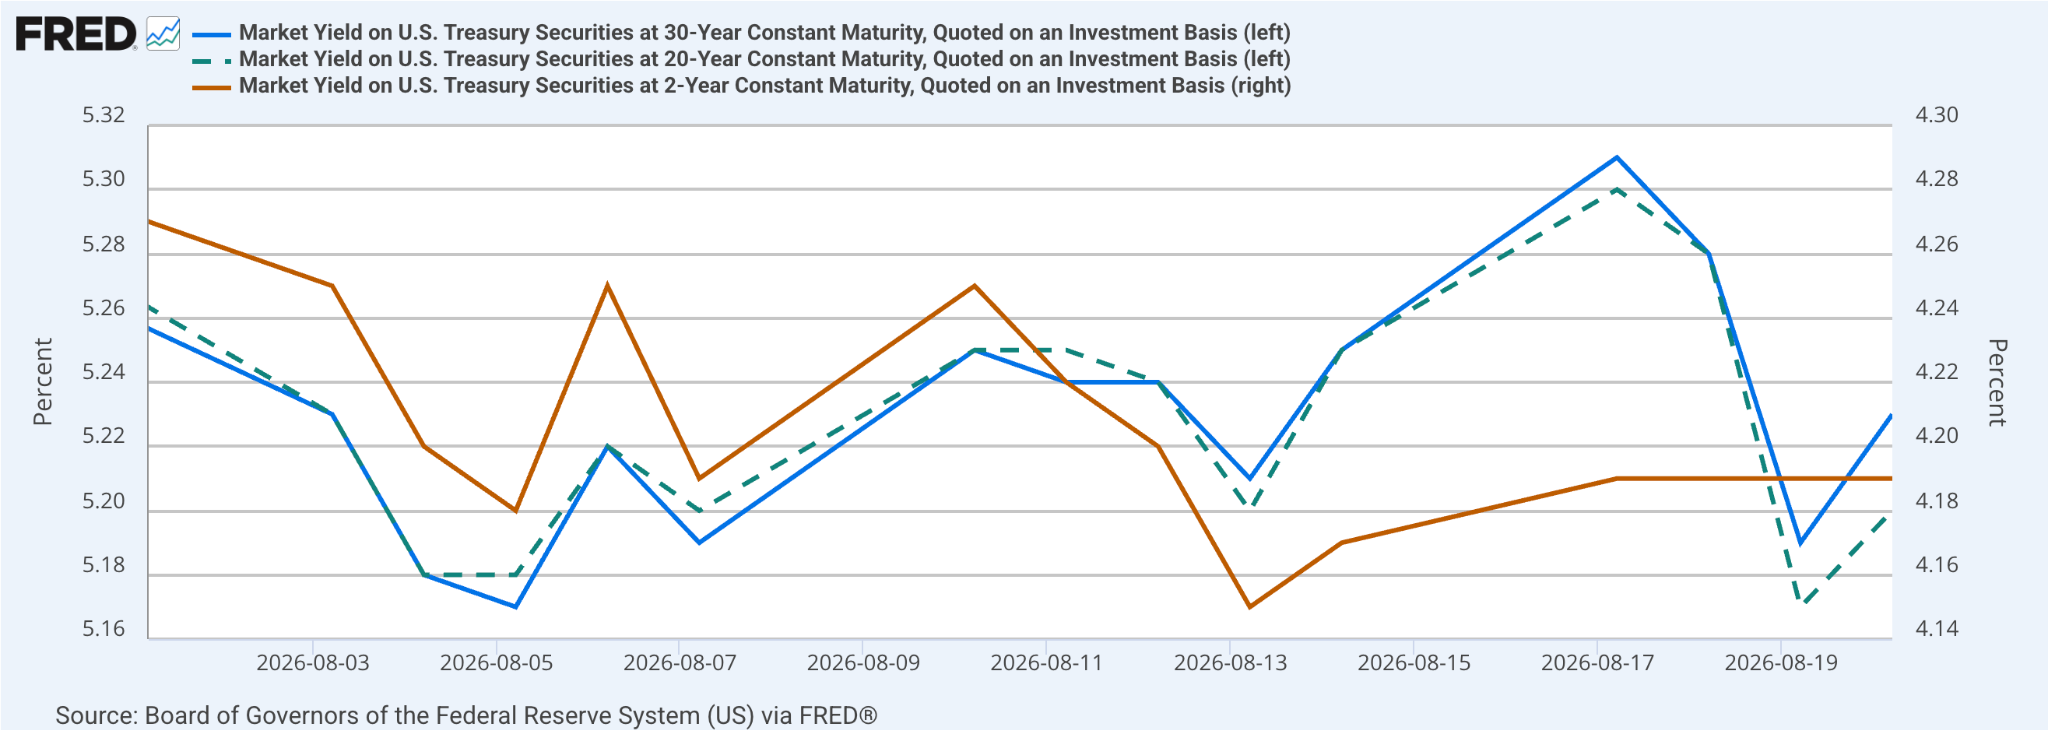
Between 18- 19 August the 20-year fell 11 basis points to 5.17 percent and the 30-year fell nine basis points to 5.19 percent. The two-year did not move at all. It printed 4.19 percent on 17, 18, 19 and 20 August, despite the fact that the minutes of the July Federal Open Market Committee (FOMC) released the same day as the bond buyback announcement confirmed continued divisions within the committee, with three members dissenting in favour of a quarter-point increase in rates. As near-term bond yields tend to more accurately reflect rate expectations, the lack of movement in yields indicates that the front end absorbed the hawkishness.
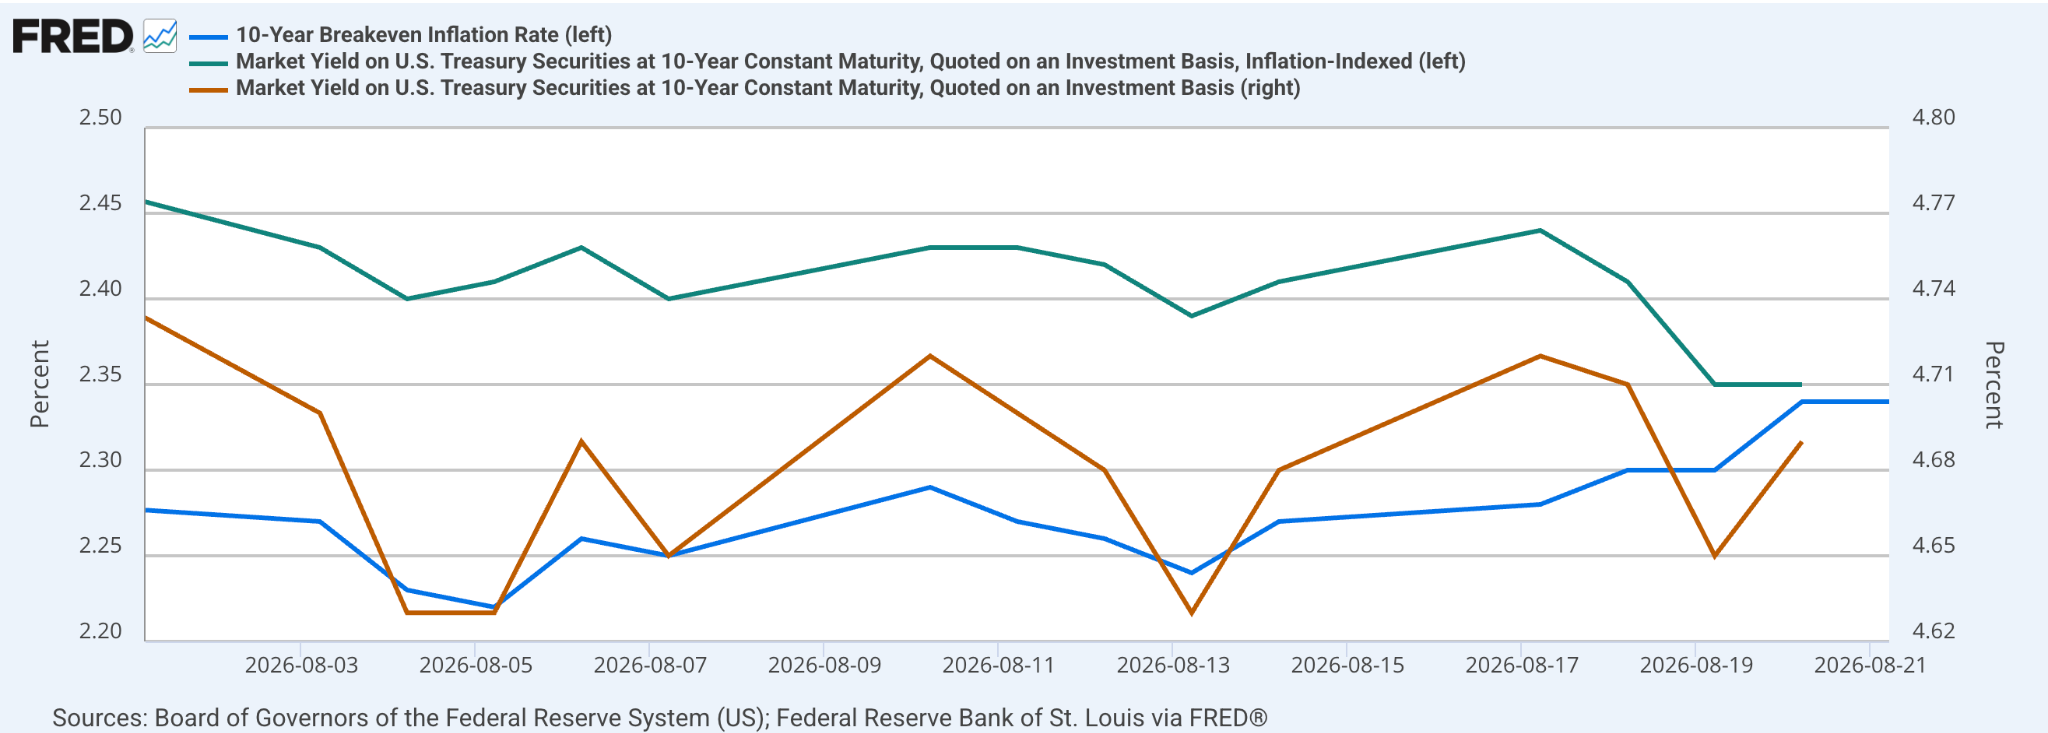
The Fed indicated that “nominal Treasury yields rose 25 to 30 basis points, driven by corresponding increases in real interest rates.”
Prior to the bond buyback announcement, the 10-year inflation-indexed yield rose as bonds sold off, but fell following the buyback announcement. The implied 10-year breakeven barely moved across the same stretch. The chart above shows investors are not demanding compensation for a worse inflation forecast, but for holding duration, as reflected by the term premium on a 10-year zero coupon bond estimated at 0.84 percent on 14 August.
A Swap, Not New Demand
The programme announced by the Treasury is also smaller than it sounds. Liquidity support buybacks are funded by issuing other shorter-dated securities: Treasury buys these bonds back with money it raises by selling other securities. In addition, refunding authorised in early August of up to $38 billion of liquidity support buybacks for the quarter pales against the $125 billion of coupons the Treasury pays in a typical week.
Retiring long bonds while funding through the front of the curve shortens the government’s own maturity profile and raises how often it must return to the market. Relief at the long end is purchased with refinancing frequency at the short end.
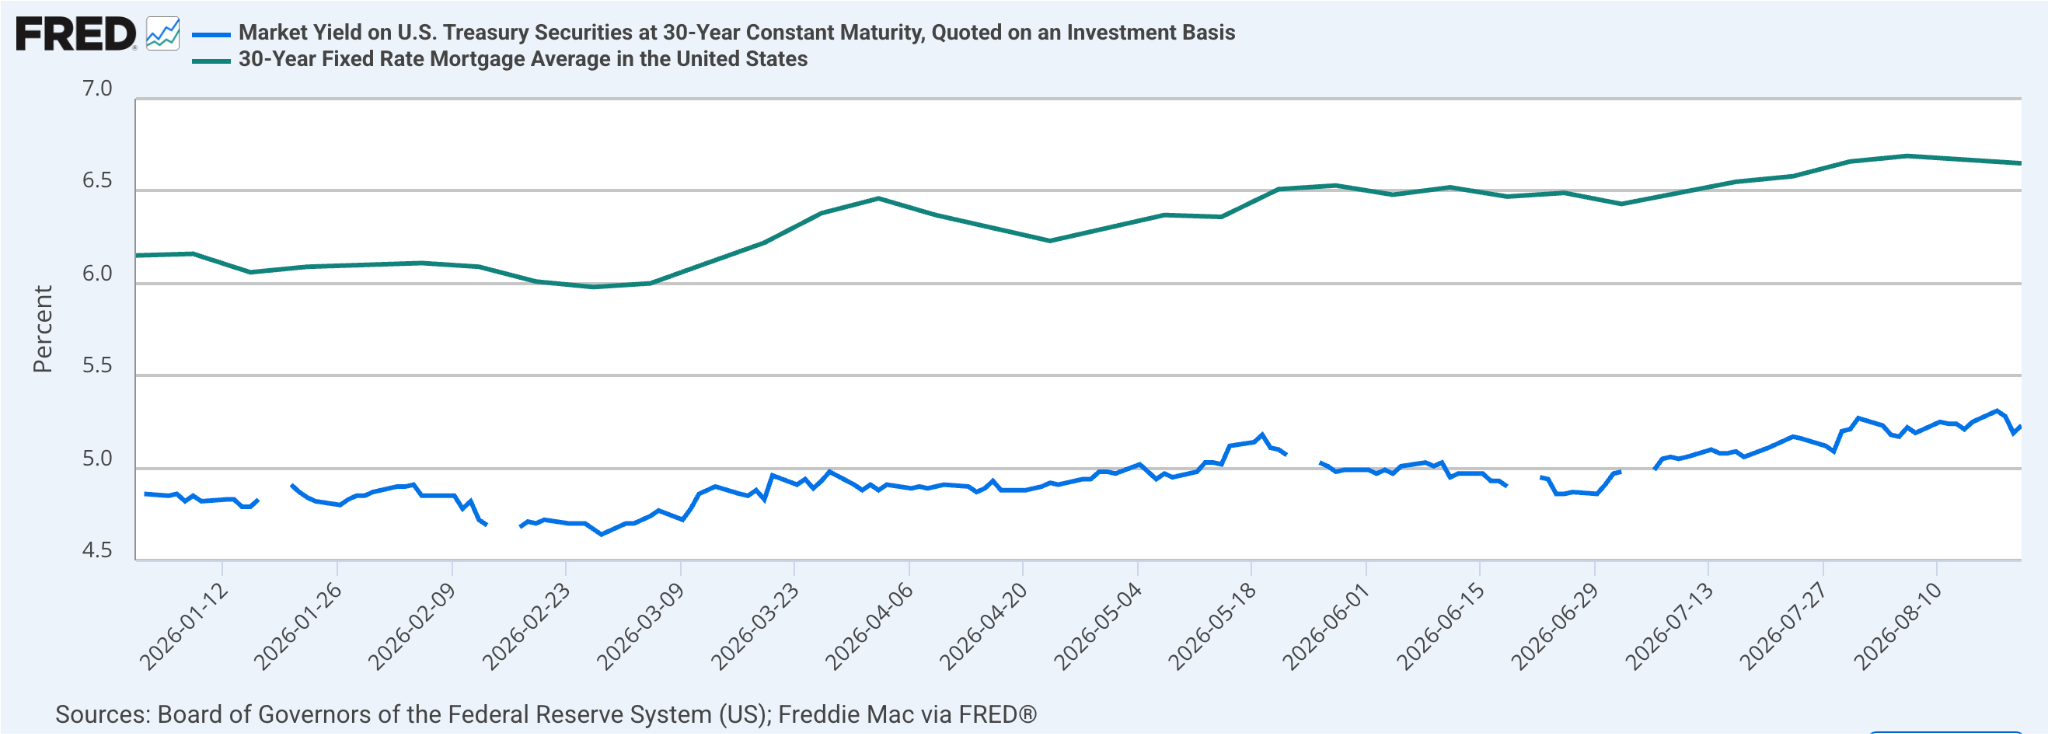
The fiscal premium is currently concentrated in longer-dated maturities. The Congressional Budget Office (CBO) projects net interest at 3.3 percent of gross domestic product (GDP) in 2026, rising to 4.6 percent by 2036, against a realised 3.2 percent in fiscal 2025 and federal debt of $39.1 trillion at the end of the first quarter. Each quarter that low-coupon debt matures and reprices at 4 to 5 percent adds to the interest bill, which adds to issuance, which is reflected in the term premium.
Why Rate Policy Cannot Fix A Fiscal Premium?
The Committee held rates at 3.5 to 3.75 percent by nine votes to three, with Beth Hammack, Neel Kashkari and Lorie Logan preferring a hike. The term premium however is not directly impacted by policy, and any cut into the fiscal premium tends to steepen the curve rather than lower long rates.
The minutes also gave an indication of what is driving the term premium with some participants “focused on vulnerabilities associated with the financing of the rapid buildout of AI-related infrastructure” and a few noted “the increased degree to which capital spending in the AI sector was being financed by borrowing.” Government and corporate borrowers are now competing for the same pool of long-dated capital, which is the mechanism behind a higher term premium.
Mortgage Rates Drop
Mortgage rates have now declined for two consecutive weeks. Prospective buyer traffic was unchanged, builders cut prices for a 16th straight month and housing starts fell 12.4 percent. The level of interest rates has stopped being the binding constraint on US housing, which narrows what a rate cut could achieve and limits how much damage the long-end repricing can do to activity.
Cheaper Money Arrived And Nobody Came
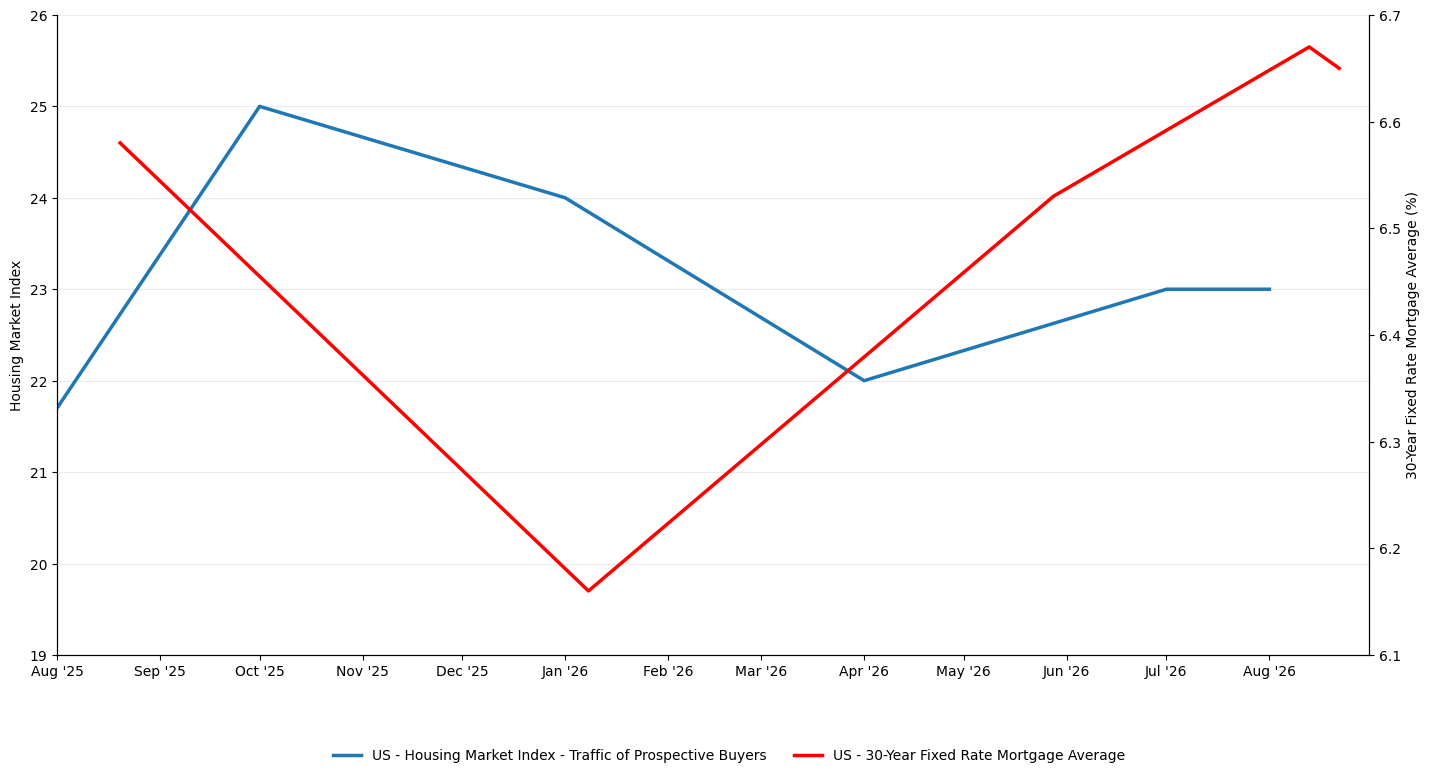
Freddie Mac’s 30-year fixed mortgage rate averaged 6.65 percent in the week ending 20 August, down from 6.67 percent, a second consecutive weekly decline.
The National Association of Home Builders (NAHB)/Wells Fargo Housing Market Index rose one point to 35 in August, a 16th consecutive month below 40. Prospective buyer traffic held at 23, which is the component that measures whether anyone is walking through the door. Some 35 percent of builders cut prices in August, with an average reduction of 6 percent. The resale market tells the same story: existing-home sales fell 1.7 percent in July while the median price rose 2.0 percent, sellers holding out and buyers absent.
30-Year Fixed Term Mortgage rates are still higher than they were a year ago, at 6.58 percent, so two weeks of decline have not undone the year. But the industry’s own stated trigger is close: National Association of Realtors (NAR) chief economist Lawrence Yun said the market “would be thriving” if average mortgage rates were to return near 6 percent.” The gap is 65 basis points, and the most recent two basis points cut produced a limited change in traffic.
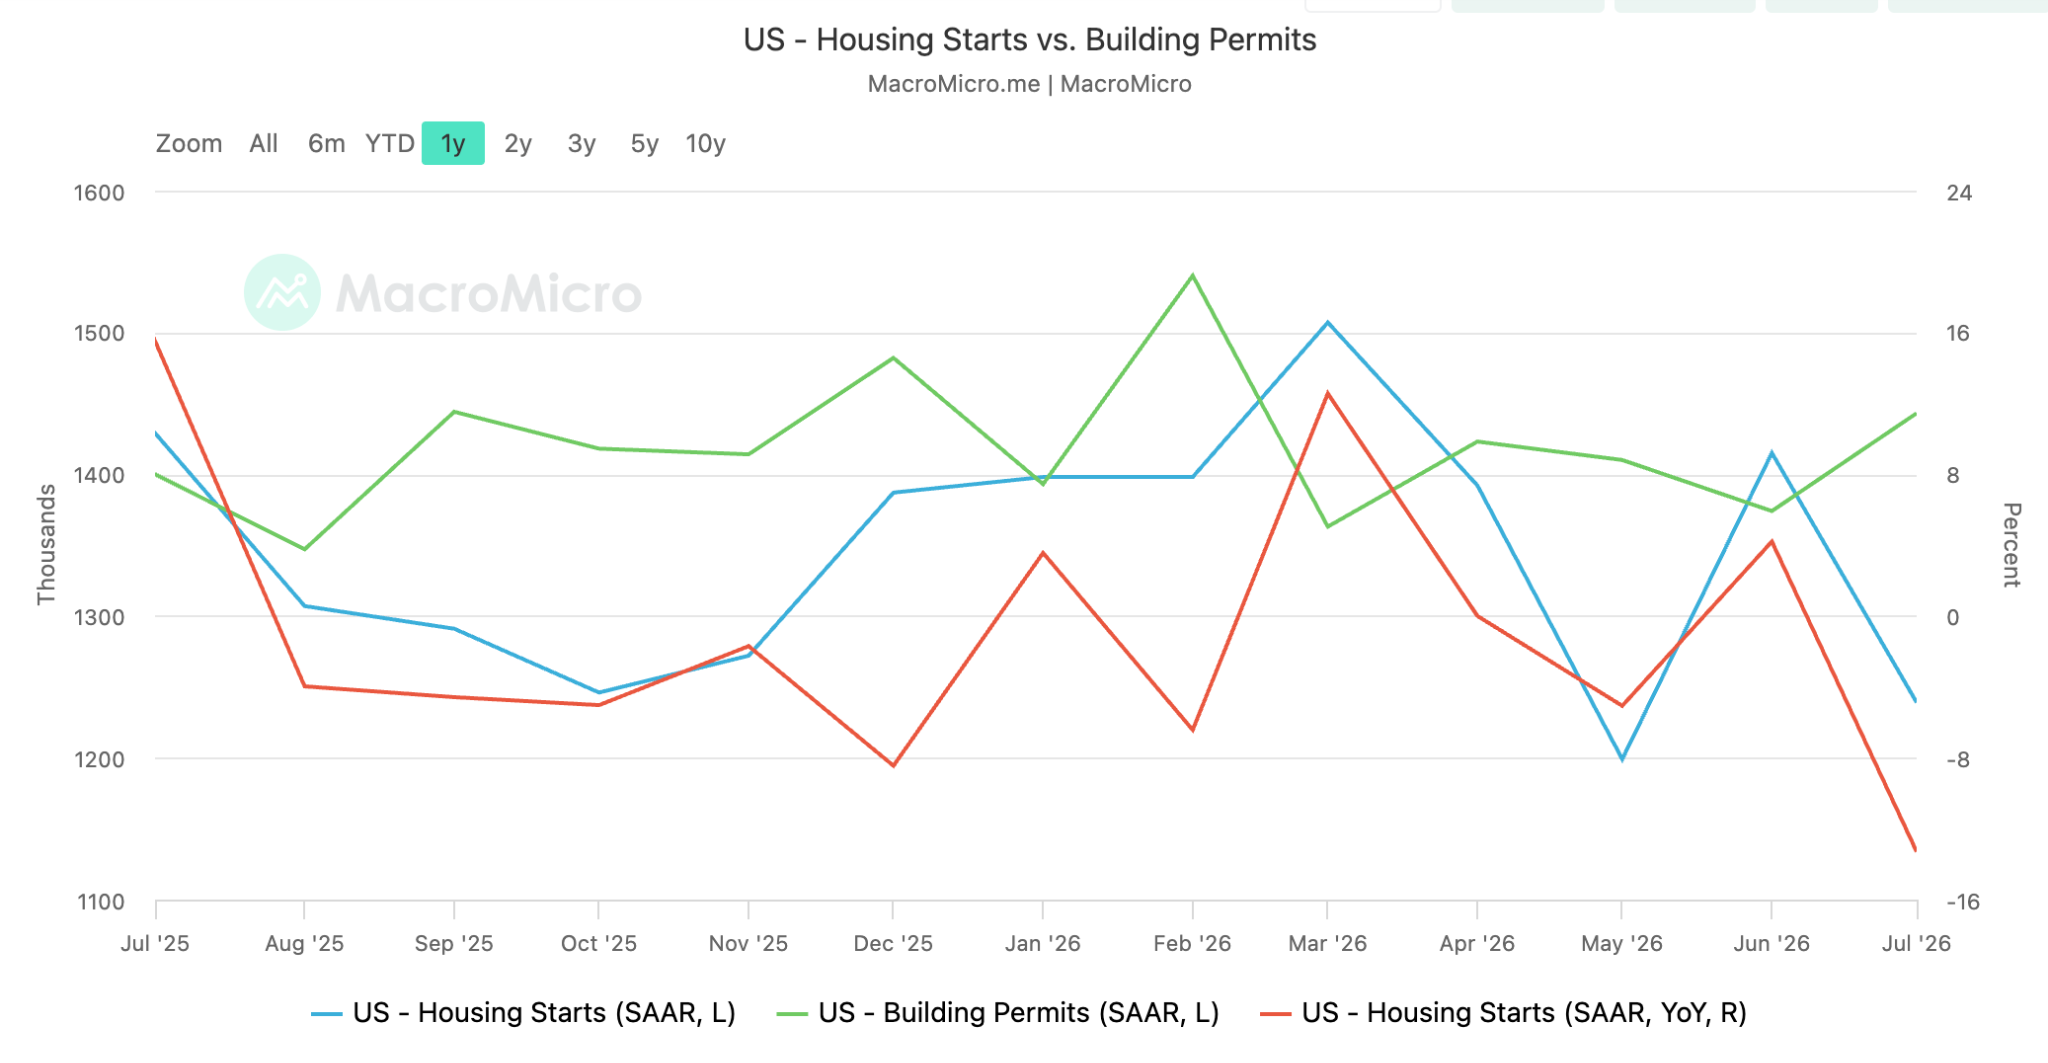
The most interesting split in the week is inside the Census Bureau’s new residential construction release. Building permits rose 5.0 percent in July to a seasonally adjusted annual rate (SAAR) of 1,443,000. Over the same month housing starts fell 12.4 percent to 1,239,000.
Permits are cheap and reversible. Breaking ground commits capital, labour and carrying costs into a market where housebuilders are discounting. Builders responded to slightly cheaper financing by extending the pipeline and declining to build into it, which is what a firm does when it doubts the demand rather than the financing. One caveat: the fall in total starts is large enough to sit outside the Census Bureau’s margin of error. Completions also fell 9.1 percent, so this is not builders working through a backlog.
The resale market tells the same story in a different register. Existing-home sales ran at 4.06 million annualised in July, down 1.7 percent on the month,with prices drifting up while volumes stall, the signature of a freeze.
The Fed Is Not Watching Housing Too Closely
Housing appears in the July FOMC minutes, in a single clause noting that “for households, home-purchase mortgage activity remained depressed.” There is no discussion of residential investment, house prices or homebuilding anywhere in the record, while three members dissented in favour of raising rates.
A committee weighing tightening while its most rate-sensitive sector runs a 16th month of discounting has, in effect, concluded that housing is not the constraint on inflation and not the channel it is relying on.
If 6.65 percent does not move buyer traffic, neither will 6.25 percent. The policy rate has lost much of its grip on the sector through which it has historically worked fastest.
What Matters Next
New home sales on 25 August are the direct test, because they capture transactions rather than sentiment and will be the first read on whether two weeks of cheaper mortgages produced any buyers. Durable goods follow on 26 August, Jackson Hole runs from 27 to 29 August and the final University of Michigan sentiment reading lands on 28 August. The marker worth holding to is narrow: whether prospective buyer traffic finally clears 25 in the September index, or whether a 17th month of price cutting arrives instead.
Why This Matters for Crypto
Last week this section called the macro improvement real but unfunded, and named the marker that would change the assessment: a week of net inflows into US spot Bitcoin funds alongside a rising stablecoin float. The stablecoin float, which had been shrinking since May, printed its first weekly expansion this week, rising about $695 million to roughly $301.5 billion. Half of that marker arrived within days. Spot Bitcoin funds took in roughly $517 million on 19 August and $606 million on 20 August, around $1.92 billion for the week, and Bitcoin recovered from below $62,000 to close the week over $77,000. The timing is the analytical point: the inflows accelerated the day Treasury announced the expanded buybacks, on a week when September hike odds did not fall and the FOMC minutes leaned hawkish. Capital did not move on rate expectations. It moved on the first concrete liquidity-support headline of the quarter, which is precisely the behaviour this section has been arguing for since the divergence opened: crypto responds to realised liquidity, not to expected rates. The housing article above supplies the other half of the picture. With the construction channel frozen, whatever easing
eventually arrives will transmit through asset prices and liquidity rather than through activity, and crypto sits at the far end of exactly that pipe. The honest caveat is scale. A $4 billion operation cannot itself fund a rally, so the flows are responding to the signal rather than the size, and signal-driven flows are fragile. The marker now splits in two: the stablecoin float needs to confirm that new capital is entering rather than rotating, and the inflows need to survive the first enlarged buyback operation on 9 September.
What Would Prove This Wrong
The house view is that the Fed stays on hold through September, that the pressure on the long end is fiscal rather than inflationary, and that crypto responds to realised liquidity rather than rate expectations. One falsifier listed last week fired, and it fired in the direction of the framework. The 30-year yield took out its July peak at 5.31 percent on 17 August while hike odds held in the low 30s, which was the stated confirmation that the long end is pricing something other than the Fed. That condition is now the operating thesis of the first article rather than a risk to it. The clean crypto test named last week also resolved: inflows arrived, but on a liquidity headline rather than on falling odds, so the liquidity reading survives with better evidence than it had. These are the conditions that would break the current calls:
The implied probability of a September rate increase returns above 60 percent and holds there. It sat in the low 30s through the minutes, which produced no repricing at the front end.
Initial jobless claims exceed 230,000 for two consecutive prints. Claims were 206,000 in the week ending 15 August, moving away from the line after the prior week was revised up to 212,000, with continuing claims at 1,799,000.
Private payrolls turn negative for a second consecutive month with a rising unemployment rate. The next employment report lands on 4 September, before the meeting.
The 30-year yield makes a new high above 5.31 percent while the enlarged buyback operations are running, or the first $4 billion operation on 9 September fails to draw the offer quality Treasury cited when it expanded the programme. Either would mean the fiscal premium is escalating past what liquidity support can smooth.
The 10-year Treasury Inflation-Protected Securities (TIPS) real yield holds above 2.5 percent for two consecutive weeks. It touched 2.44 percent on 17 August, six basis points from the line, before falling back to 2.35 percent.
Computing hardware import prices flatten for a second consecutive month, which would break the AI inflation channel. The July print went the other way, with capital goods import prices up 0.9 percent on computers, semiconductors and machinery. The August read lands in mid-September.
Spot Bitcoin funds post a week of net outflows while the buyback operations are running, or the stablecoin float keeps shrinking through September. Either would mean this week’s inflows were rotation rather than new capital, and the liquidity-response reading was premature.
New home sales on 25 August surprise materially higher and NAHB buyer traffic clears 25 in the September index. That would mean the rate channel still conducts into activity and the second article’s constraint argument is wrong.
One week decides little. The first enlarged buyback operation, the 4 September payrolls and the September stablecoin trend together decide whether this issue’s read was the turn or the head fake.