

Bitcoin’s Next Move Hinges on $84,000
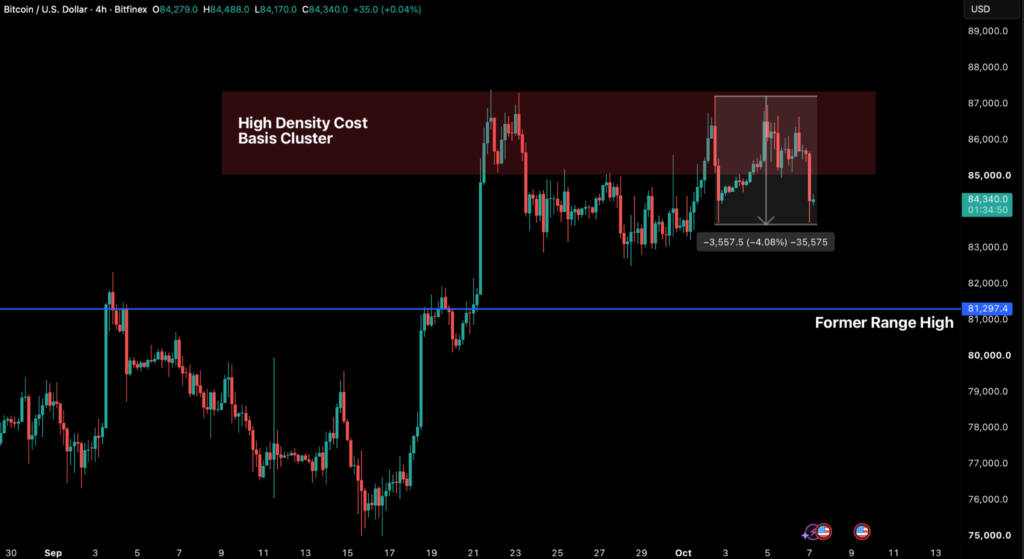
Bitcoin has fallen back below $84,000, with a current low so far today (7 October) of $83,524, re-approaching the low set on 1 October of $83,218. The decline follows a third failed attempt in a fortnight to break decisively above the $87,722 yearly open or move above the dense cost-basis cluster between $85,000 and $86,500, that we have previously highlighted.
In Monday’s Bitfinex Alpha we set a baseline trading range between $84,000 and the yearly open, but any sustained loss of the $84,000 level would break the immediate consolidation structure. A broader recovery would only remain intact provided three conditions hold: Exchange Traded Fund (ETF) flows remain net-positive, short-term holders continue to sell at a profit rather than at a loss and price stays above the $81,300 macro pivot. With the lower bound currently being tested, this Intelligence Update assesses derivative positioning, supply distribution and ETF dynamics ahead of the US Consumer Price Index (CPI) release on 14 October.
Shorts Added Into The Decline Raise The Stakes At $84,000
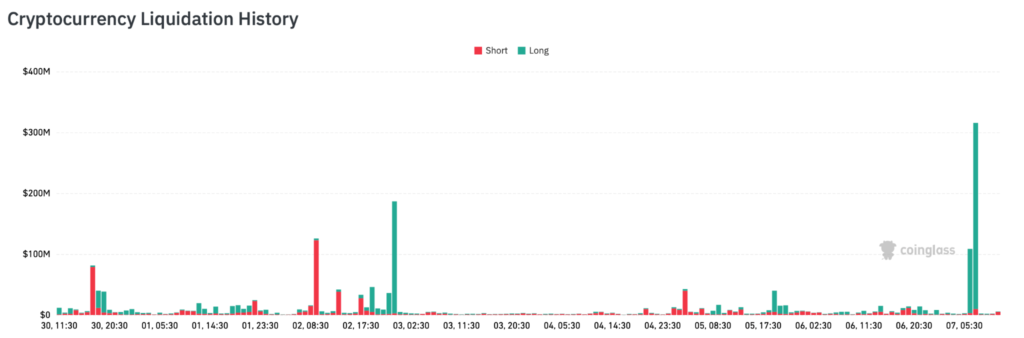
The swift move lower liquidated a significant volume of long positions despite a broader leverage reset having already taken place in early October. Total crypto futures liquidations have reached $510.6 million in the last 24 hours, with long positions accounting for $417.6 million. Roughly $300 million of those long liquidations came within an hour as price broke below the $84,000 floor.
Measured in bitcoin, Open Interest (OI) across major perpetual venues rose just 0.5 percent on the morning of 7 October compared with 5 October. Stable OI during a significant liquidation event signals aggressive fresh position-building as existing longs are forced out. Funding rates suggest much of that new positioning came from short sellers: average annualised funding across major venues has edged lower but remained positive within a narrow band of 5 to 6.5 percent throughout the week.
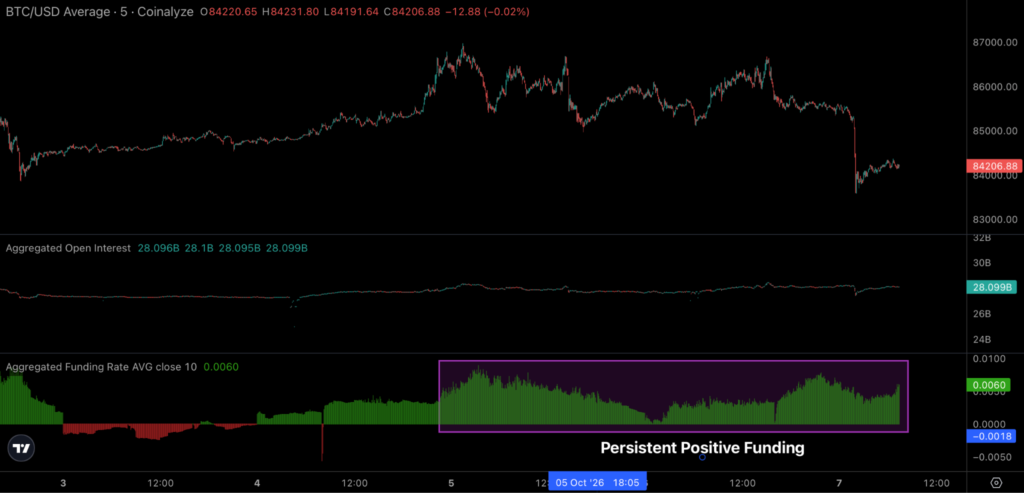
Unlike the leverage resets of late September and 2 October, positioning has remained but turned net short in aggregate.
That leaves two paths forward:
Squeeze Potential: If BTC holds $84,000, late short positions become trapped below this key level. A rise in spot demand could push them offside and could carry price back towards the yearly open or through it.
Bearish Breakdown: Sustained trading below $84,000 leaves shorts in profit and shifts the burden of support entirely to spot demand.
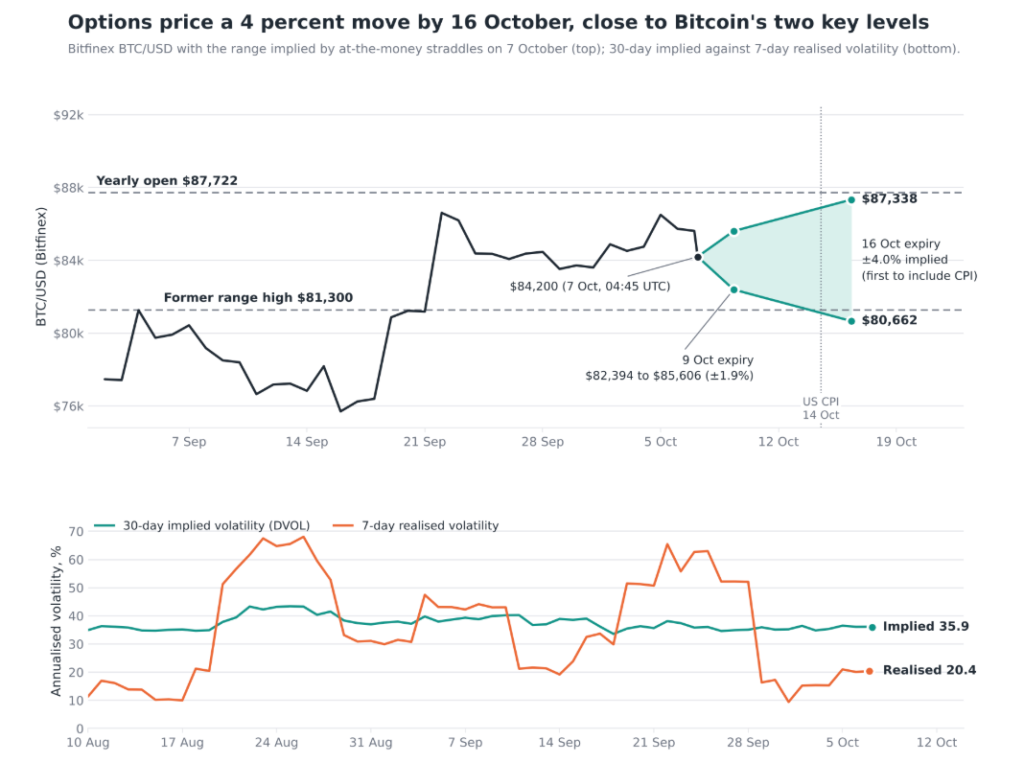
Options markets are pricing a muted risk profile. The 30-day implied volatility (IV) index stood at 35.9 on 7 October, compared with 36.1 previously, against a seven-day realised volatility of 20 percent. Pricing for the 16 October expiry implies an expected move of roughly four percent, or a range of $80,700 to $87,300, closely aligning with the $81,300 and $87,722 boundaries.

On-Chain Structure: The $84,000 Cost-Basis Wall
The structural significance of $84,000 stems from heavy on-chain coin accumulation around this level. According to the Unspent Realised Price Distribution (URPD) metric, as of 6 October approximately 1.72 million BTC (8.6 percent of circulating supply) was acquired between $84,000 and $86,500, with the largest concentration between $84,000 and $84,500. This marks a shift in the cost-basis distribution, which had previously been concentrated towards the upper end of the range above $86,000. Much of that accumulation occurred during the three recent-high volume breakout attempts to tackle the yearly open.
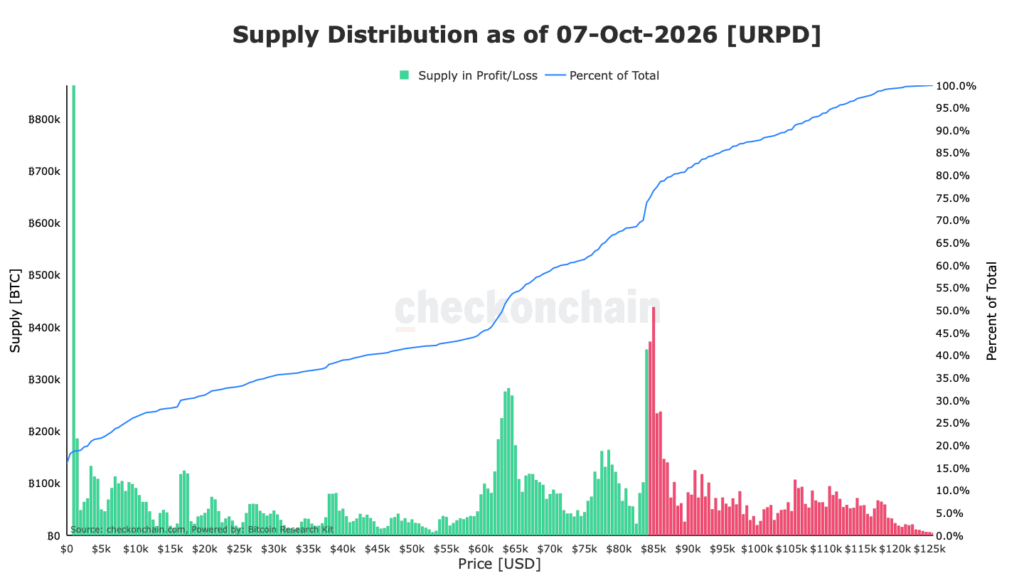
The highest concentration sits right between $84,000 and $84,500, at nearly 769,000 BTC.This dense cost cluster serves as a major inflection point for network profitability:
- At $86,265, 75.7 percent of network supply is in profit, the threshold we use to assess the strength of the broader uptrend.
- At $84,000, supply in profit falls sharply to 70 percent, placing over 1.1 million BTC into unrealised loss.
Maintaining overall network profitability above 75 percent has been our benchmark for confirming healthy bull-market expansions. Below $84,000, supply volume thins out sharply: only 473,000 BTC, or 2.4 percent of supply, has a cost basis between $81,000 and $84,000. With fewer breakeven defense clusters in that zone to act as support, price could slice through it quickly, reinforcing $84,000 and $81,300 as the critical pivots.
The Short-Term Holder Spent Output Profit Ratio (STH-SOPR) will dictate whether this cluster holds as support. STH-SOPR stands at 1.01 and has consistently remained above 1 since August 17.
A sustained reading below 1 would indicate realised losses among recent buyers, turning the potential support into overhead resistance. However, with the aggregate short-term holder (STH) cost basis at $74,152, any loss-driven selling remains confined to late buyers.
Institutional Flows: ETF Demand Has Lost Momentum
Bitcoin ETFs recorded a net outflow of $89.8 million on 5 October, followed by a net inflow of $118.8 million on October 6. The absence of a sustained run of outflow days suggests that institutional investors are not yet exiting the market in a broad or structural way.
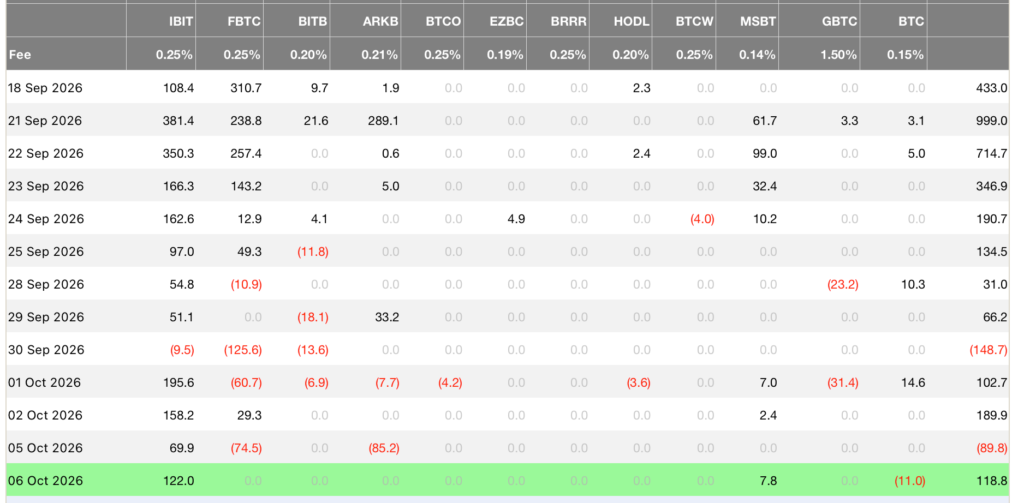
However, total demand momentum has tapered. Daily ETF inflows averaged $341.7 million during the mid-September expansion from $76,000 to $87,000, compared with just $35 million per day over the past five sessions, or $172.9 million in total. Inflows also remain highly concentrated: BlackRock’s IBIT absorbed $536.2 million over those five sessions, while competing ETFs experienced cumulative net outflows of $363.3 million.
With BTC trading near the ETF flow-weighted average cost basis of $84,318, according to Checkonchain, institutional flows have naturally moderated toward the historical average of around $65 million per day seen near breakeven levels. Treasury buying is providing some additional baseline support, with Strategy acquiring 334 BTC and Strive 2,000 BTC in early October.
Altcoin Market Dynamics: Heightened Downside Sensitivity
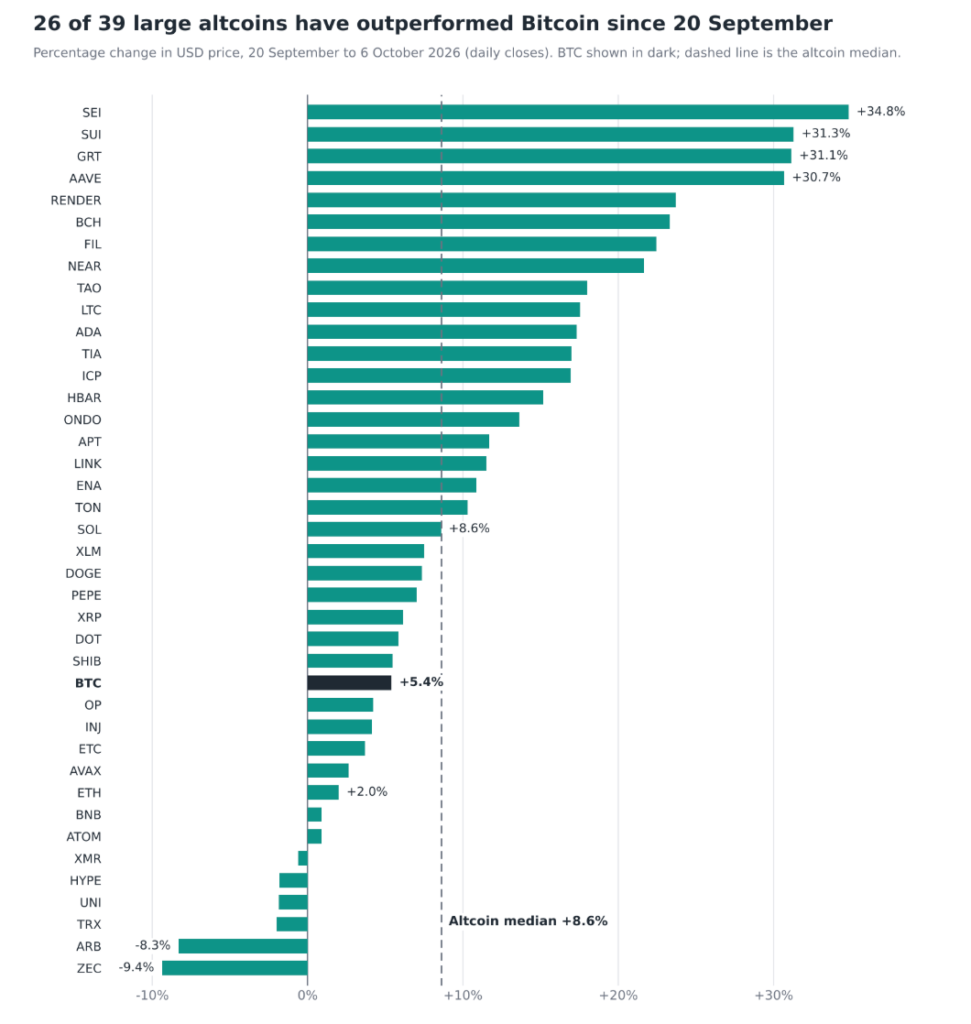
Altcoins outperformed during bitcoin’s initial push above $81,000 but lost momentum quickly. Across 39 major altcoins, the median gain from 20 September to 6 October was 8.6 percent, compared with 5.4 percent for BTC. However, over the week ending 4 October, BTC gained 2.4 percent while the median altcoin dropped 3.9 percent.
This divergence reflects weaker structural demand. US spot Ether ETFs recorded six consecutive outflow sessions totaling $407.9 million through 6 October. Without dedicated fresh inflows, altcoin rallies depend more heavily on internal capital rotation, leaving them more vulnerable when bitcoin stalls.
Historical precedent points to high downside beta for alt coins: during bitcoin’s May pullbacks, altcoins fell roughly 1.4 times faster. Recent price action shows a similar pattern, with a 1.6 percent decline in BTC accompanied by falls of 3.3 percent in ETH, 5.1 percent in SUI and 5.9 percent in ADA. Assets that led previous expansions are now among the laggards, and we expect downside pressure across altcoins to intensify if bitcoin falls further.
Macro Outlook: Treasury Yield Risks and Catalyst Calendar
Over the past 30 sessions, BTC returns maintained a -0.4 correlation with US 10-year Treasury yields. The 10-year yield surged to 5.27 percent on October 6, just four basis points below its 2026 high, while long-dated Treasury prices have fallen 6.0 percent since 4 September. With the Federal Reserve having raised rates in September and markets pricing roughly a 20 percent change of another increase on 28 October, hawkish FOMC minutes or weak Treasury auction demand could push yields higher and increase the risk of a test of $81,300.
| Date and time (UTC) | Event | Why it matters |
|---|---|---|
| 7 October, 17:00 | US 10-year Treasury auction ($39 billion) | Weak demand pushes yields towards the 2026 high |
| 7 October, 18:00 | FOMC minutes, September meeting | Shows how much support there is for another rate increase |
| 8 October, 17:00 | US 30-year Treasury auction ($22 billion) | Second test of demand for long-dated debt |
| 9 October, 08:00 | Weekly BTC options expiry (about $1.8 billion notional) | Largest open interest is at the $90,000 call and $75,000 put |
| 14 October, 12:30 | US CPI, September | Last inflation reading before the 27 to 28 October FOMC |
Strategic Takeaways and Scenario Matrix
Our primary outlook anticipates range-bound consolidation between $81,300 and $86,500 heading into the 14 October US CPI data, with repeated retests of $84,000. Moderate ETF inflows and negative perpetual funding suggest aggregate positioning is leaning short, which sets up potential squeeze conditions while $81,300 holds.
| Scenario | What we need to see | What follows |
|---|---|---|
| BTC holds $84,000 | Positive ETF flows each session; funding returns towards three percent as shorts close; STH-SOPR stays above 1.0 | The $84,000 to $87,722 range resumes. A move through the yearly open requires ETF sessions at or above $340 million, with $90,000 as the next level |
| Sustained trading below $84,000 | ETF flows flat to slightly positive; STH-SOPR at or above 1.0 | A quick move through thin supply towards $81,300 to $82,600. The range ends but the recovery remains intact |
| Sustained trading below $81,300 | Two or more consecutive ETF outflow sessions; STH-SOPR below 1.0 for several days | Our view changes. The next reference is the True Market Mean near $77,400 |
The three readings merit daily monitoring: total ETF flows, STH-SOPR relative to 1 and funding. If funding recovers while OI remains flat, it would indicate that shorts are being closed. If funding stays near zero while BTC trades below $84,000, it would suggest that shorts are continuing to build.