

Bitcoin Hits The Line Between a Bull Market and a Bear Recovery
Bitcoin traded to $87,392 on 21 September, its highest print since 29 January, and has held between our high volume, cost-basis node of $85,000 and $86,500 since. The key question now is whether the advance from the $57,803 low of 1 July marks the beginning of a new bull market or a bear market recovery that eventually reverses.
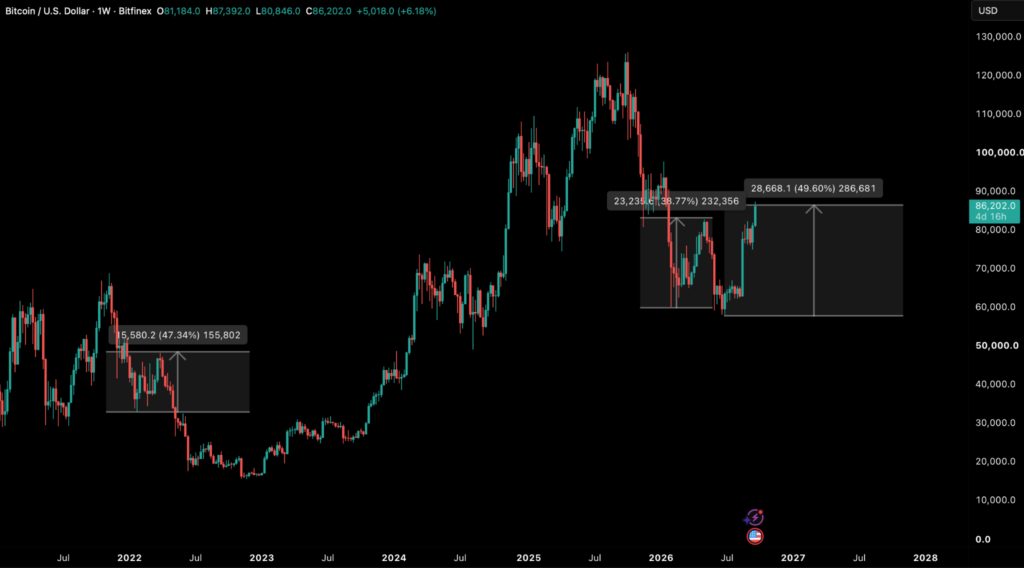
Over the last two cycles, recoveries from fresh cycle or multi-month lows that did not develop into new bull markets typically topped out around the 50 percent mark.
The move has been supported by both demand engines we discussed in Bitfinex Alpha issue 223: spot exchange-traded funds (ETFs) and the corporate treasury bid, which provided buying pressure in the same week for the first time this year.
The following table sets out the readings we weight most heavily and the signature each has shown in past transitions.
| Metric | Reading | Bear market recovery signature | New bull market signature | What we watch next |
|---|---|---|---|---|
| Share of supply in profit | 78.2 percent on 22 September, from 63 percent on 17 September | Rises into the 70s on the rally and rolls over as newly profitable holders sell | Holds above roughly 75 percent for months and grinds toward 90 percent before the market overheats | Whether it holds above 75 percent on the first red week; a fall back through it means the rally was sold by the holders it put in profit |
| MVRV (price divided by the average cost basis of all coins showing net profitability of active supply in the market) | 1.62 on 22 September; 1.09 at the 1 July low; long-run mean about 1.8 | Peaks below or near the long-run mean and fails; the 2019 recovery pushed above it before failing for lack of new demand | Crosses the mean and stays above it; tops in past cycles came above 3.5 | The mean sits near $95,000 at today’s realised price; a sustained move above it with continued ETF inflows indicates a bull market |
| Short-term holder MVRV (price divided by the cost basis of coins younger than 155 days) | 1.20 (price against a $71,763 cohort cost basis) | Fails to hold above 1.0; on 3 September it reached 1.14 and the rally failed within a week. Currently in the “warm region” right now at 1.2 | Stays above 1.0 through corrections; local tops in the 2024 advance printed near 1.4 | 1.3 to 1.4 maps to above $93,000 from the current cohort cost, which is where the recent-buyer cohort has historically been extended enough to sell |
| Net unrealised profit and loss (NUPL) | About 0.39, from 0.31 on 16 September and 0.09 at the July low | Stalls in the 0.25 to 0.5 band | Moves through 0.5 into the band that has marked belief phases, with 0.75 the euphoria line | A push through 0.5 would require price near $105,000 at today’s realised price, so this one confirms late, not early |
| Long-term holder SOPR (sale price divided by cost for coins older than 155 days) | 0.77 on 16 September [latest available, provider lag] | Long-term holders sell at a loss into the rally, then at breakeven | Above 1.0 and rising as long-term holders take profit into strength and the market absorbs it | The January buyers who have aged into this cohort reach breakeven at $87,000 to $90,000; a sustained reading above 1.0 with price rising is the transition marker |
| Price against the True Market Mean and the realised price | 12 percent above the $76,677 True Market Mean; 63 percent above the $52,785 realised price | Loses the True Market Mean on the first sustained selling | Holds the True Market Mean on pullbacks | $76,677 needs to hold on the 30-35 percent pullbacks commonly seen in bull markets |
| New capital: ETF cohort and corporate cohort cost basis | ETF investor break-even near $86,000; corporate cost basis $80,500 | Both cohorts underwater, no net buying | Both in profit and still buying | Both are at or above water this week for the first time since January; the test is whether they keep buying above their own cost |
Taken together, these cycle metrics place Bitcoin in the early part of a transition rather than a confirmed bull market.
Cycle Metrics Point to an Early Transition
Supply in profit is one of the earliest cycle stage indicators. In every bear market, the measure has fallen below 50 percent before recovering. This was observed between late June and early July. This metric needs to hold the 75 percent line that separated bear and bull regimes in past cycles.
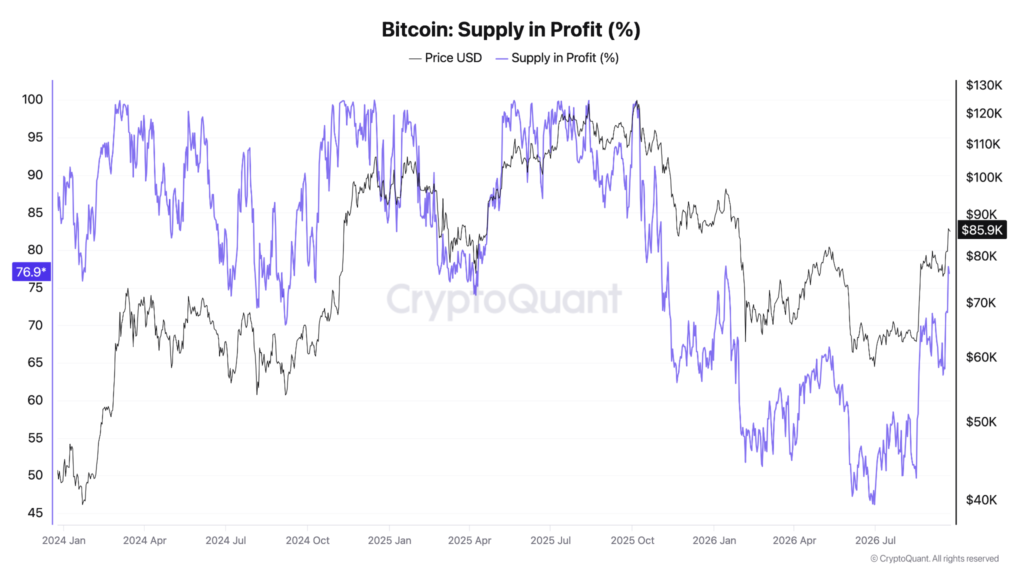
MVRV, at 1.62, is approaching its one-year average while still below its long-run mean of about 1.8. This is comparable with the early stages of the 2019 and early 2023 recoveries. Short-term holders are also in profit, with room before the move can be considered overheated. The long-term holder cohort distributed supply through late August, its first sustained selling this year. Its net position change remains negative on aggregate, though at a much slower pace than in August. Both are consistent with the early stage of a recovery.
Long-term holder (LTH) supply typically oscillates between periods of net buying and selling. During the beginning of bull markets, and typically during uptrends more broadly, LTH buying peaks aggressively in the intermediate ranges after a significant breakout, before the uptrend continues higher. This was observed in each of the 2018 and 2022 bear markets, as well as during the eight-month range in 2024 after which BTC reached new highs. The same pattern repeated in mid-2025 before the current all-time high (ATH) was reached in October 2025.
In our view, the breakout in mid-August and again in September through the pivotal $85,000 threshold, if complemented by the same LTH accumulation signal, would confirm the beginning of a bull market.
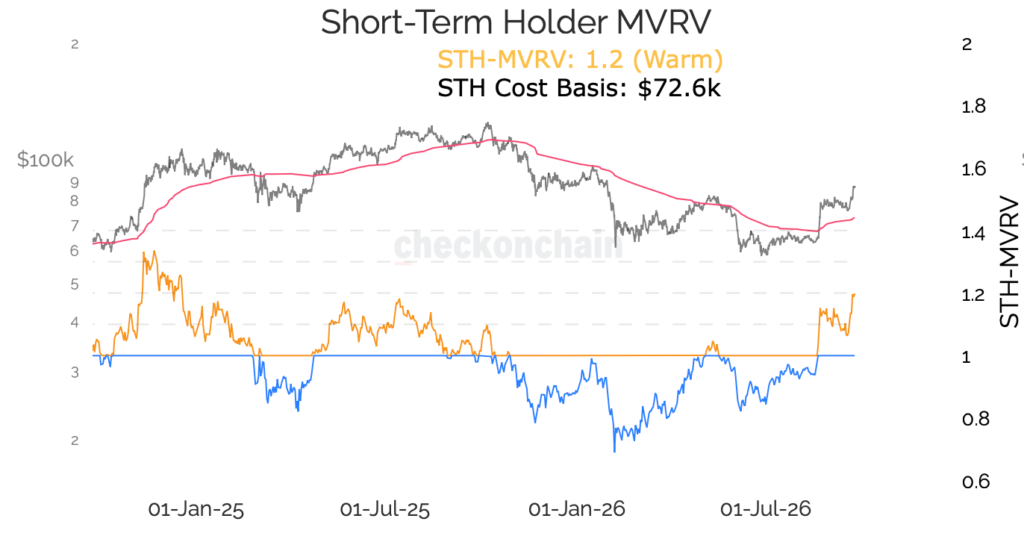
The Short-Term Holder MVRV (price divided by the cost basis of coins younger than 155 days) currently sits near 1.2, placing it in the “warm” region, below the overheated threshold. A 1.3 to 1.4 reading maps to above $93,000 from the current cohort cost, where the recent-buyer cohort has historically been extended enough to take profit. In previous cycles, an initial move toward 1.2 typically triggers a pullback before price stabilises above 1 and resumes its uptrend.
Once a bull market achieves full momentum, price tends to hold the STH Realised Price as support during pullbacks, while STH-MVRV stays above 1.2 during healthy uptrends and stretches toward 1.4–1.5 in overheated periods near cycle tops.
The clearest confirmation signals from here are therefore: supply in profit holding above 75 percent through the first correction, long-term holder SOPR moving above 1.0 while price holds and continued ETF and corporate buying above their respective cost bases.
Both Demand Engines Have to Keep Buying Now That Both Are in Profit
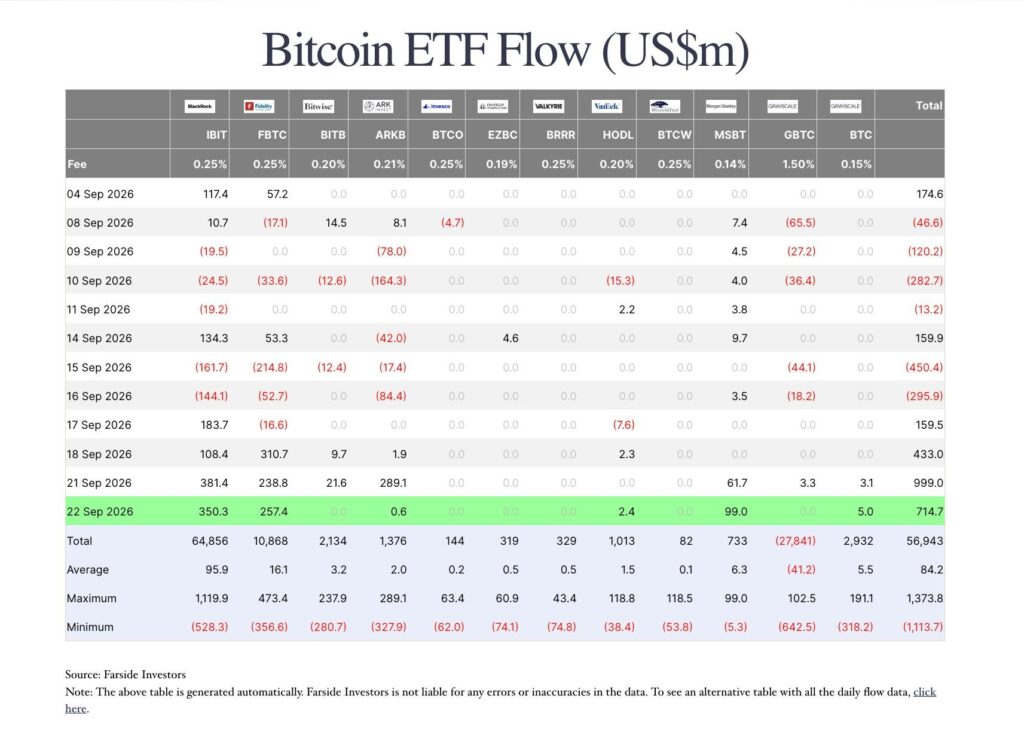
US spot Bitcoin ETFs took in $999 million on Monday, 21 September and a further $714.7 million on 22 September. In dollar terms, Monday was the largest single-day inflow since 6 October 2025, the day bitcoin reached its ATH. In coin terms, the inflows amounted to about 11,530 BTC, the largest since 11 November 2024.
Four sessions earlier, on 15 September, the same funds had recorded their largest outflow since June at $450.4 million. Across the four sessions from 17 to 22 September, the ETF complex absorbed $2.31 billion, roughly 27,900 BTC at each day’s average price, or about 62 days of new supply at 450 BTC mined per day.
In tandem, the corporate treasury bid reactivated in the same week, with purchases executed before spot reclaimed the cohort’s aggregate cost basis.
Strategy acquired 950 BTC at an average entry of $79,670 during the week ending 20 September, its first purchase in three weeks. This was funded from USD cash rather than share sales, taking holdings to 846,000 BTC at an average purchase price of $75,416.
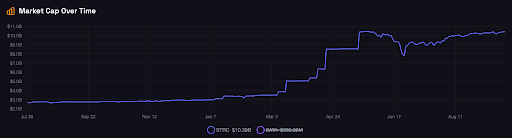
Strive bought 1,355 BTC at $79,475 between 14 and 18 September. That is 2,305 BTC across two corporate treasuries in a single week, against approximately 5,900 BTC absorbed by all public treasuries over the preceding three-month period, with every purchase executed below the $80,500 corporate cohort cost basis. Strategy also spent $174 million repurchasing STRC preferred shares against $75.7 million on spot BTC, with STRC closing 22 September at $99.06, below the $100 par at which the product can raise new capital for purchases.
The underlying on-chain shift underlines the key difference between current market structure and the 3 September breakout attempt, when a single session of ETF inflows met overhead supply and failed. About 2.95 million BTC moved into net profit over four sessions and the realised price distribution shows where that buying settled.
Supply concentrated between $80,500 and $82,500 thinned from 252,000 to 170,000 BTC per $1,000 of price between Sunday and Tuesday, while a new high-volume node of 633,000 BTC formed between $85,000 and $86,500, the largest cost-basis band in the entire profile.
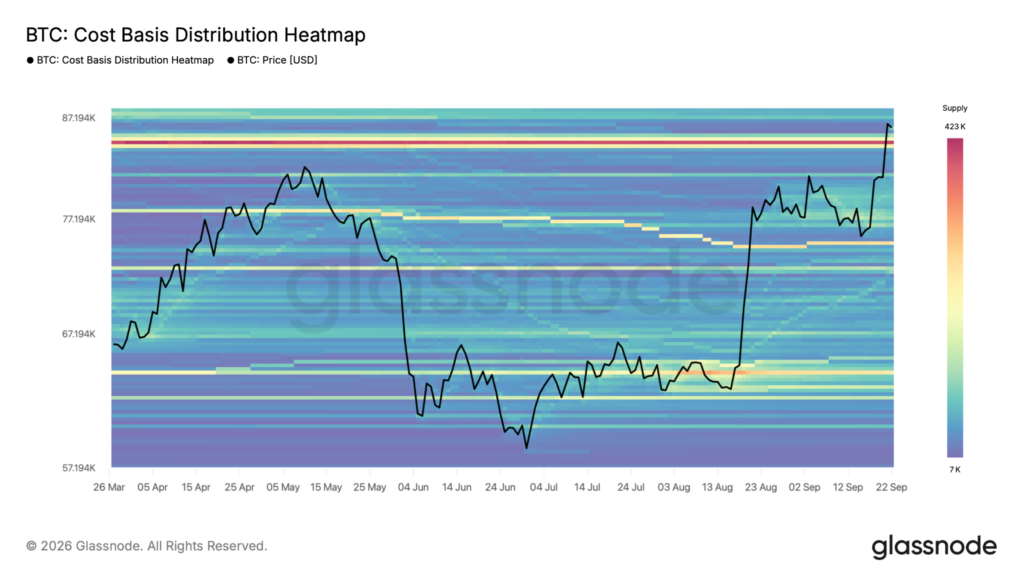
This volume reflects this week’s marginal buyers, both ETF and corporate, establishing the primary structural support immediately beneath spot.
With the aggregate ETF cohort cost basis returning to breakeven near $86,000 for the first time since January, both demand engines are holding profitable positions simultaneously.
The critical test will be whether both cohorts maintain continuous net buying above their respective cost basis. Structural bids that only activate below average entry function merely as downside support rather than driving sustained expansion.

Altcoins Outperform Bitcoin at 1.8x; the First Red Day Is the Test
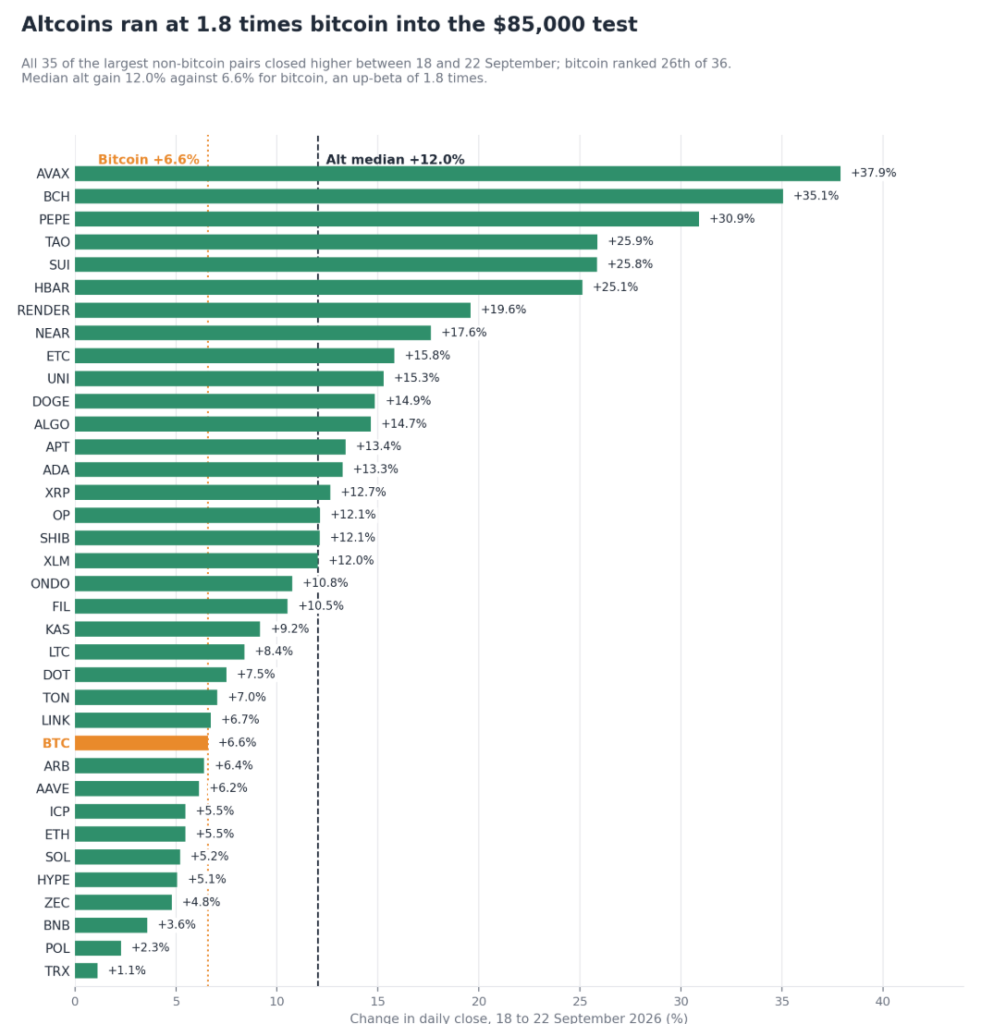
From 18 to 22 September, all 35 top non-BTC pairs tracked by Bitfinex appreciated, with a median rise of 12 percent versus BTC’s 6.6 percent (1.8x beta). Mid-caps led the rally: AVAX surged 38 percent, BCH added 35 percent, SUI climbed 25 percent, and Hedera rose 25 percent. Mega-caps lagged, with Ether gaining 5.5 percent and SOL 5.2 percent.
Ether underperformed despite US spot ETH ETFs seeing $270 million in net inflows on 21 September, their largest since 7 October 2025, followed by $162.2M on 22 September. ETH price pushed past $2,668.
Aggressive short liquidations also contributed to the rally, with $145 million in ETH shorts closed over 24 hours.
The key difference from previous altcoin rallies is that BTC is breaking at the same time. The Altcoin Season Indicator was positive on 22 September for the first time since January.
The true test is the first red BTC session: altcoins holding firm through a BTC drawdown of 3 to 4 percent would confirm spot absorption, whereas a median altcoin drop of more than 1.4 times BTC would signal a leverage-driven rally.
Rates Have to Stay Still for Bitcoin to Keep Trading Like the Nasdaq
Bitcoin’s 30-day correlation of daily returns is 0.55 with gold, 0.40 with the S&P 500, 0.38 with the Nasdaq 100, and -0.37 with the US dollar.
The gold connection weakened as crypto-specific flows drove recent moves. From 18 to 22 September, Bitcoin rose 6.6 percent, outperforming the Nasdaq 100, S&P 500, and gold.
Treasury yields remained broadly flat over the same period. The 2-year yield held at 4.76 percent on 18 and 21 September, while the 10-year moved from 5.01 to 4.96 percent.
That suggests the latest leg higher was driven more by flows than by rates. A two-year yield above 4.8 percent, or a higher probability of an October increase, could bring macro back to the foreground.
What We Expect This Week
We remain constructive and expect price to hold the $85,000 to $86,500 node through Friday’s expiry and press the yearly open at $87,722 September options open interest settles. If ETF prints stay positive and funding remains neutral, $90,000 becomes the next upside level to watch.
On a move below that node, we expect the $80,500 or so region to provide the first area of support and then for the $85,000 to 86,500 region to continue acting as resistance until the next range breakout is catalysed. What would change our view is price moving back below $81,300 on a sustained basis, especially if this happens on a red ETF print with the altcoins median falling more than 1.4 times bitcoin. A move below the previous range high on a red print ends the acceptance reading entirely.
On-chain, we would want to see supply in profit hold above 75 percent, adjusted SOPR remain near 1 while price holds the node, long-term holder SOPR move above 1 and next Monday’s corporate filings show a second week of purchases now that BTC is trading above the corporate treasury cohort’s cost.