

Issue #229:
Can Bitcoin Hold $77,000 While Nasdaq Slides?
Bitcoin Resets as Hike Odds Shift
Bitcoin’s recovery into the $77,000 to $80,000 support band following a brief breakdown suggests that buyers are defending this critical area, but weak spot demand and pressure from technology equities leave its durability uncertain.
Bitcoin fell 12.7 percent from its recent high to $76,311 on 30 October, briefly below the True Market Mean at $77,709, and recovered to $78,074 by 1 November. The recovery brought bitcoin back inside the band, but the test of support remains unresolved.
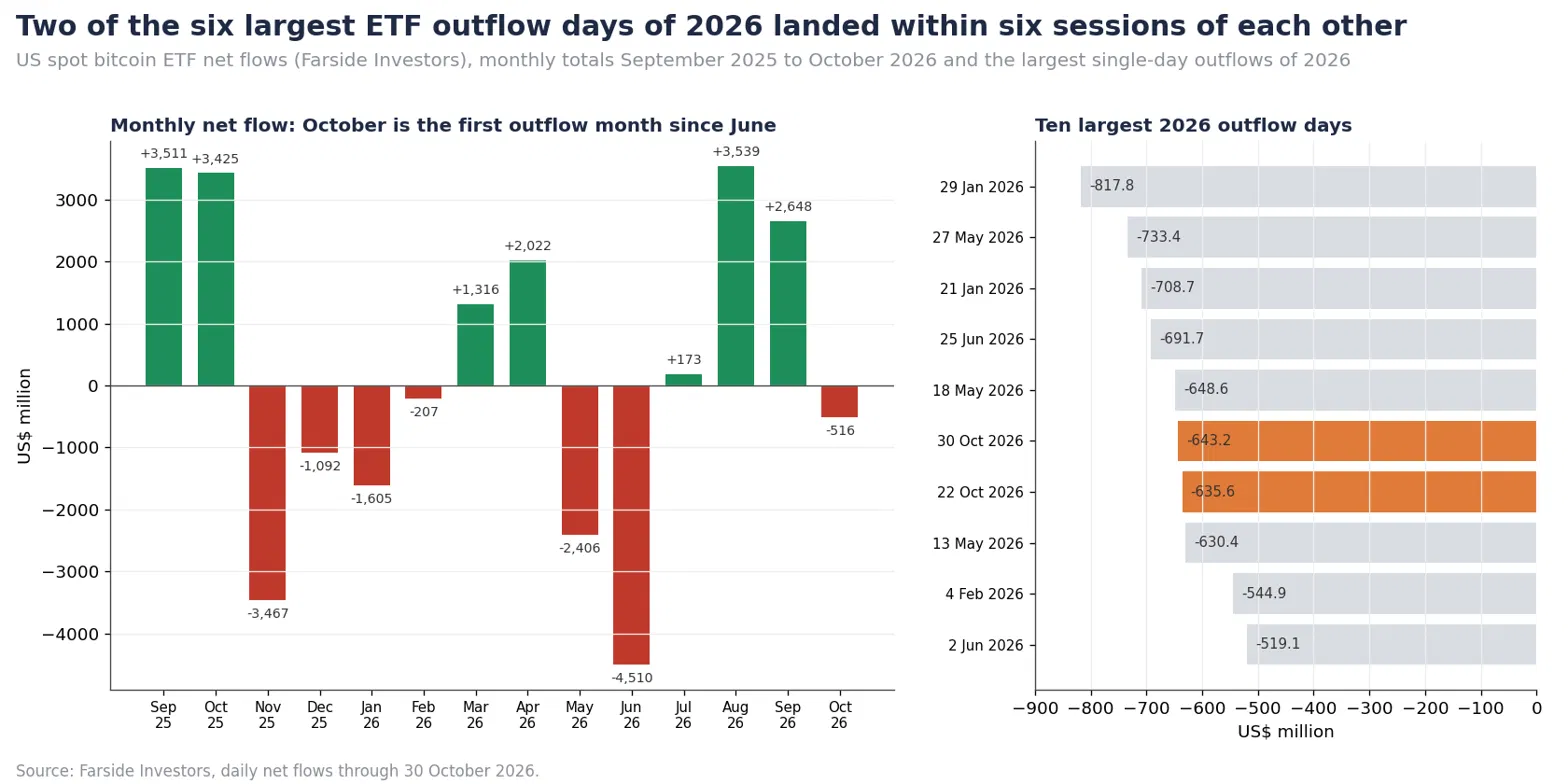
Leveraged buyers rebuilt into the decline, with aggregate futures open interest rising 12.1 percent to 694,728 BTC over 19 days while price fell 5.3 percent and funding stayed positive. Spot holders did the opposite: short-term holders sold at a loss for the first time since August, with SOPR at 0.992, and US spot bitcoin ETFs lost $643.2 million on 30 October, turning October into the first net outflow month since June.
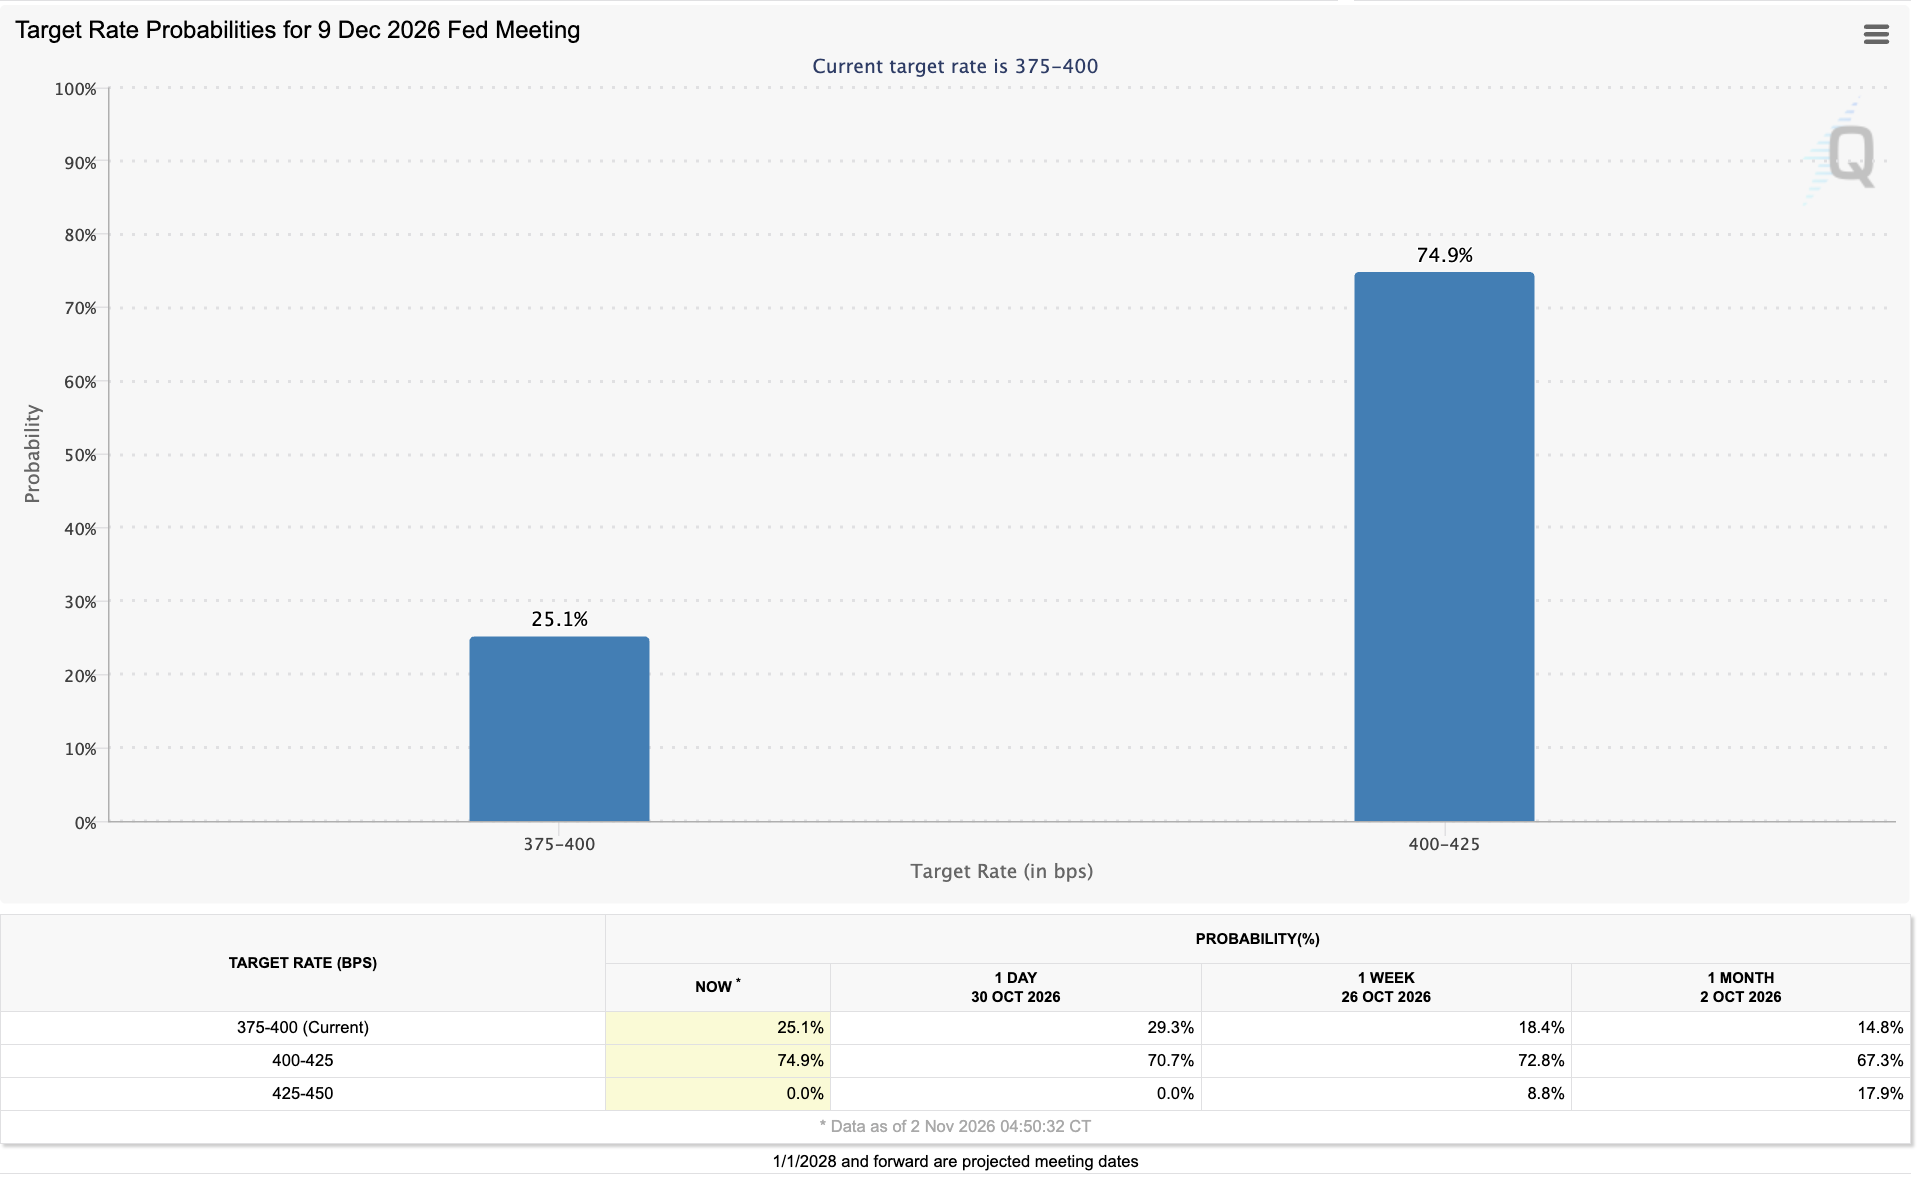
Macro added pressure rather than relief. Third-quarter GDP grew 3.4 percent annualised and September PCE inflation rose 0.5 percent on the month and 3.6 percent on the year. The data came the day after the Fed held interest rates at 3.75 to 4 percent with two dissents in favour of a hike, and markets priced a December hike at 74.9 percent. The 10-year real yield still fell to 2.6 percent as investors rotated out of AI equities into bonds, yet bitcoin fell with the Nasdaq rather than rising as yields fell.
Our base case is that the band holds and rallies into $81,300 are sold. The one factor that would change it is a second leg lower in US technology stocks, which would bring the short-term holder cost basis at $75,772 into play before the 6 November jobs report.
Market Signals
Price Structure: The $77,000 to $80,000 Band Is Being Tested
Bitcoin’s recovery into the $77,000 to $80,000 support band following a brief breakdown in the wake of the Binance hack last week, suggests that buyers are still defending this critical area. However, relatively weak spot demand and mounting pressure from the valuation of technology stocks in the US continue to pressure BTC.
Over the past week, bitcoin tested the True Market Mean (TMM — the average cost basis of all active investors), now $77,709, ending October down 7.3 percent.
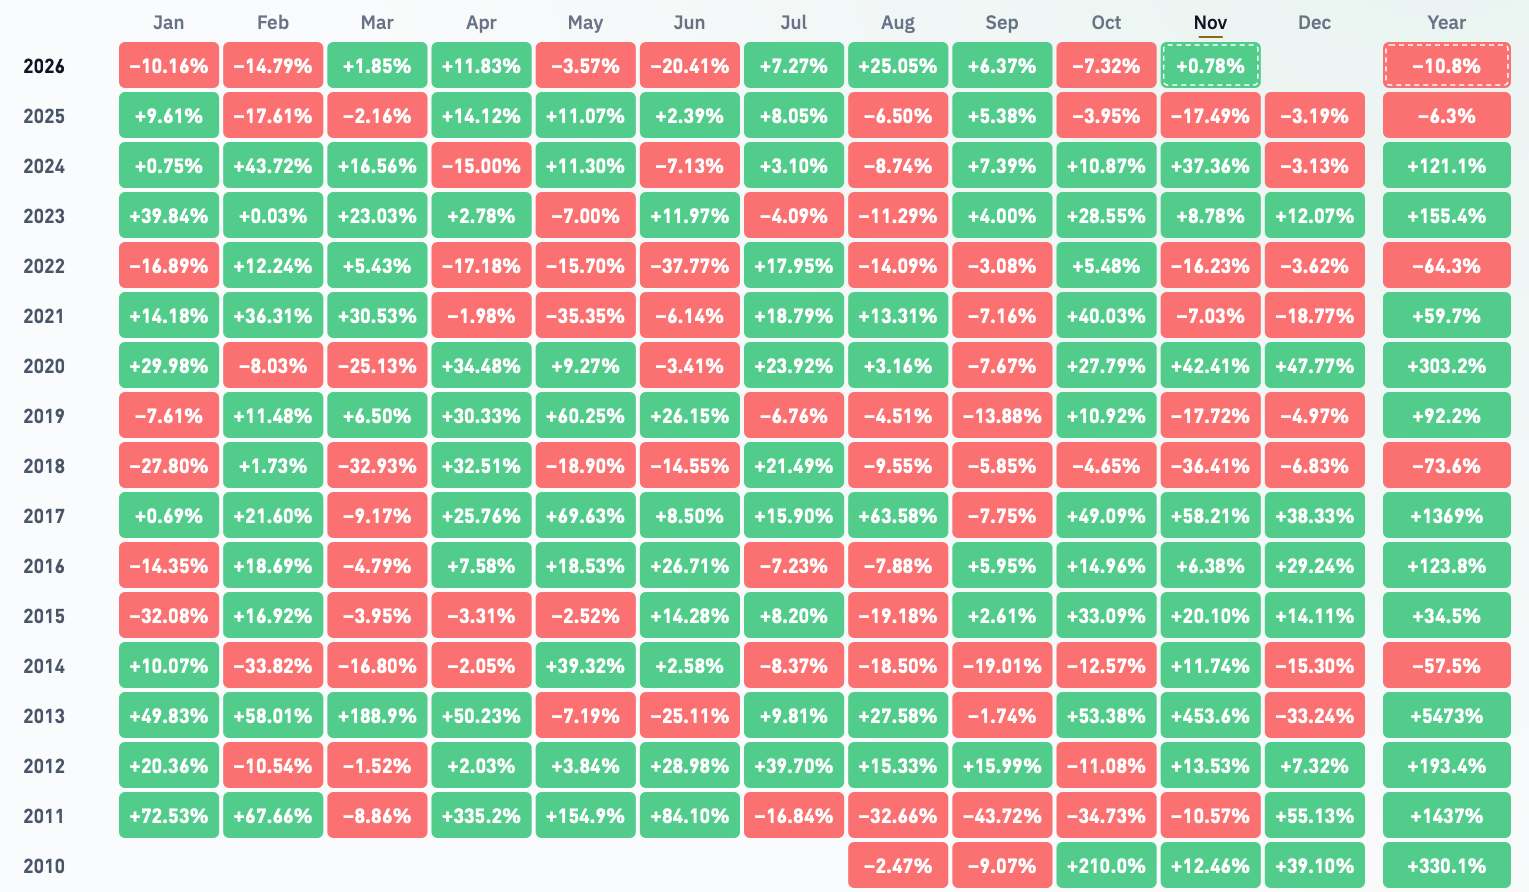
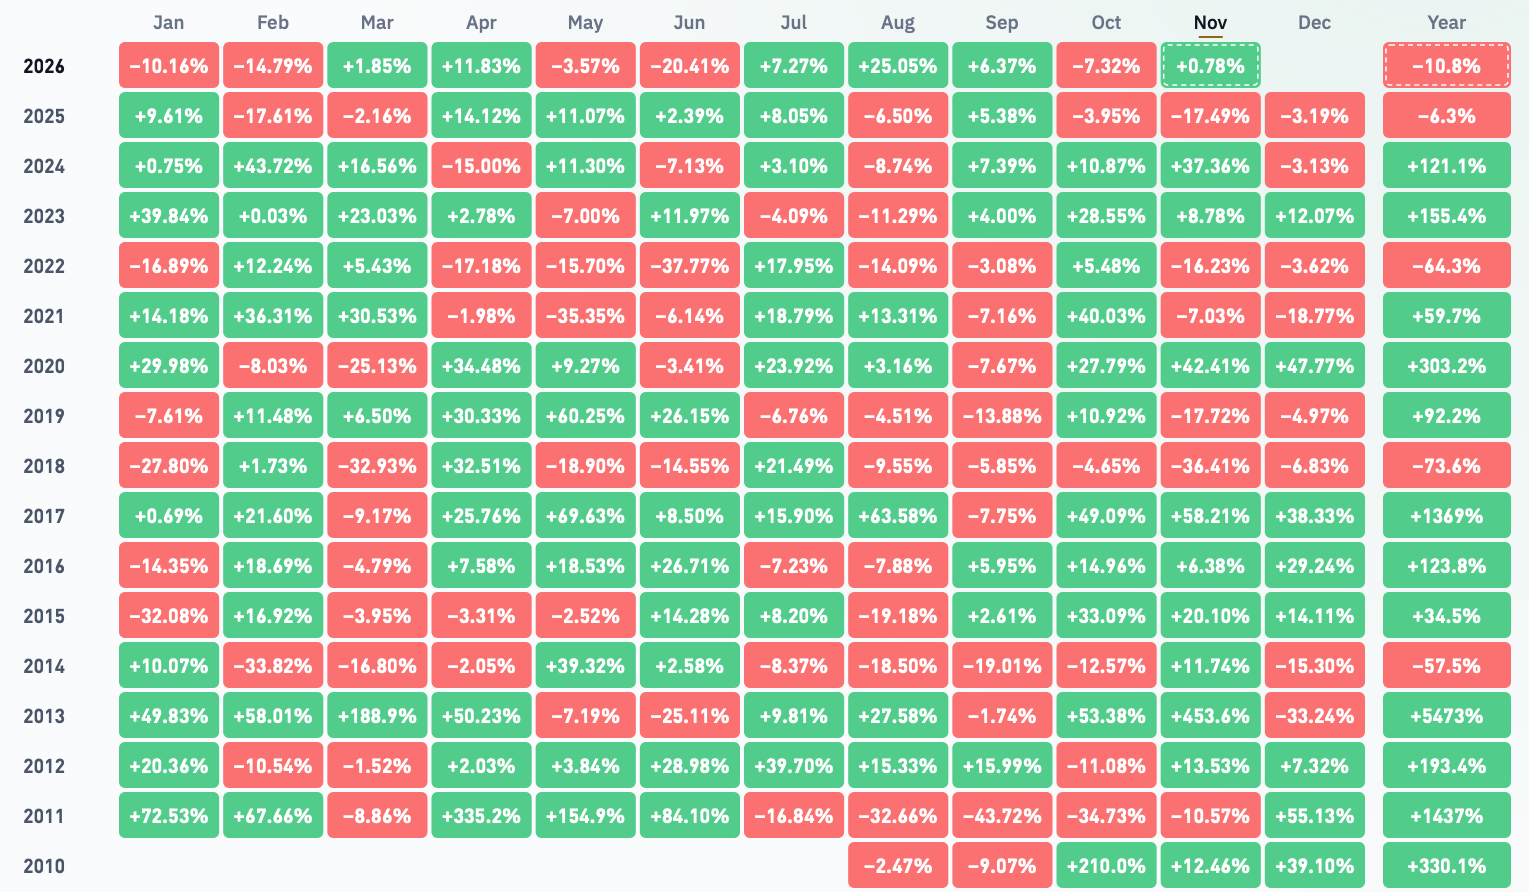
October has historically been a bullish month for bitcoin, even in bear market years such as 2019 and 2022, and has provided a median return of 10.9 percent since 2010. Despite entering October 2026 on the back of strong gains in August and September, both historically bearish months, it has failed to sustain its momentum amid weak spot demand and macroeconomic pressures. The selloff in major technology stocks has added to these pressures with Alphabet, for example, recording its worst single-day decline since 2004 and Intel its worst since 1974.
In last week’s Bitfinex Alpha (26 October), we wrote that $81,300, the highest-volume node between $68,000 and the September high, had flipped from support to resistance, and that sustained trading below it would make the True Market Mean the next reference level. In the 28 October Intelligence Update we widened that into the $77,000 to $80,000 support band, with a daily close below $80,000 as the signal that the test had begun.
Both conditions materialised last week. Bitcoin held above $80,000 through the Fed decision on Wednesday 28 October, with a low of $80,393, and absorbed the market’s reaction to Alphabet’s earnings miss on 29 October, reaching a high of $81,999 that afternoon, before the Binance hack late in the US session resulted in a daily close of $78,011 under the key pivot. The 30 October equity selloff then catalysed last week’s low of $76,311, and the day closed at $77,361, below the True Market Mean of $77,692, the first close below that level since mid-September. A mechanical bounce over the weekend has, however, resulted in price trading back inside the band.
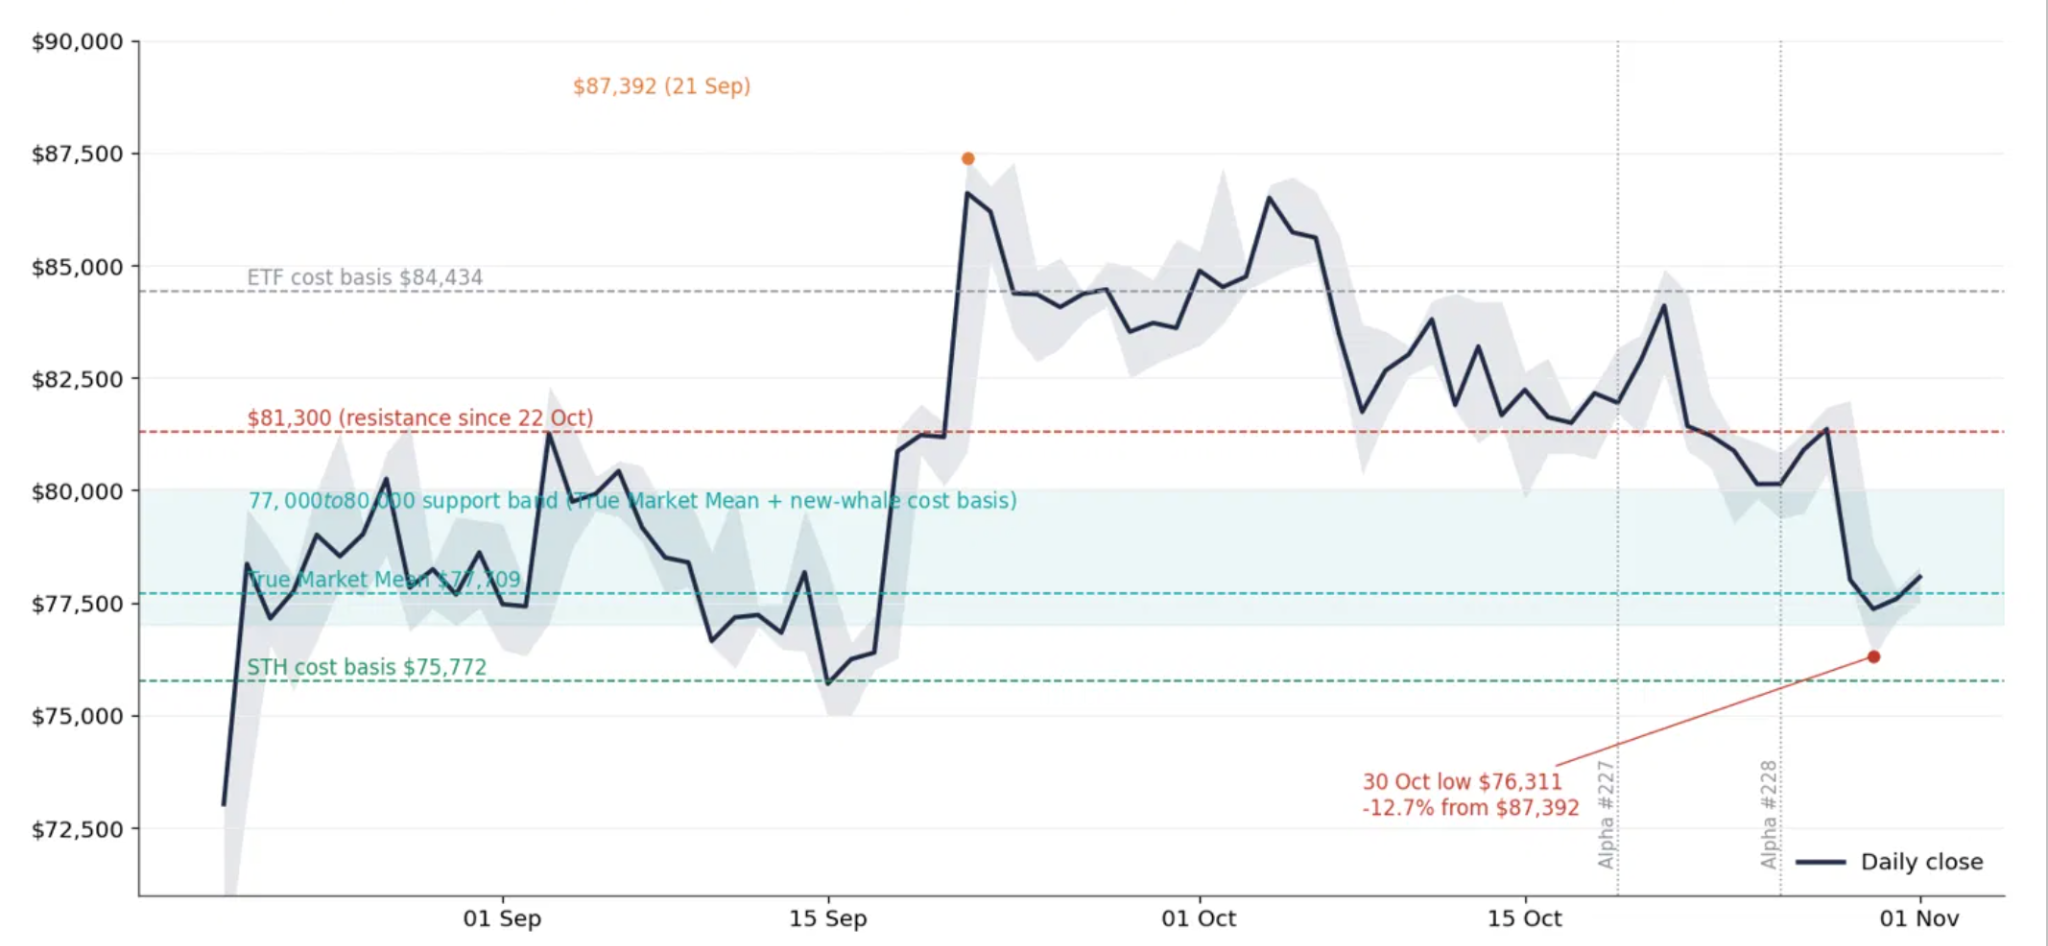
We read the move in two parts: the exchange incident triggered an initial liquidity shock, followed by further selling pressure as technology equities declined. So far, the band has held on a recovery basis, since the dip through the True Market Mean on 30 October lasted less than two sessions and was recovered, suggesting the level is still functioning as the floor. At the time of writing, bitcoin remains 10.8 percent below its October highs, having briefly traded $689 below the band’s floor.
The reason the support band is relevant is the concentration of supply around where bitcoin’s current holders bought their coins. Grouping the circulating supply by purchase price shows a market that is heavy above the current price and light below it:
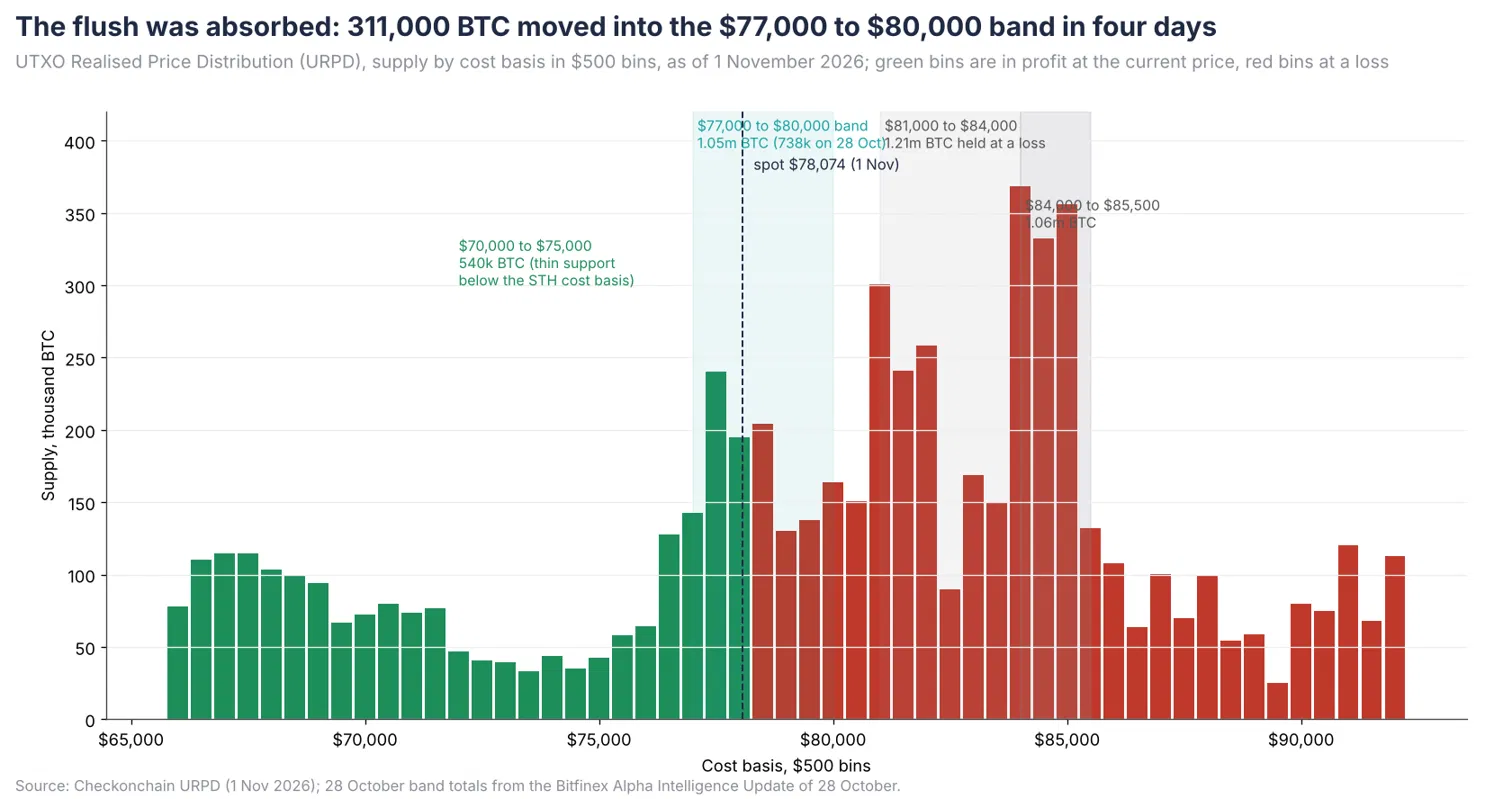
Between $77,000 and $80,000, holders now own 1.05 million BTC, up from 738,000 BTC on 28 October. The 311,000 BTC added over the past four days indicates buying activity within the band during the selloff, suggesting that buyers are defending this level. Above the current price, 2.26 million BTC was acquired between $81,000 and $85,500, creating potential selling pressure as holders seek to exit closer to breakeven. Below the band, supply is considerably thinner, with only around 540,000 BTC acquired between $70,000 and $75,000. This makes the short-term holder cost basis at $75,772 particularly important, as there is less concentrated ownership below it to slow a decline.
The spot aggregated order book tells the same story from the other side. Resting bids between $78,000 and $79,000 have grown to about $42 million from about $24 million in mid-October, while the bids at $80,000 that were absorbed on 24 October have not been replaced, which indicates that buyers may have moved their orders to lower prices. The overhead is heavier than the recent buyers alone: more than half of the coins held by recent long-term holders, the cohort that has held for more than 155 days, were bought above the current price, with the bulk of that supply, about 4.5 million BTC, carrying a cost basis between $85,000 and $118,000. A recovery towards $84,000 to $85,500 would meet sellers who can potentially exit their holdings at breakeven.
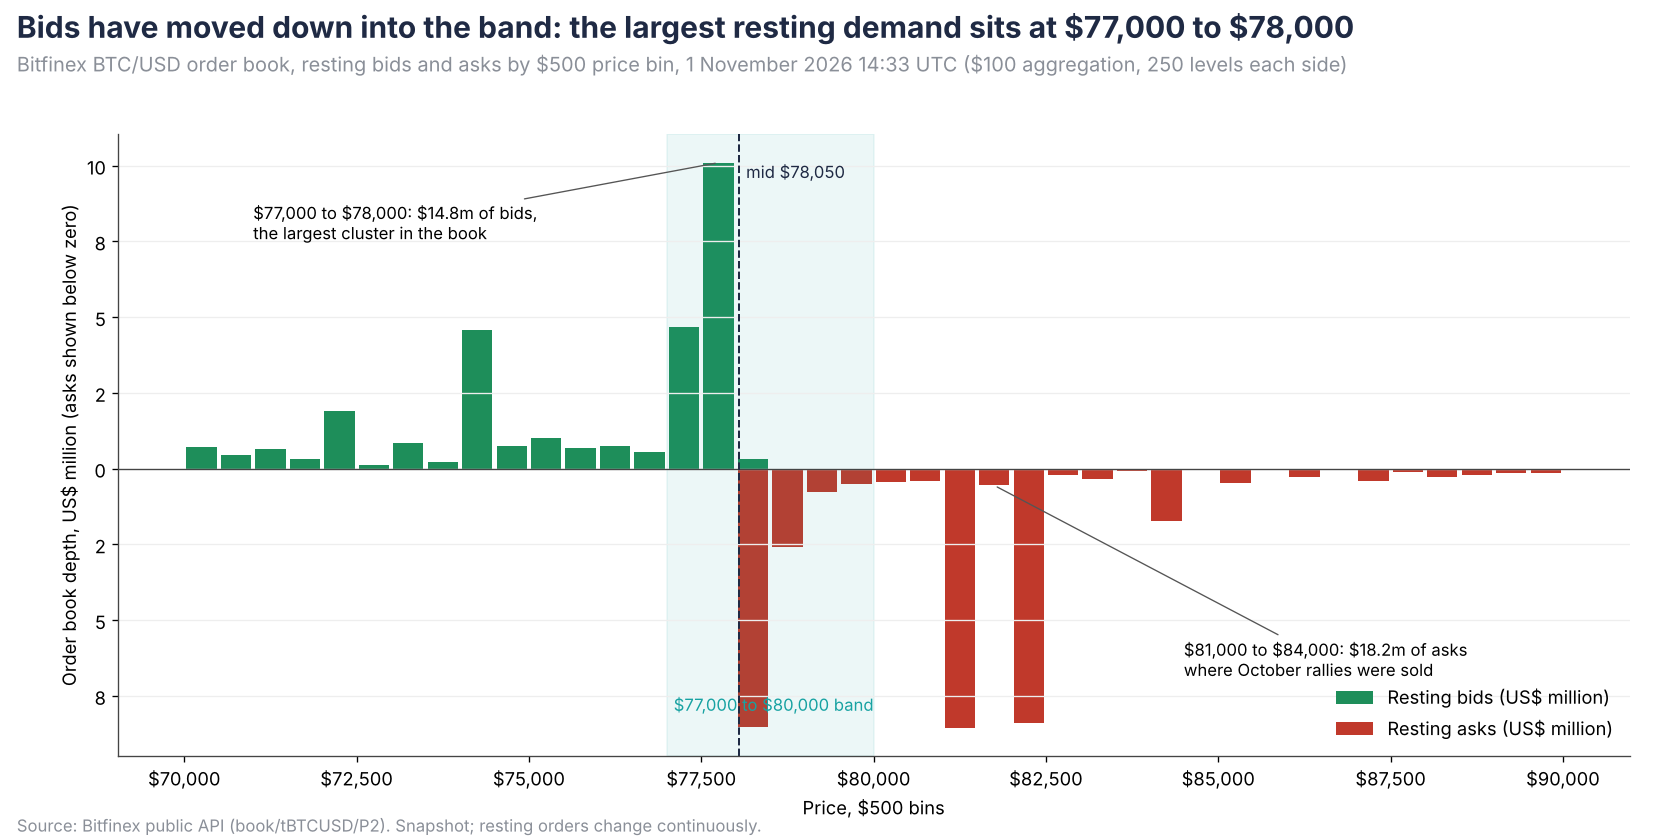
If these passive spot buyers are accumulators, then the band is well-supported. If they were short-term traders seeking a quick profit by absorbing aggressive selling pressure in a thin order book, however, the resulting bounce may prove temporary. Without sustained aggressive buying in the spot market, bitcoin could remain stalled within the band.
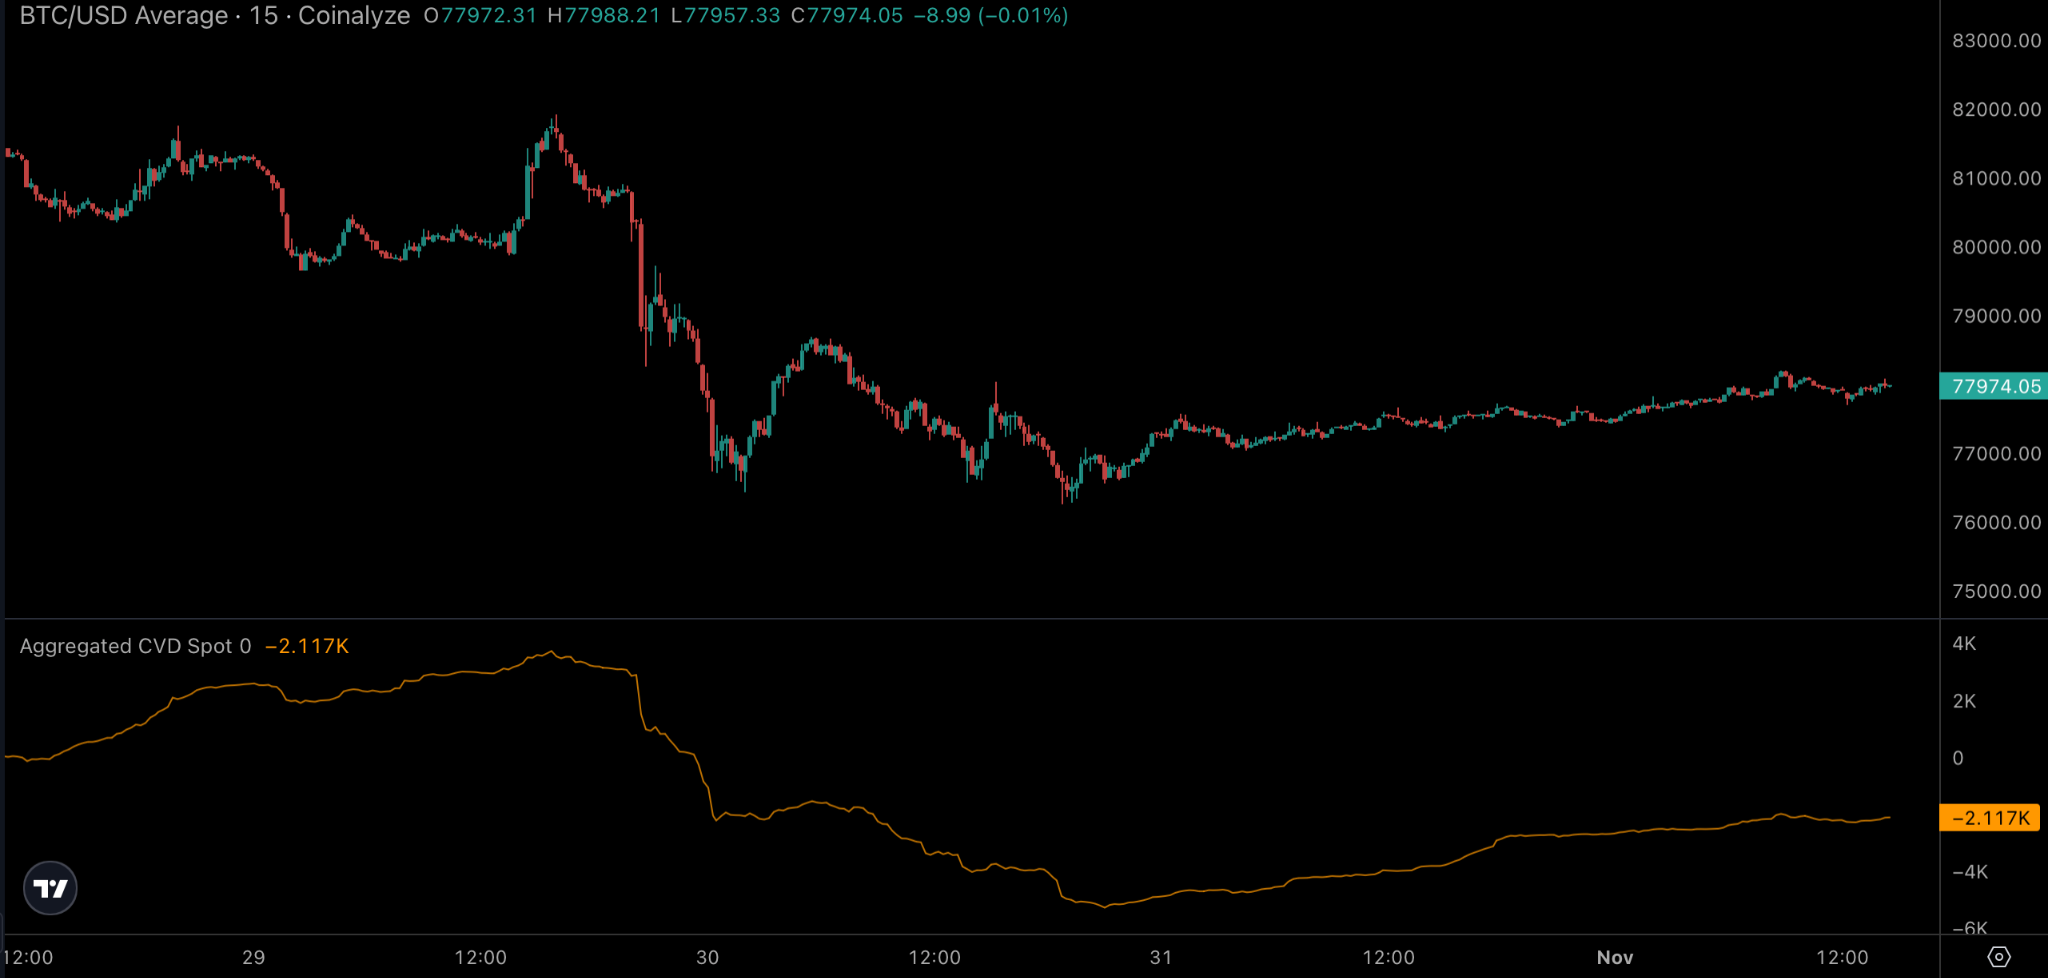
The spot cumulative volume delta shown in the positioning section below delivers another interpretation: the current buying we are seeing inside the $77-80,000 band is passive, not aggressive.

Positioning: Leverage Was Rebuilt into the Selloff While Short-Term Holders and ETFs Sold
The most important reading of the week is that open interest (OI) rose as the price declined.
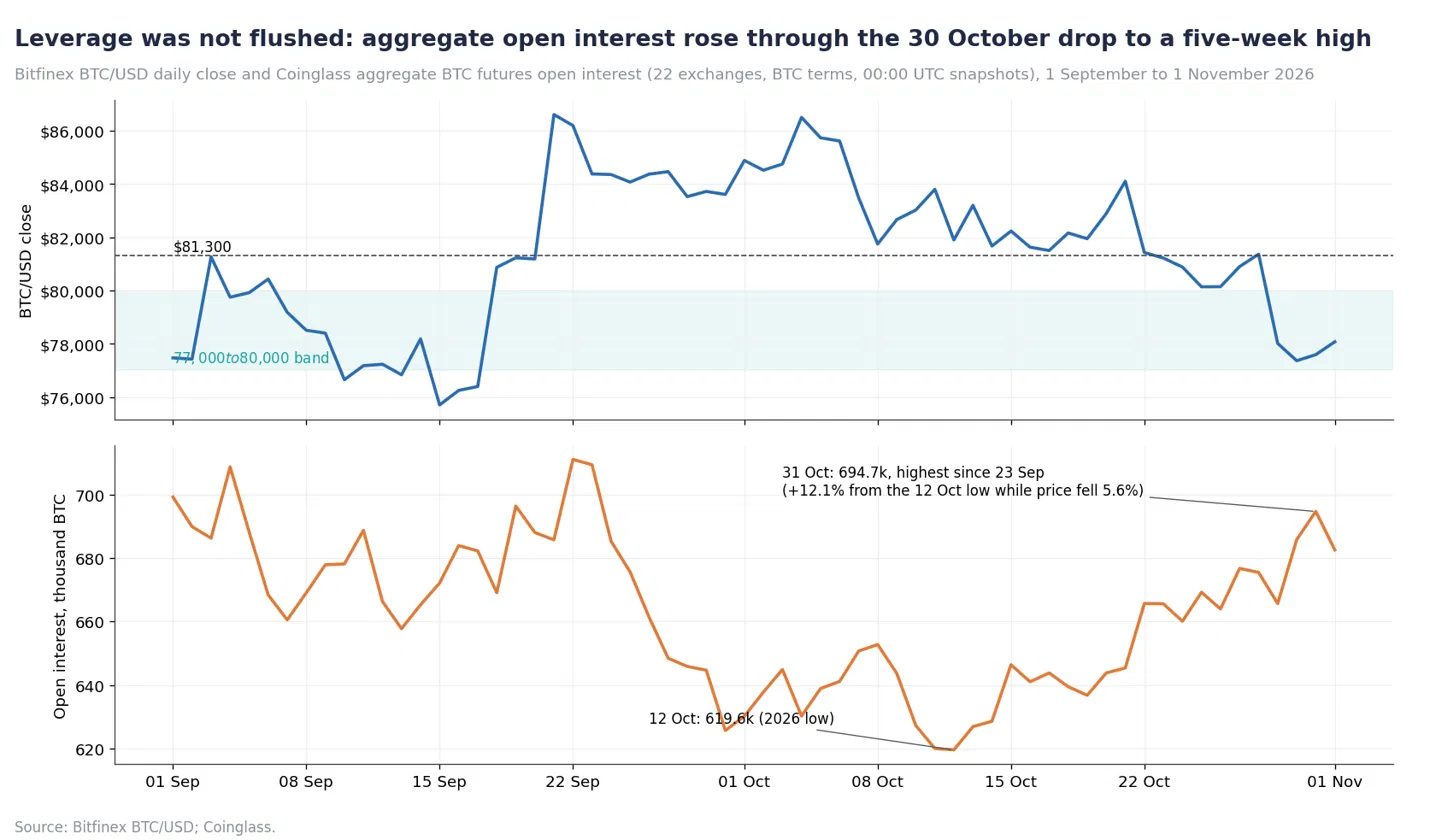
Over the 19 days to 31 October, OI rose 12.1 percent in BTC terms, even as the price fell 5.3 percent, from $81,897 to $77,589. In dollar terms, however, the book remained almost flat at $53.7 billion, suggesting that the long exposure liquidated on 29 and 30 October was replaced by new positions at lower prices within a day. Funding stayed positive throughout, with rates on some major perpetual venues reaching 17 percent annualised during the 30 October session, which suggests that positions were predominantly long. Chicago Mercantile Exchange (CME) OI remained unchanged at 16.6 percent of the aggregate, so the rebuild appears to be an offshore perpetual phenomenon.
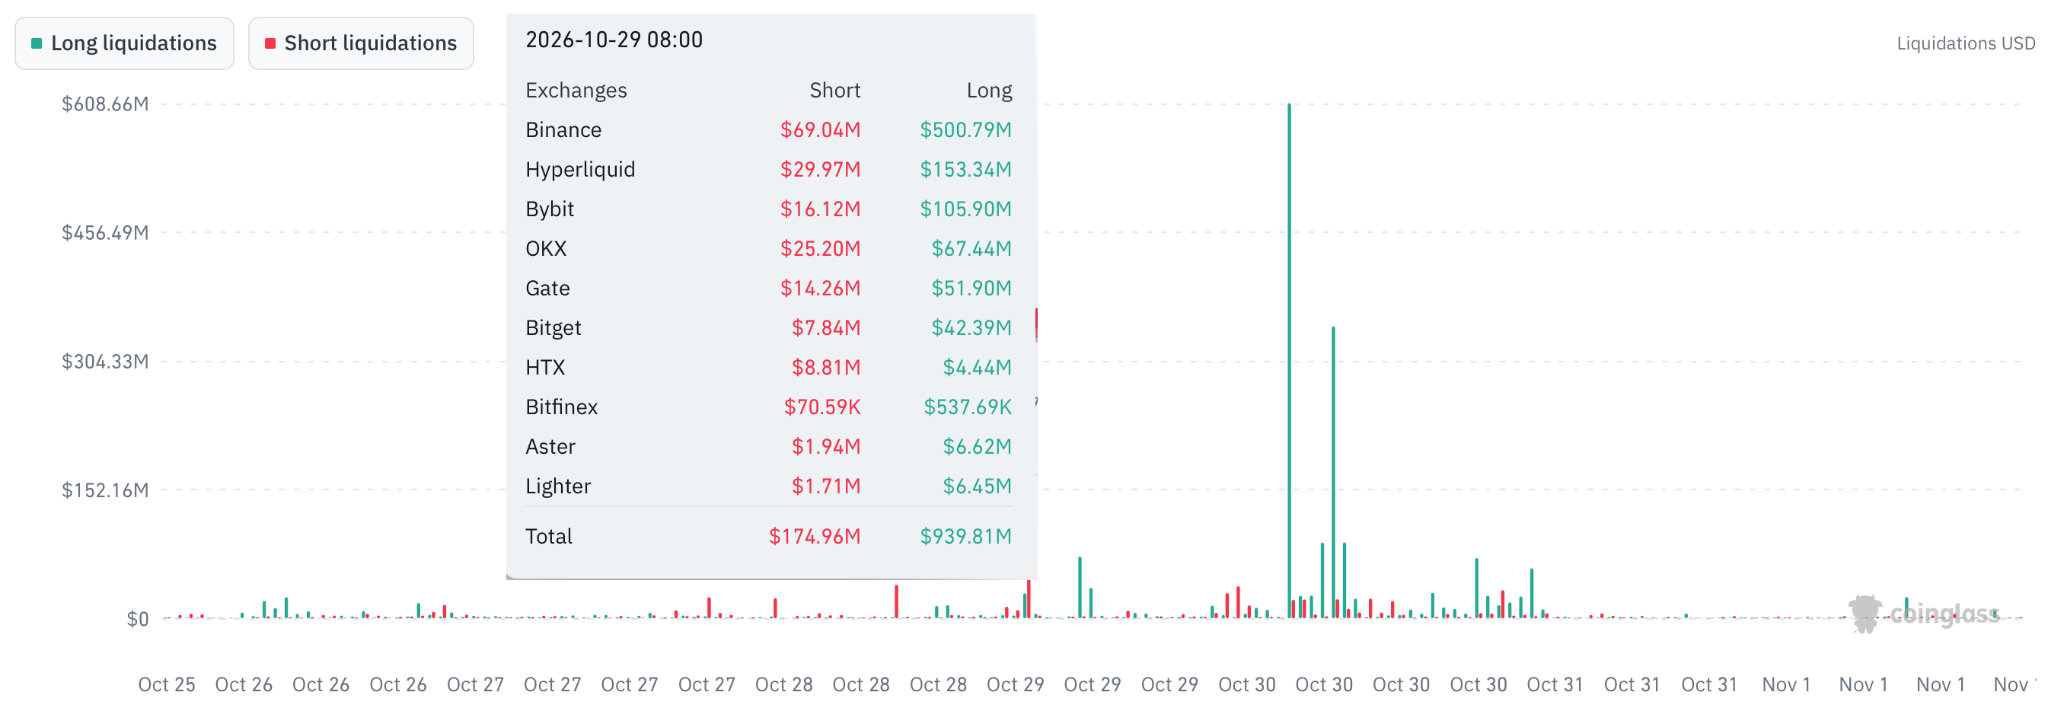
Roughly $1.57 billion in crypto futures positions were liquidated in the 24 hours leading up to the morning of 30 October as the Binance hack news emerged, more than 80 percent of them longs, including $522 million in bitcoin positions. This was the fourth long liquidation event since 8 October.
The cumulative volume delta (CVD), which measures the difference between aggressive buying and selling volume, provides additional insight into trading activity during this decline, with positive CVD detected as Bitcoin dropped to the $76,311 low would indicate net aggressive buying at that level.
The on-chain cohort data indicates the opposite behaviour, and the contrast is the key to the coming week. Short-term holders, defined as coins younger than 155 days, sold at a loss for the first time since the August low. The short-term holder SOPR, which measures the ratio between the sale price and acquisition price of spent coins, printed 0.992 on 30 October, the lowest since 14 July. Readings below 1 indicate that holders are realising losses. The metric has been below 1 for three consecutive days up to 30 October, with the last run of that length ending on 17 August, two days before the late-August rally began.
Supply in profit across all holders fell to 60.4 percent from 66.7 percent on 28 October. For short-term holders, profitability fell to 34.3 percent from 59.7 percent over the same two days, the lowest since 16 August, a far steeper drop because a major chunk of their cost-basis distribution was between $77,000 and $87,000 and a move to the lower end of that range puts most of them underwater. That cohort’s average cost basis of $75,772 now sits only three percent below the price, which means the average recent buyer is close to breakeven again.
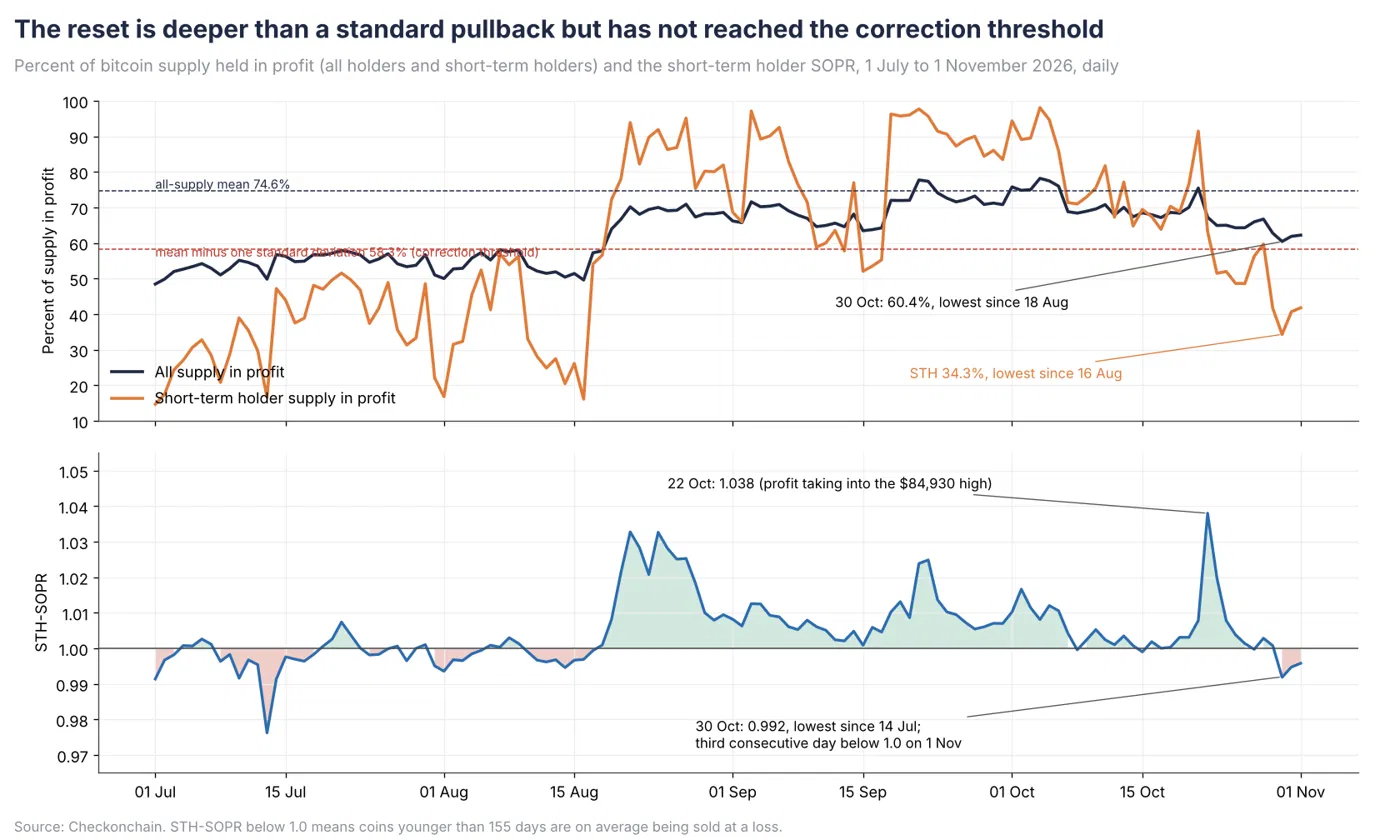
We read this as short-term holders capitulating into a level where longer-term buyers and leveraged dip buyers absorbed them. The 60.4 percent supply-in-profit reading sits 2.1 points above the one standard deviation level below the long-run mean. This would take supply in profit reading to 58.3 percent, which we see as the critical line between a healthy reset and a correction that extends for weeks. So far any readings we have seen below one standard deviation since mid-August have been quickly reversed.
On the question of where we currently are in the cycle, the short-term holder Market Value to Realised Value ratio, which compares market value with the cohort’s realised value, sits at 1.02 against a long-run mean of 1.06. Meanwhile, the all-holder supply-in-profit reading of 60 percent compares with 46 percent at the July cycle low. Together, these readings suggest that the market is in a mid-cycle reset rather than a transition to a bear phase, where both measures would typically sit below their means for weeks.
A daily close with supply in profit below 58 percent and the short-term holder SOPR below 0.98 would indicate that the current test has failed, while readings holding above those lines through the midterms would indicate that it has passed.
The Exchange Traded Fund (ETF) cohort sold alongside the short-term holders rather than buying from them, which is why the band test is not yet resolved. US spot bitcoin ETFs ended the week at a net outflow of $202.4 million, equivalent to an average daily outflow of around $40 million. However, the shape of the week matters more than the total: four small inflow days averaging $110 million, led by IBIT and insufficient to lift bitcoin’s price, were followed by a single outflow of $643.2 million on 30 October, the largest since 25 June and the sixth largest of 2026.
That one print turned October into the first net outflow month since June, after July, August and September had added $6.36 billion between them.
This suggests that ETF investors are trading the range rather than accumulating through it, buying on strength and selling into weakness. The scale of the 30 October outflow recalls the selling seen in the first half of the year, when bitcoin was declining towards its July low. With the average ETF holder underwater on a cost basis of at least $81,500, this pattern may persist until that level is reclaimed.
The wider spot-demand indicators agree. Thirty-day apparent demand, which measures the change in supply held outside exchanges, was negative every day from 14 October and the Coinbase premium, which represents the spread between US and offshore spot prices, was below zero on every October session. This indicates that US spot buyers were absent before the week’s shocks arrived and explains why two external events were enough to push price to the bottom of the band.
The same weakness is evident in the rest of the market. Ether ETFs recorded five consecutive days of outflow totalling $431.4 million, while ETH/USD fell 2.5 percent to $2,272. ETH/BTC stood at 0.0291, still below our 0.0298 confirmation line. Across 15 large Bitfinex pairs, the median drawdown to the week’s low was 2.2 times that of bitcoin, in line with every October pullback. This suggests altcoins remain a leveraged expression of the same positioning rather than a separate story.
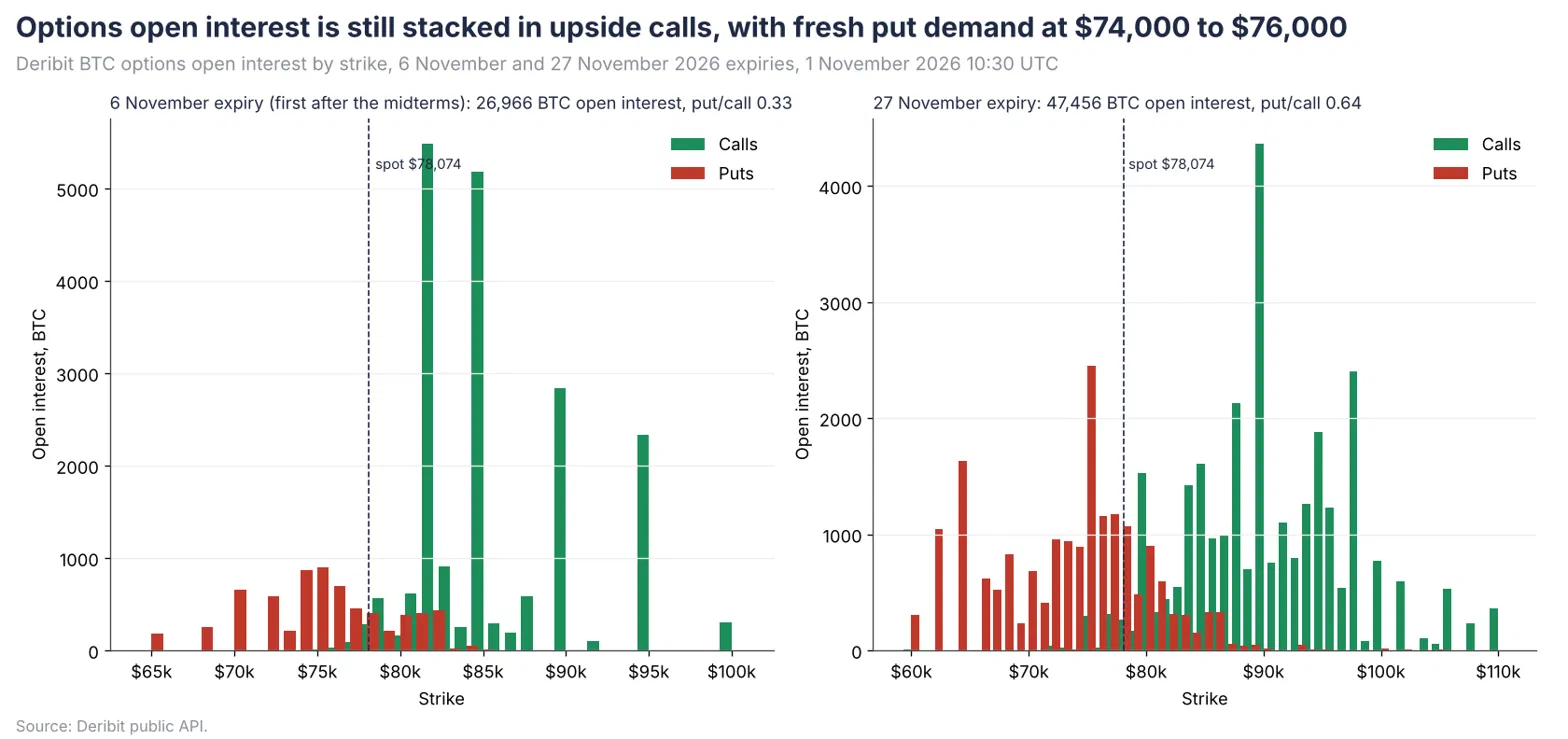
Options positioning suggests that traders are preparing for volatility within a broad range rather than a sustained move in either direction. Bitcoin’s DVOL index, a measure of 30-day implied volatility, rose from 37.3 to a peak of 42.3 on 29 October before retreating to 39.2, indicating that the demand for protection that the Binance incident and the equity selloff triggered has partly, but not fully, faded. The term structure is more informative: implied volatility for the 6 November expiry sits at 40.7 percent against 37.3 percent for 27 November, which indicates that traders see the risk concentrated in a week where we see US midterm elections, rather than spread across the month.
The options expiring on 6 November, the first expiry after the US midterm elections, tells the same story. Put options are concentrated around $74,000 to $76,000, below the short-term holder cost basis of $75,772. Demand for downside protection is also reflected in the higher implied volatility of the $72,000 put (49.9 percent) compared with the $85,000 call (42.3 percent). Nevertheless, call OI exceeds put OI by approximately three to one, with the largest concentrations at $82,000 and $85,000. This suggests that substantial upside exposure remains in place despite the recent decline.
Based on implied volatility of 40.7 percent, the expected trading range through 6 November is $74,400 to $81,750. The 27 November expiry implies a wider range of $70,300 to $85,850, encompassing both the short-term holder cost basis and the overhead supply concentration at $84,000 to $85,500.

Catalysts and Risks
The Tech Selloff We Flagged Has Arrived
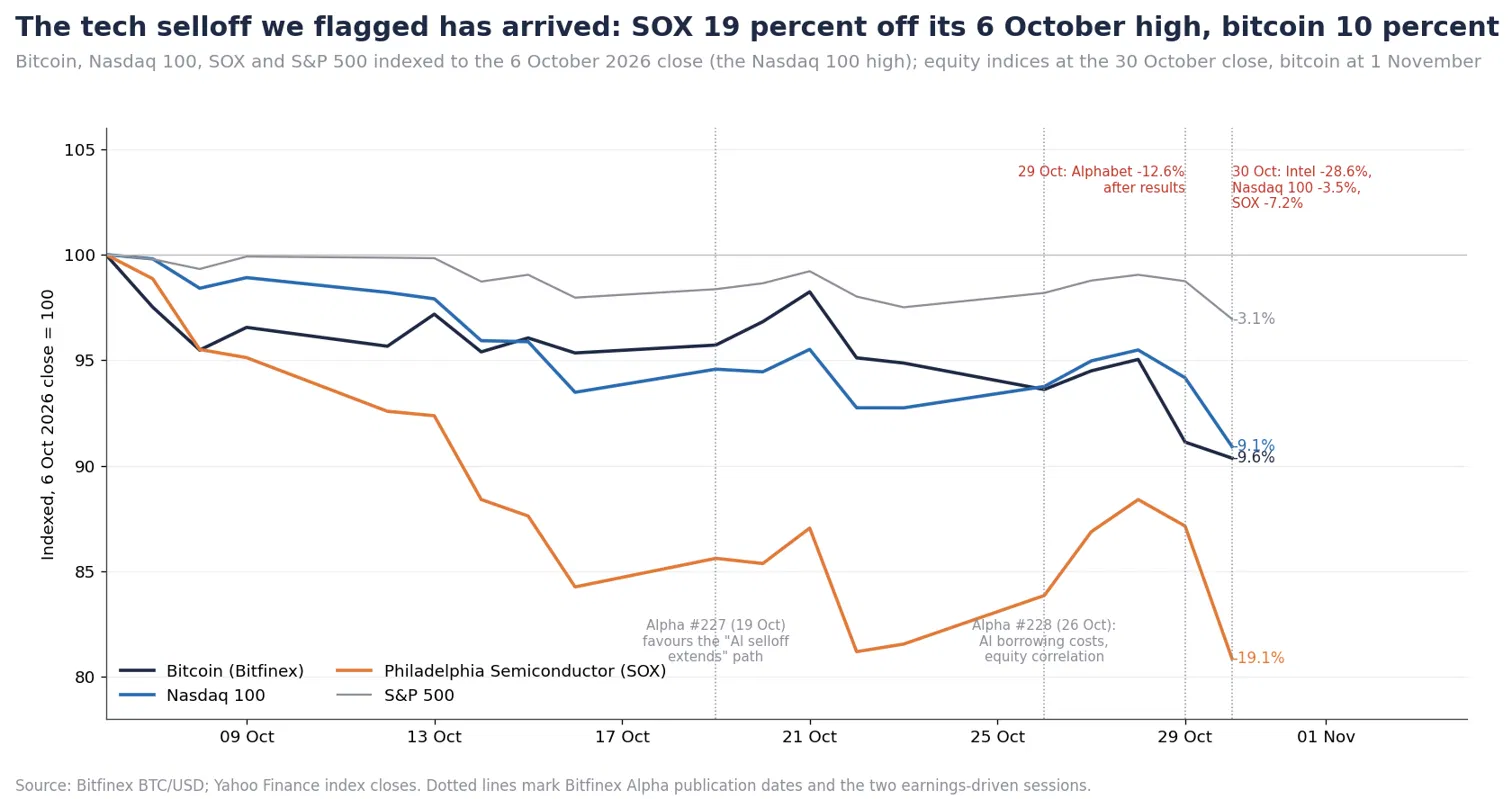
As anticipated in our 19 and 26 October editions of Bitfinex Alpha, the AI-related technology selloff intensified last week, with bitcoin following equities lower amid growing concerns about borrowing costs for AI infrastructure.
The four largest hyperscalers have raised more than $313 billion in investment-grade bonds this year, roughly three times last year’s total, but after last week’s results three of the four largest AI investors are reporting negative free cash flow, so their capital expenditure is increasingly funded by credit.
When equity investors discount a credit-funded capital cycle they cut the longest-duration growth assets first. Bitcoin appears to be trading similarly. Its 30-day correlation with the Nasdaq 100 stands at 0.68, among the highest readings since 2020, suggesting that bitcoin is currently behaving more like a technology-sensitive risk asset than a hedge.
What happens next in equities is therefore likely to set bitcoin’s range this week. The Nasdaq 100 briefly traded 10 percent below its record on 30 October and bounced from that line into the close. A stabilisation above that low through Apple’s results and the election reaction would most likely keep bitcoin inside the band, while a second leg lower in semiconductors would most likely bring the $75,772 short-term holder cost basis into play, because on-chain support between $75,000 and $77,000 is thin.

Exchange Security Concerns Hit a Market Already Weighed Down by Tech
The second catalyst was the industry’s own. Late on 29 October a security incident at Binance resulted in the theft of roughly $6.3 billion in assets, the largest in the industry’s history, with blockchain analytics firms attributing the attack to North Korea. About $3 billion was frozen by stablecoin issuers and other networks within hours. Binance pledged to cover customer losses from its own reserves before reopening withdrawals in phases from 1 November.
The market impact was concentrated in a single four-hour window in which bitcoin fell 3.5 percent, and in the liquidation and OI behaviour described earlier in our report. The incident did not change the structure of the market; it triggered the liquidation of positions that were already crowded into a market that was already weak because of US technology stocks, which is why we treat it as an accelerant rather than a cause.
The lasting effect is more likely to be on sentiment and liquidity than on price, since exchange security concerns of this scale tend to widen spreads and reduce risk appetite for several weeks.
Strong Third-Quarter Growth and a September Inflation Rebound Keep a December Rate Hike in Play
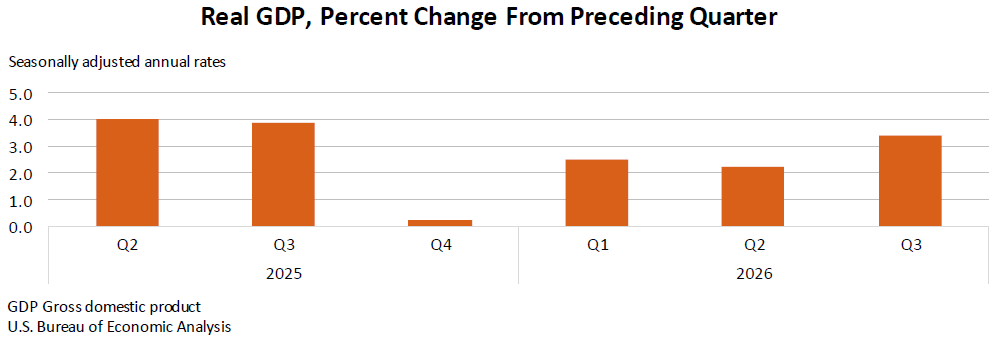
The US economy grew faster in the third quarter while inflation turned back up in September. This combination raises the pressure on the Federal Reserve to resume rate hikes at its 8-9 December meeting. The Bureau of Economic Analysis (BEA) reported on 29 October that real gross domestic product grew at an annualised rate of 3.4 percent in the third quarter, up from 2.2 percent in the second. Consumer spending grew 3.8 percent, business investment excluding housing rose 12.7 percent and equipment spending rose 20.9 percent, led by computers and related hardware. This is consistent with the build-out of artificial intelligence capacity, although that equipment serves other uses too and the BEA bases the estimate largely on import data.
Underlying private demand, measured as final sales to private domestic purchasers, grew 4.9 percent, well ahead of the 3.4 percent headline. The gap is trade. Exports fell 5.7 percent, led by petroleum products, and imports rose faster than in the second quarter. The rise in equipment demand was therefore partly met by imports rather than domestic production.
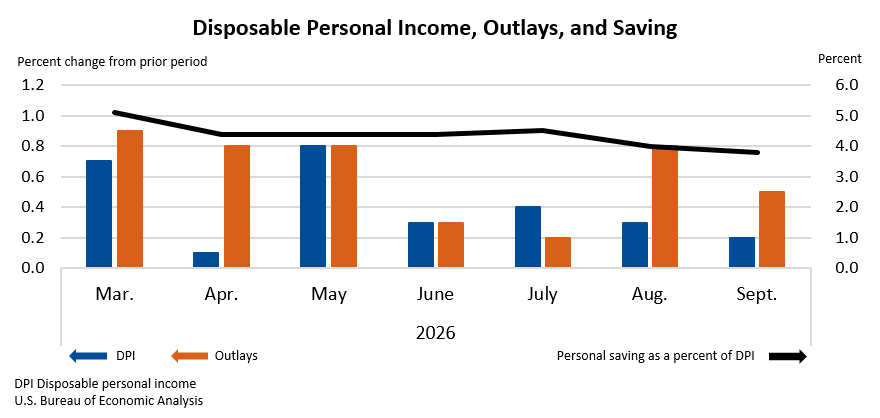

The same day’s personal income report showed the PCE price index, the Fed’s preferred inflation measure, rose 0.5 percent in September and 3.6 percent from a year earlier; the core index, which excludes food and energy, rose 0.3 percent and 3.1 percent. The 12-month figure and the quarterly figure in the GDP report tell different stories because they cover different windows. The GDP report put third-quarter PCE inflation at 2.1 percent annualised, down from 5.0 percent in the second quarter, although the quarterly figure masks an acceleration in monthly inflation. The monthly readings ran 0.1, 0.3 and 0.5 percent from July to September, and a 0.5 percent rise is roughly six percent annualised, so the quarter’s benign average hides a re-acceleration into its final month.
Households are not keeping pace. September spending rose 0.5 percent in cash terms but was flat after inflation, real disposable income fell 0.3 percent and the saving rate slipped to 3.8 percent, so spending is being funded by thinner savings. The labour market is not yet adding to the strain: the Fed’s 28 October statement said job gains have matched growth in the workforce and the unemployment rate has changed little, and the Department of Labor counted 194,000 initial jobless claims in the week to 24 October, down 1,000 from the week before. Low claims indicate few layoffs, not that hiring is strong. Housing already carries the cost of higher rates, which argues for care over the pace of hikes rather than their direction, with Freddie Mac‘s 30-year mortgage rate at 7.24 percent on 29 October against 6.17 percent a year earlier. Our assessment is that the data strengthen the case for a December rate hike, while falling real income and a housing market already under strain argue for care over the pace of any moves after it.

The Fed Held at 3.75 to 4 Percent with Two Dissents for a Hike
On 28 October, the Federal Open Market Committee voted 10-2 to hold the federal funds target range at 3.75 to 4 percent. Governor Lisa Cook and Cleveland Fed President Beth Hammack dissented in favour of an immediate quarter-point hike. The statement described economic growth as strong and inflation as elevated, but offered no explicit guidance on the future path of rates. The dissents indicate a growing hawkish wing, not a committed majority. The 8-9 December meeting comes with a new Summary of Economic Projections, the quarterly forecasts each official submits, so it will also show how many officials see hikes continuing into 2027. CME FedWatch priced a 74.9 percent probability of a quarter-point hike in December as of 2 November, up from 70.7 percent a week earlier, which would take the range to four to 4.25 percent.
Treasury yields fell nonetheless. The move began on 22 October, when the 10-year yield dropped 17 basis points in a single session, from 5.13 to 4.96 percent on the Treasury’s daily curve, and the 2-year fell 16 basis points to 4.65 percent. The same day the Nasdaq 100 fell 2.9 percent, led by the companies carrying the AI capital spending boom, and gold fell 2.9 percent, consistent with a rotation into treasuries. By 30 October the 2-year had drifted to 4.56 percent and the 10-year to 4.94 percent.
A 2-year yield at 4.56 percent, against a 4 to 4.25 percent range after a December hike, is consistent with one more hike and little after it: the market is pricing December as the end of this tightening, not the start of a new leg. The dollar did not move as yields fell: the Fed’s broad dollar index was 121.3 on both 21 and 23 October. The Chicago Fed’s National Financial Conditions Index tells the same story at minus 0.487 in the week to 23 October, still looser than average but tighter than the minus 0.518 of late September.
For bitcoin, the channel is the real yield. Bitcoin pays no coupon, so the 10-year real yield is the hurdle it has to beat, and that hurdle fell from 2.88 percent on 1 October to 2.60 percent on 30 October, close to the 2.5 percent line we treat as the cap for this cycle. Bitcoin still fell from $84,103 on 21 October to $77,621 on 30 October, about 7.7 percent, moving with the Nasdaq rather than with real yields. That suggests that the equity rotation, rather than the Fed, is the dominant influence for now.

Outlook for the Week
Base Case
Bitcoin is expected to trade within the options-implied range of $74,400 to $81,750 ahead of the 6 November expiry, with the $77,000 to $80,000 band holding and rallies into $81,300 facing selling pressure from holders of the 1.21 million BTC acquired above the current price.
Risks are skewed towards a test of the short-term holder cost basis at $75,772, as open interest has been rebuilt rather than reduced and the equity selloff has yet to reverse.
With the market pricing a 74.9 percent probability of a December rate hike and the 10-year real yield at 2.60 percent, lower real yields have so far failed to lift bitcoin. The rotation out of AI-linked equities continues to outweigh their potentially supportive effect, suggesting that bitcoin’s direction remains more sensitive to the Nasdaq and to spot demand.
What Would Confirm It
Open interest holding between 670,000 and 700,000 BTC, with funding fading towards five percent, no long liquidation event above $500 million and short-term holder SOPR recovering to 1, would support the view that positioning is stabilising.
Bitcoin failing to reclaim its 21 October close of $84,103, the last daily close before real yields fell sharply on 22 October, while the 10-year real yield remains at or below 2.6 percent and AI-linked equities continue to fall would reinforce the view that lower real yields are not translating into renewed buying demand.
What Would Invalidate It
A daily close below $77,000, accompanied by ETF outflows exceeding $300 million and supply in profit below 58 percent, would suggest that support has failed, exposing the short-term holder cost basis at $75,772 and potentially the $70,000 to $75,000 range.
A stronger-than-expected US employment report on 6 November that pushes the 10-year real yield back above 2.8 percent, accompanied by a further decline in bitcoin, would suggest that monetary policy expectations have again become the dominant influence rather than the rotation out of technology equities.
Conversely, a daily close above $80,000 accompanied by ETF inflows exceeding $300 million and funding below five percent would challenge the base case.
A recovery above $81,300 while real yields continue to decline and technology equities remain weak would likewise suggest that falling real yields are beginning to support bitcoin independently of the broader equity market.
What to Watch
The immediate question is whether bitcoin can defend its support band as technology equities remain under pressure, and whether spot demand and derivatives positioning show signs of stabilisation. Three indicators will be particularly important:
Technology equities: The Nasdaq relative to its 30 October low.
ETF Flows: The 2 and 3 November readings, particularly any daily inflows or outflows exceeding $300 million
Open interest and funding: Daily readings at 00:00 UTC, particularly whether open interest remains between 670,000 and 700,000 and funding moderates.
Secondary catalysts to monitor include:
US employment report: Due on Friday, 6 November.
October CPI: Due on Tuesday, 10 November.
CME FedWatch: December rate-hike probabilities relative to the 74.9 percent reading on 2 November and the 90 percent challenge line.
Real yields: The 10-year real yield relative to 2.5 percent.
Chicago Fed National Financial Conditions Index: Wednesday, 4 November, following the reading of -0.487 for the week ending 23 October.
On-chain indicators: Supply in profit relative to the 58 percent threshold, alongside long-term holder SOPR.
Options Expiry: The 6 November expiry, with call concentrations at $82,000 and $85,000 and puts at $74,000 to $76,000
