

Issue #226:
Bitcoin Needs $84,400 to Bring ETFs Back
Bitcoin Needs $84,400 to Bring ETFs Back
Bitcoin has struggled to establish a sustained recovery above the key support level of $81,300 over the past week, repeatedly falling below that level before recovering by the daily close. Upside momentum has stalled as positioning, institutional ETF flows and weakness in technology equities converge to increase downside pressure.
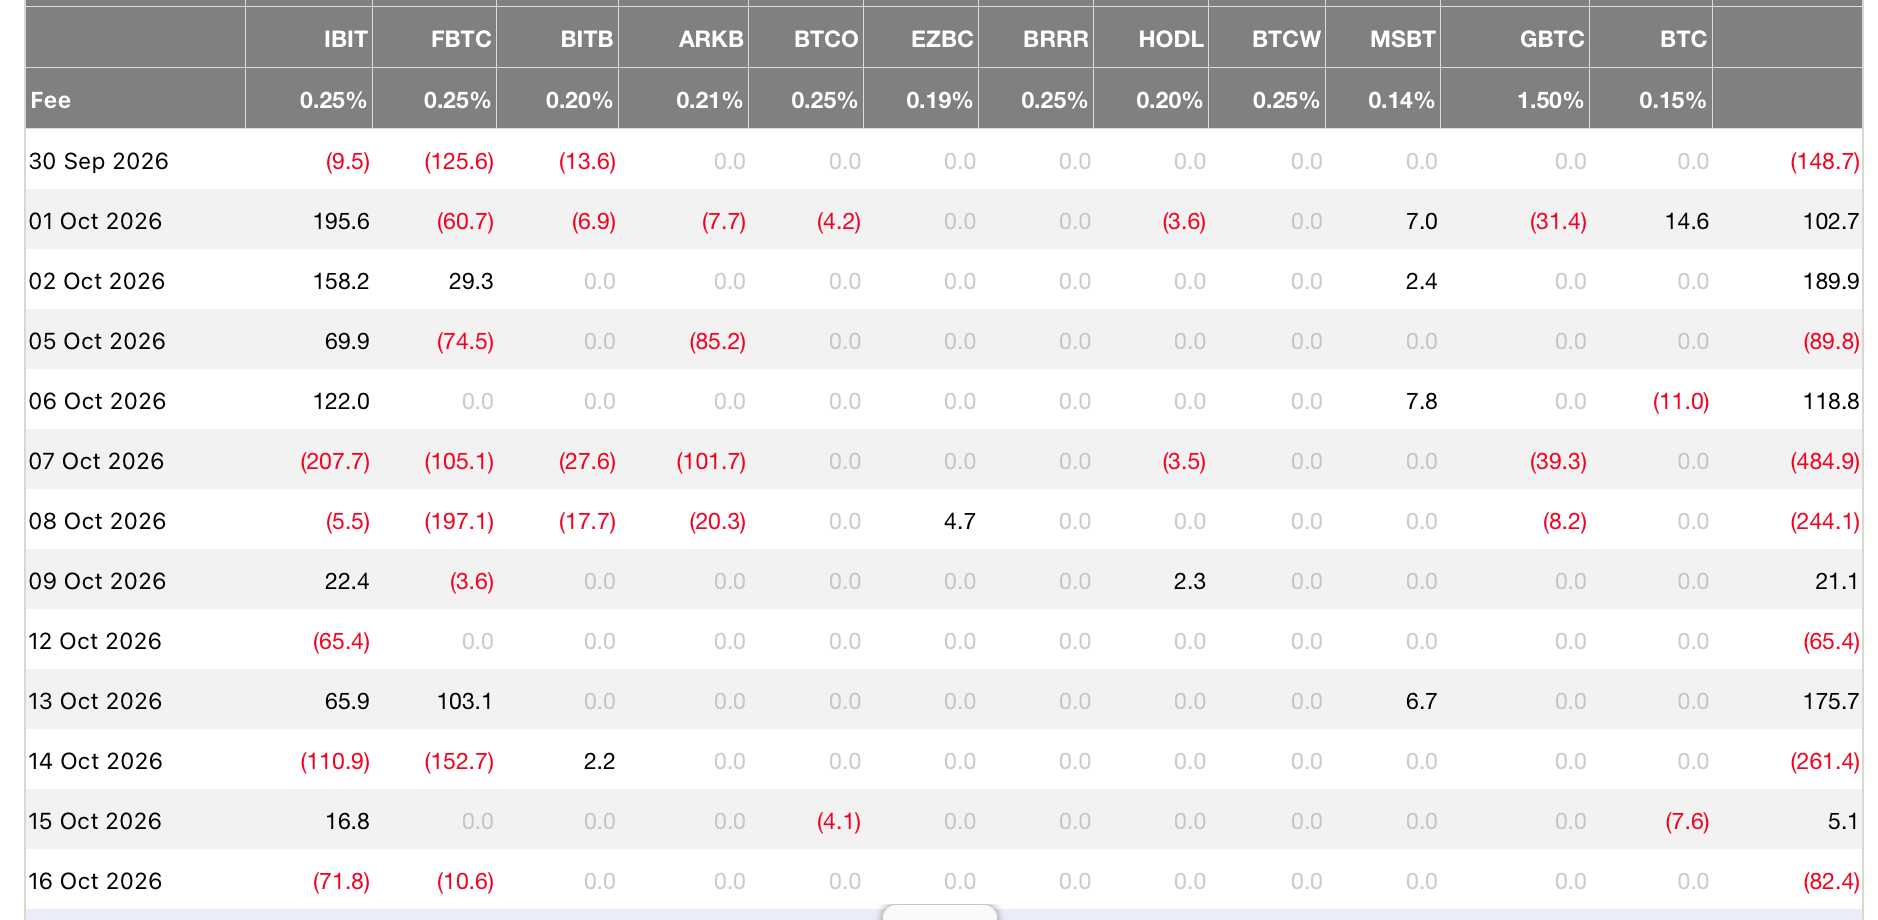
US spot Bitcoin ETFs registered a second straight week of net outflows totaling $228 million in the week ending 16 October, as the average ETF holder remains underwater relative to their estimated $84,358 cost basis. While on-chain accumulation has helped absorb selling pressure near $81,000, renewed leverage positioning leaves bitcoin vulnerable to further liquidations. Aggregate futures open interest (OI) rebounded 4.3 percent between 12 and 15 October, even as bitcoin prices declined.
The key macro question this week is whether the fall in Treasury yields will help bitcoin or whether it reflects a wider drop in risk appetite. September’s consumer price inflation data remained hot, with producer prices also rising 1.3 percent, the most since March 2022. The market is now anticipating another Federal Reserve rate increase in December.
That all being said, the 10-year Treasury Inflation-Protected Securities (TIPS) yield, the inflation-adjusted return BTC competes with, fell from 2.91 percent to 2.74 percent in the week to 16 October. We believe this likely reflects an investor shift away from AI-linked equities into Treasuries, however, rather than easing inflationary pressures. Lower yields may therefore do little to help BTC if investors continue to retreat from riskier assets.
Our near-term outlook remains cautious, with continued consolidation and downside risk if weakness in US equities persists. The observation that would change that view is if BTC continues to rise while real yields remain below 2.8 percent alongside stabilising equities.

Market Signals
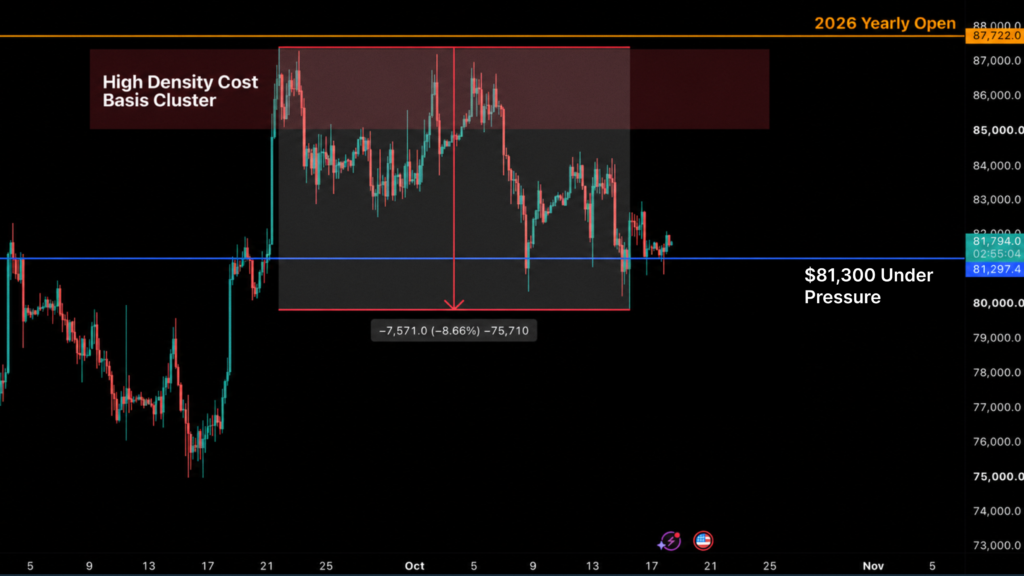
The $81,300 Retest: Former Range High Held as Support
We expect $81,300 to act as the centre of the weekly range rather than its floor this week, as cost-basis distribution rebalances and high-volume nodes move towards higher prices.
Between 15 and 18 October, bitcoin traded below $81,300 on four consecutive days, reaching lows of $79,821, $80,817, $80,820 and $80,700, before closing above it each time. Under the criteria established in our 7 October Intelligence Update, this does not yet constitute a sustained breakdown. A support level that is repeatedly breached and defended only at the close, however, is no longer functioning as reliable support.
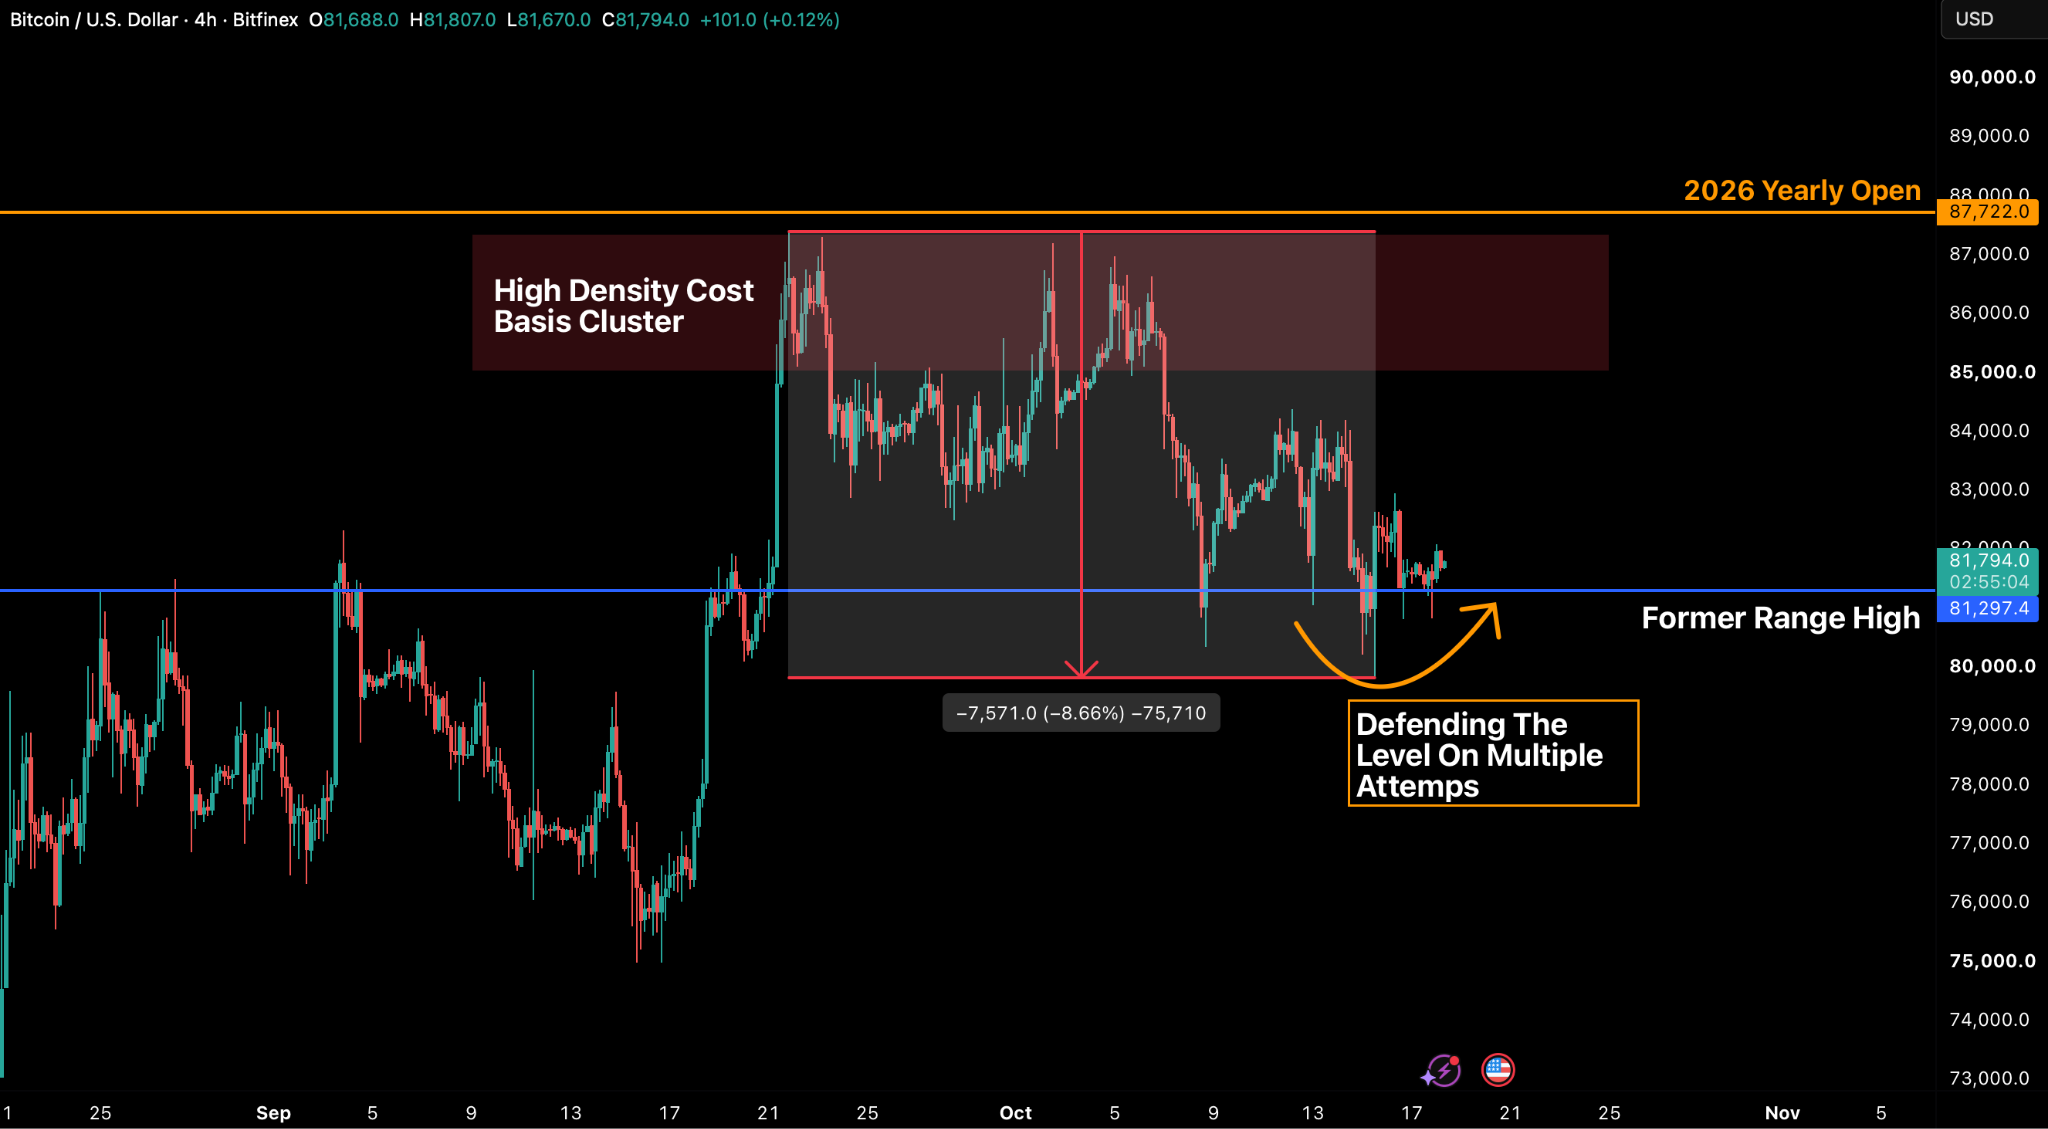
Subsequent rebounds have met selling pressure at progressively lower peaks, declining from $84,378 on October 12 to $82,300 by October 18. This diminishing bounce amplitude signals weakening momentum, compounded by two consecutive weeks of lower highs and lower lows. Heading into the October 27–28 FOMC meeting, the market therefore faces either continued range-bound consolidation or a downward resolution, heavily dependent on broader US equity market stability.
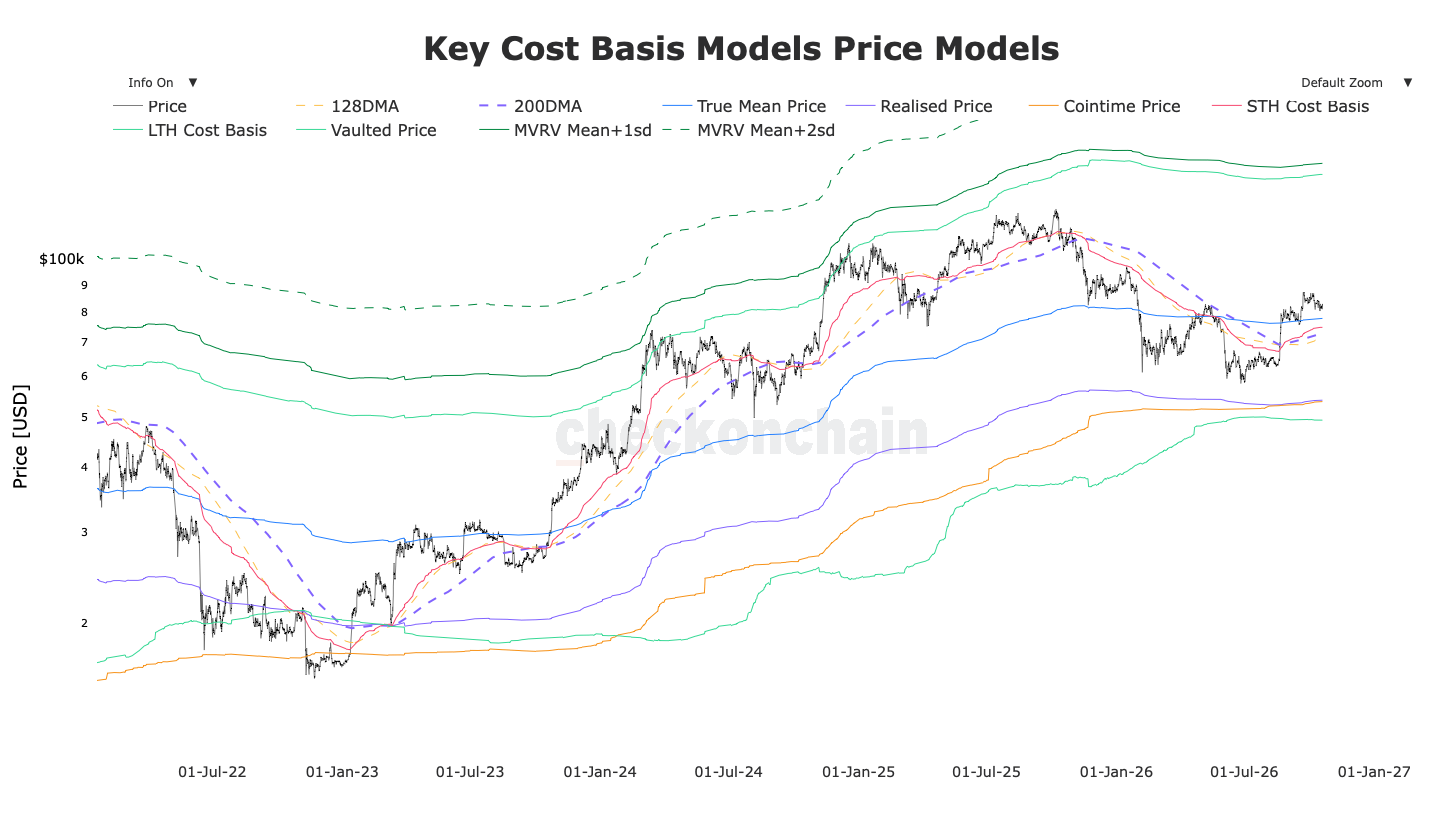
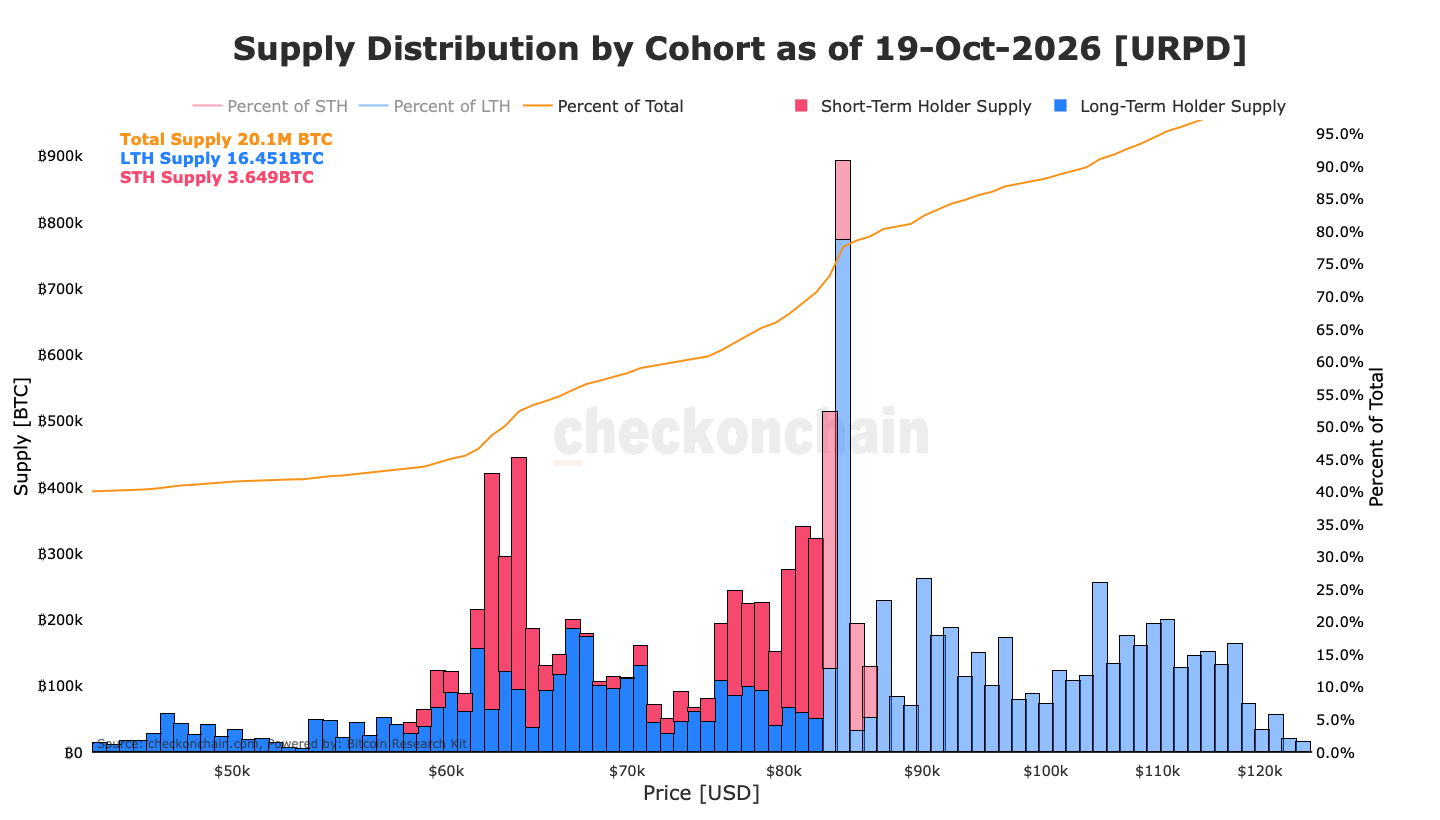
Downside risk currently centers on key cost-basis clusters. The $77,600 to $80,400 zone represents a major accumulation band containing approximately 910,000 BTC acquired during September. Directly beneath this band sits the True Market Mean at $77,500, representing the aggregate cost basis of active market participants. A decisive breakdown below $77,500 would expose the $76,000 former range lows and the Short-Term Holder Cost Basis at $74,484, at which point short-term investors as a group enter unrealised losses.

Leverage is Holding Price Up, Which Is a Risk
Bitcoin-notional futures open interest (OI) fell over 12 percent from its highs in September, reaching 619,645 BTC across 22 exchanges on 12 October, its lowest level of 2026. It has since rebounded however, rising 4.3 percent to 646,442 BTC by 15 October, as bitcoin fell to $79,821. The subsequent recovery towards $83,000 has also been accompanied by an OI rebound and a return to positive funding rates.
This shows a market where aggregate positioning is increasingly chasing price movements, with shorts entering on declines and leveraged longs returning during rebounds. Such activity does not represent the sustained, spot-led demand needed for a healthy recovery.
Recent liquidation events illustrate the risk. Short positions were squeezed last week when BTC rose, and were subsequently replaced by leveraged longs paying annualised funding rates of six to nine percent, recreating conditions similar to those preceding both October flushes. The latest liquidation wiped out $948 million in the 24 hours leading to 15 October, with longs accounting for 90.6 percent of the total. A further $359 million was liquidated over the weekend, again mostly from long positions.
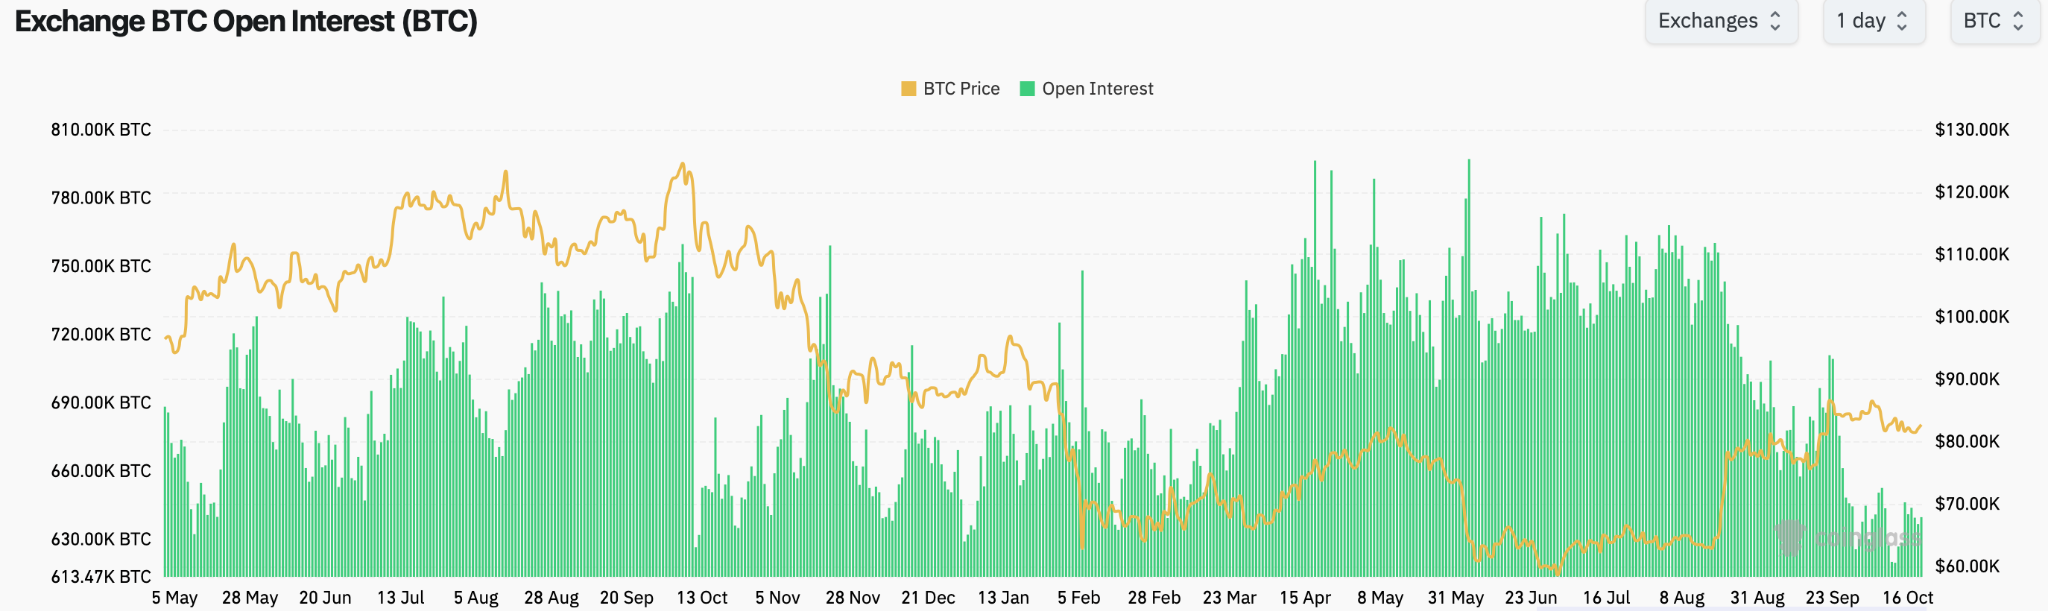
OI that has not fallen with price means the fuel for a third flush remains in place — and the trigger will likely be any move below $79,821, forcing further long liquidations and accelerating the decline into the $77,600 to $80,400 accumulation band.
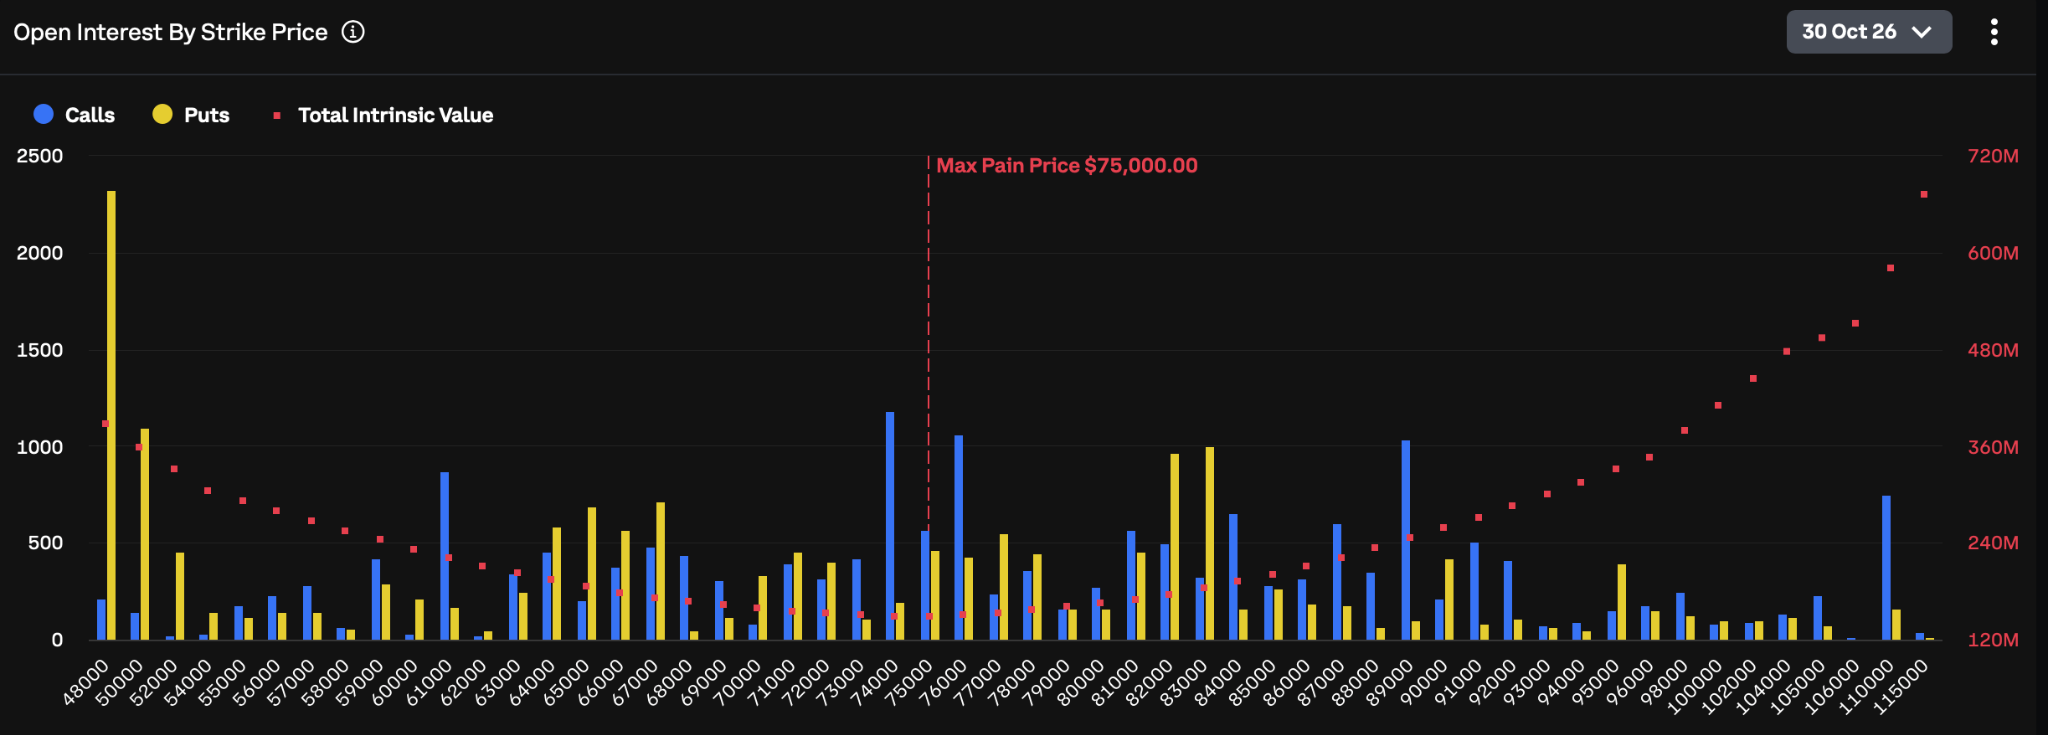
Options markets similarly reflect defensive hedging. The October 30 expiry carries $12.4 billion in notional OI with a max pain level of $79,000 and heavy put demand between $70,000 and $75,000. A 25-delta risk reversal of -3.7 indicates that traders are paying a premium for downside put protection relative to upside call

On-Chain Holder Absorption vs. Capitulation Signals
While leveraged positioning increases downside risk, on-chain data suggests buyers are continuing to absorb supply around current prices.
Supply in the $80,353 to $82,224 cost-basis bins expanded by 366,000 BTC between October 11 and October 18, reaching 646,000 BTC, while overhead resistance between $82,224 and $86,099 decreased to 1.09 million BTC. Total supply held between $77,600 and $82,200 now stands at 1.25 million BTC, indicating significant absorption of selling pressure by spot buyers during recent dips.
Profitability metrics indicate an orderly consolidation rather than a rush to sell. The percentage of supply in profit currently sits between 67 percent and 70 percent, slightly below the historical mean of 74.7 percent.
Meanwhile, the Short-Term Holder Spent Output Profit Ratio (SOPR) is hovering near 1.0 (0.999), indicating that recent investors are selling near break-even. While 36 percent of short-term holder supply, equivalent to 1.32 million BTC, sits at an unrealised loss, a persistent dip in STH-SOPR below 0.98 would be required to signal a true capitulation phase.
New whale entities, defined as those large holders of coins for fewer than 155 days, now account for 33 percent of total whale realised cap, up from 18 percent at the start of 2026, with an average cost basis near $77,000. While this expansion reflects early structural recovery, overall net 30-day apparent demand remains slightly negative at approximately -50,000 BTC, indicating that estimated demand has fallen short of available supply over the past month.
A sustained increase in net demand back into positive territory remains a crucial confirmation signal for renewed bullish continuation.

Institutional ETF Outflows and Altcoin Volatility
US spot bitcoin ETFs recorded a second consecutive week of net outflows totaling $228.4 million in the week ending 16 October. With the average ETF cohort cost basis at $84,358, the average institutional participant is currently 2.6 percent under water. Historically, ETF inflows slow significantly when prices trade below cohort cost basis, suggesting institutional buying is unlikely to provide a strong tailwind until spot reclaims $84,400.
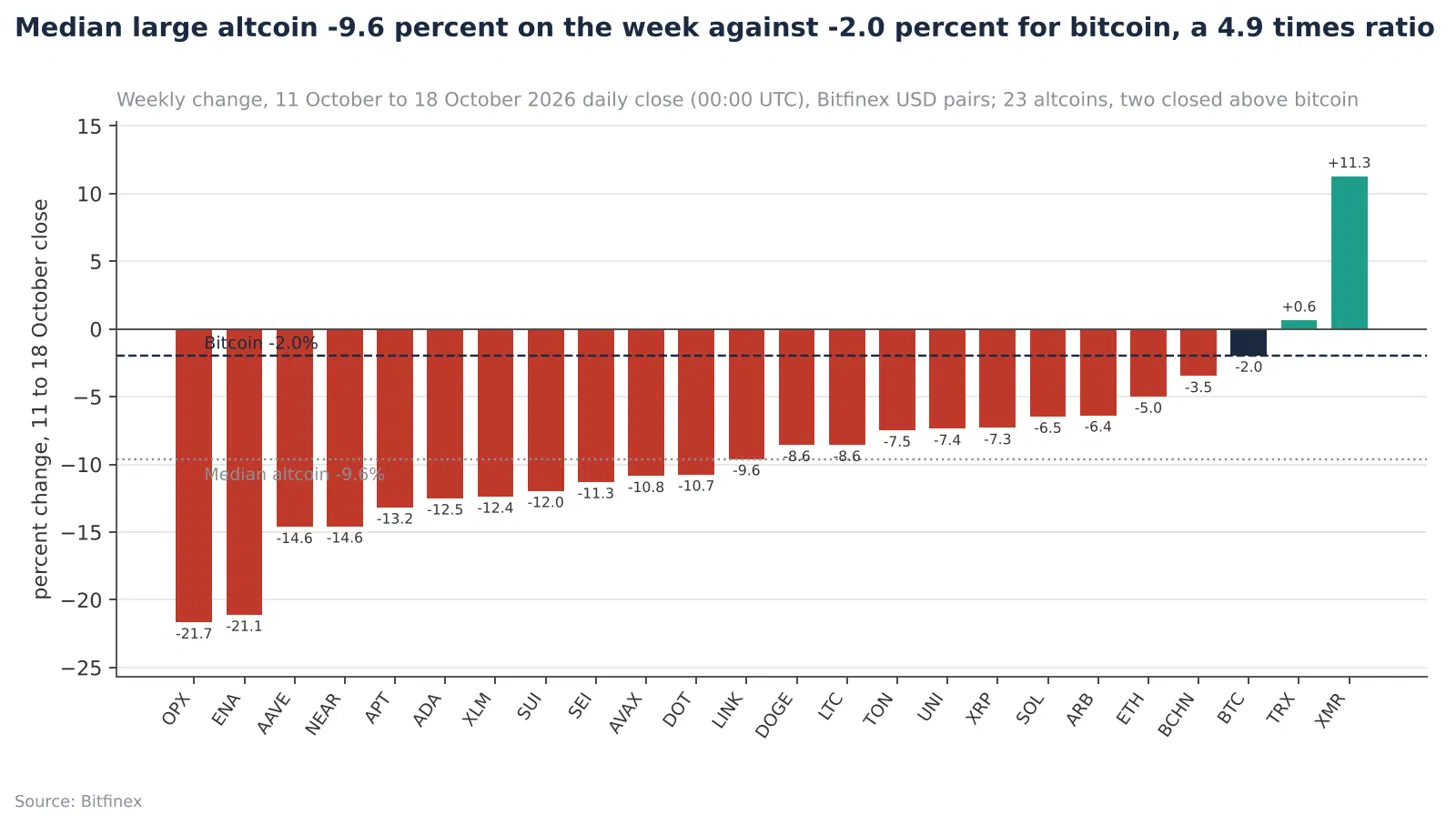
Altcoins continue to exhibit heightened downside beta relative to bitcoin. Across 22 major altcoins tracked on Bitfinex, the median weekly decline was 9.6 percent compared to bitcoin’s 2.4 percent drop — a downside sensitivity of nearly 4.0x. Ether (ETH) dropped 5.0 percent while ETH/BTC weakened further to 0.0293.

Catalysts and Risks
Fuel Is Inflating Retail Sales While Real Demand Stalls
Fuel is doing two things at once: inflating September’s retail sales and squeezing underlying consumer spending, a combination that keeps the Fed leaning towards one further rate hike.
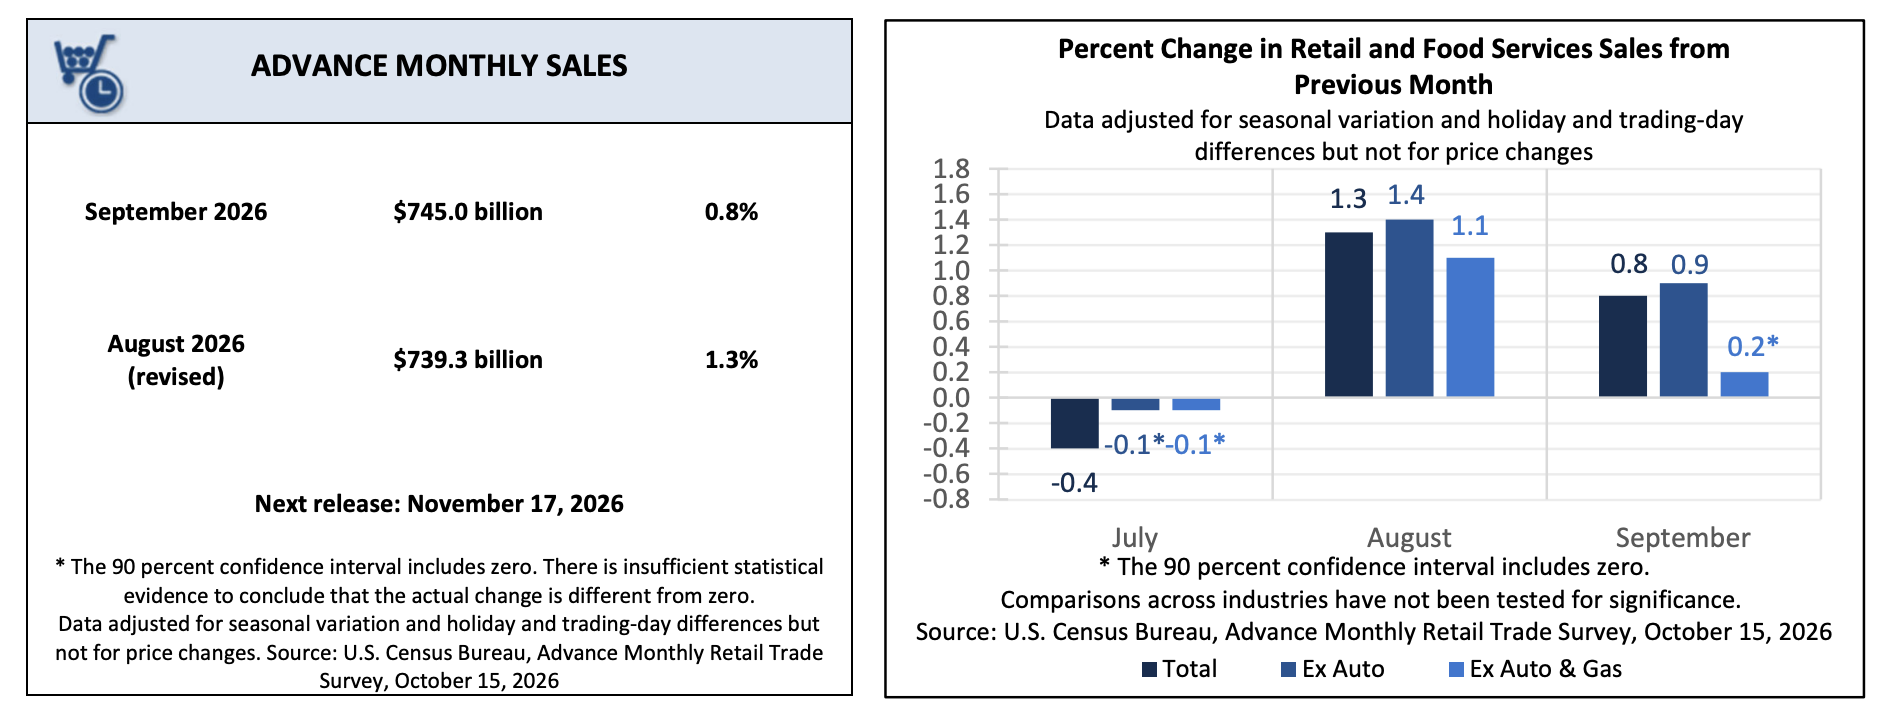
US retail and food services sales rose 0.8 percent in September after an upwardly revised 1.3 percent in August. Petrol station receipts rose 6.4 percent; all other retail sales rose 0.2 percent. The control group, which excludes vehicles, fuel, building materials and restaurants and feeds into the consumer spending estimate in GDP, rose 0.1 percent after 1.2 percent in August. These are dollar figures, not quantities. With consumer prices up 0.6 percent in September and control-group sales up only 0.1 percent, households paid more and took home less.
Price pressure is also broadening beyond oil. The producer price index rose 1.3 percent in September, the largest increase since March 2022. Energy explains most of it, up 10.8 percent, with transport and warehousing services up 3.4 percent as fuel costs reached freight rates. Excluding food, energy and trade services, producer prices however, still rose 0.5 percent on the month and 5.0 percent on the year.
The data reinforces expectations of another Fed rate hike later this year, although not immediately. New York Fed President John Williams said on 29 September that “one further upward adjustment of the federal funds target range may be appropriate late this year” and that “there is no need for urgency”. As of 17 October, CME FedWatch priced an 84.5 percent probability of no change when the Fed meets on 28 October.
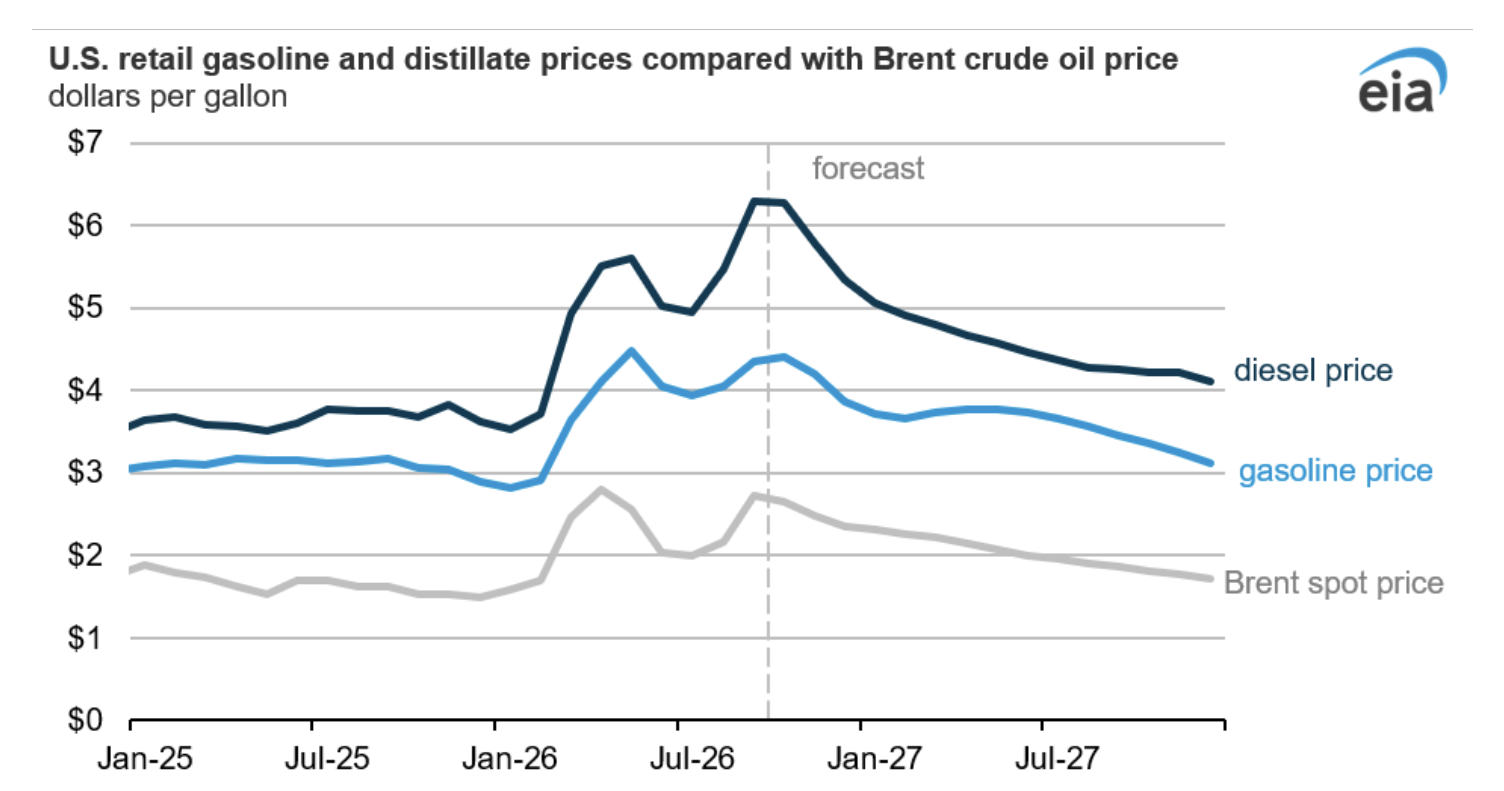
The shortage of refined fuel could keep diesel and heating oil prices elevated even if cruise oil prices fall. Retail diesel prices were up 68.6 percent on the year, as of 12 October, against 41.5 percent for petrol, while distillate stocks had fallen to 102.6 million barrels from 107.4 million three weeks earlier. The Energy Information Administration (EIA)’s October Short-Term Energy Outlook assumes Middle East oil flows will remain constrained through the fourth quarter and projects heating oil prices more than 30 percent above last winter.
This is inflation that monetary policy cannot directly address: higher interest rates can restrain spending, but cannot restart a refinery or reopen a shipping lane. The Fed’s tightening bias could therefore persist even as rising fuel bills weaken consumer demand.
For crypto, the transmission runs through the front end of the yield curve: expectations of a December rate hike keep two-year Treasury yields near 4.75 percent, limiting the prospects of easier liquidity conditions. The outlook could change if third-quarter GDP on 29 October comes in below 3 percent, which would move the debate from one more hike to none.

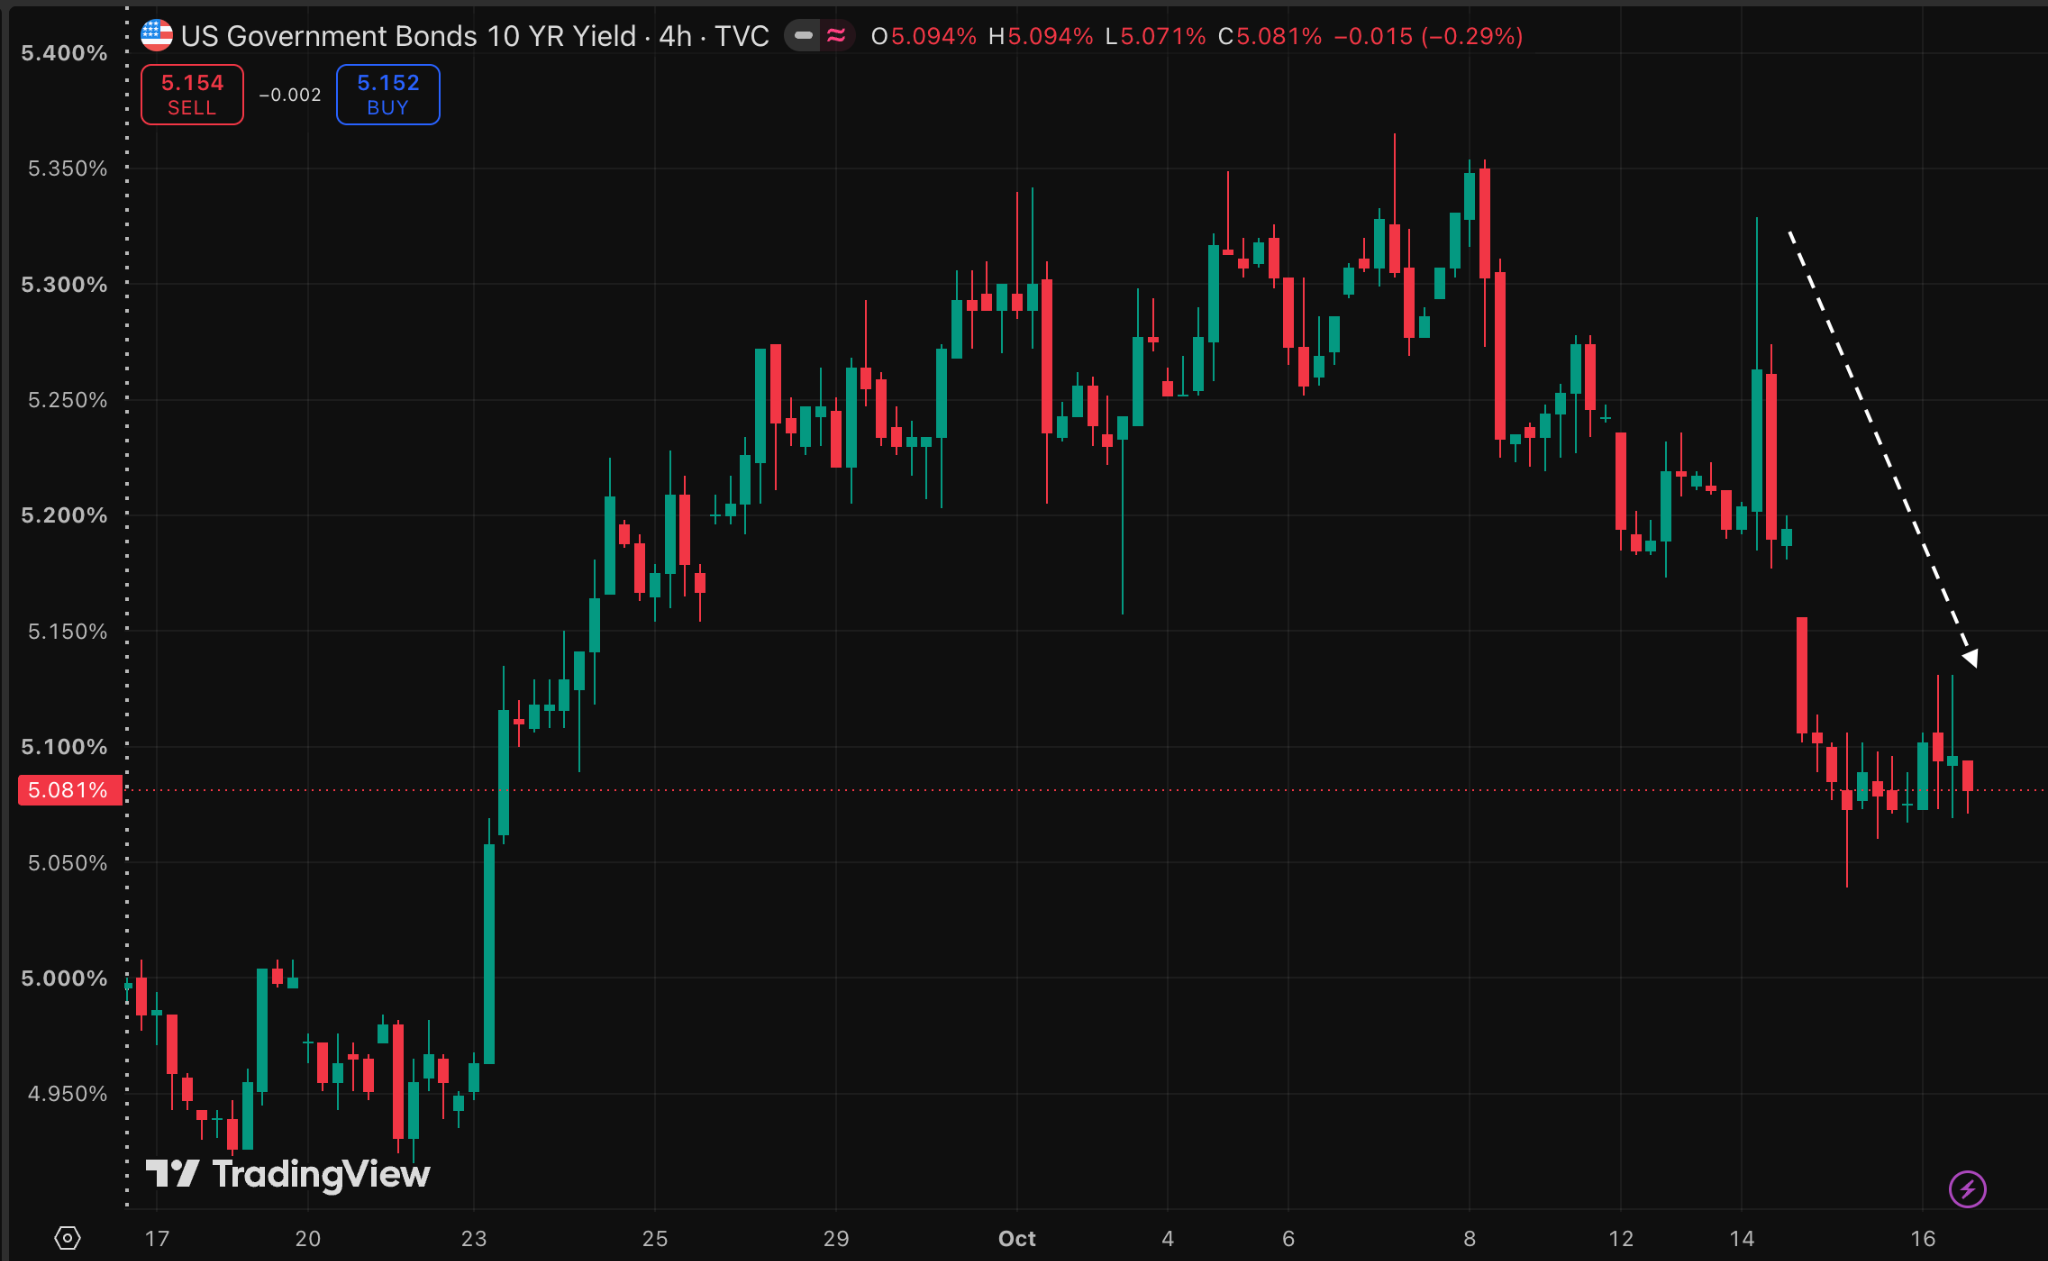
Lower Treasury Yields Are Not Yet a Tailwind for Bitcoin
Bitcoin’s hurdle rate fell this week, but potentially for the wrong reason.
The 10-year Treasury Inflation-Protected Securities (TIPS) yield, a measure of inflation-adjusted bond returns and the hurdle bitcoin has to beat, closed at 2.74 percent on 16 October, down from 2.91 percent a week earlier, even as inflation data remained elevated.
The move may reflect money leaving AI-linked equities for Treasuries as scrutiny of AI capital spending deepened; the Nasdaq Composite fell four percent on the week ending 16 October. A lower hurdle that arrives with falling risk appetite does not help an asset that trades with risk appetite.
The next test comes this Wednesday 21 October, when Meta, Tesla, IBM and Lam Research report after the close. Guidance that steadies AI equities would pull money back out of Treasuries and lift the TIPS yield. Guidance that deepens the selloff would lower it further, while taking risk appetite with it.
The headwind will turn into support only if the TIPS yield keeps falling while equities stabilise and it will intensify if the yield moves back above three percent.

Outlook for the Week
Base Case
Bitcoin enters the week with weakening momentum, renewed leveraged positioning and continued institutional ETF outflows, leaving the market vulnerable to further declines if broader risk appetite deteriorates.
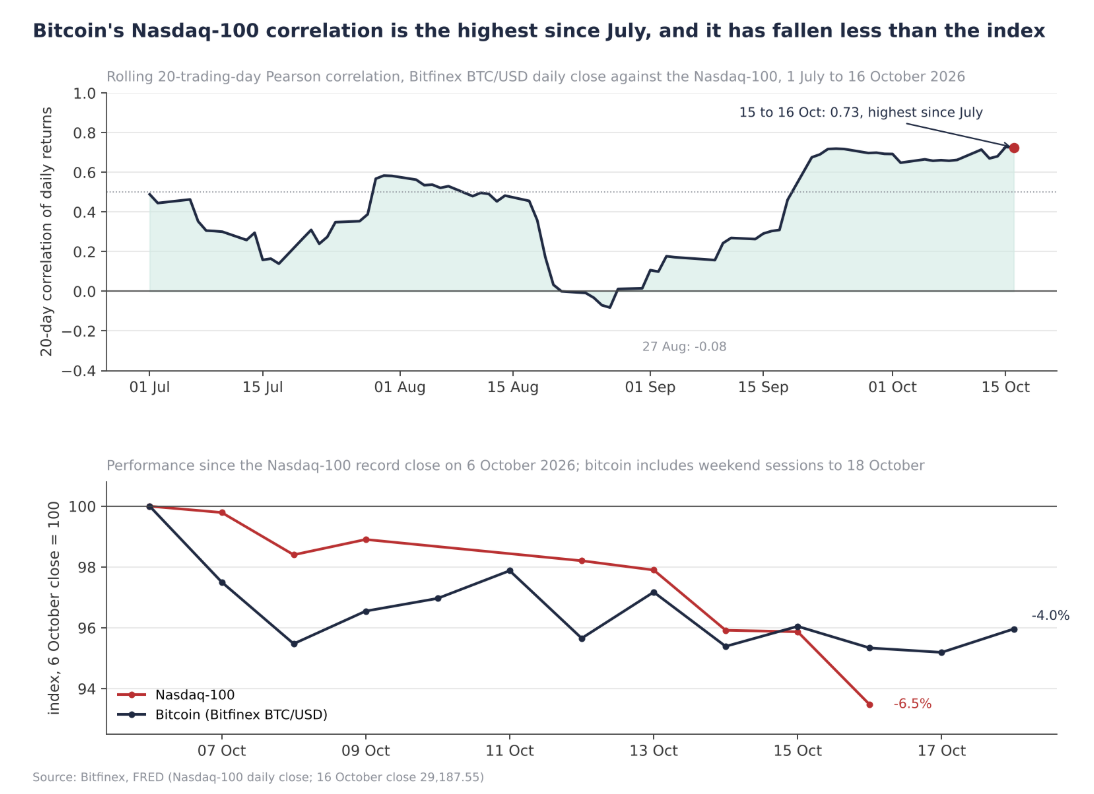
We expect $81,300 to act as the centre of the weekly range rather than its floor, and the bearish path is the more likely of the two. Bitcoin has lagged the fall in AI-linked equities, and with a 0.78 twenty-day correlation to the Nasdaq-100, a further leg down in technology shares would take price through $79,821 into the $77,600 to $80,400 accumulation band before the 28 October FOMC decision.
Macro offers no offset: the TIPS yield fell last week because risk appetite fell, not because inflation eased. Any move higher would therefore have to be paid for by spot buying not currently being provided by ETF flows and leveraged positioning. With Fed officials in their quiet period until 29 October, the one macro input that can change this before the decision is oil.

What Would Confirm It
A daily BTC close below $79,821, accompanied by renewed long liquidations and elevated futures OI, would strengthen the bearish case.
Continued ETF outflows, negative apparent demand and weak spot buying would provide further evidence that underlying demand remains insufficient to sustain a recovery.
On the macro side, persistent weak US equities, even as the 10-year TIPS yield remains at or below 2.8 percent, would reinforce the view that lower yields are not translating into stronger risk appetite.

What Would Invalidate It
A turnaround in US equities and Asian semiconductor shares, which would hold bitcoin between $81,300 and $83,000 and defer the test to FOMC week, would strengthen the bearish case.
A reclaim of $84,400, which puts the average ETF holder back in profit, or net 30-day apparent demand turning positive, would signal strengthening market conditions.
On the macro side, BTC rising alongside a further fall in the TIPS yield to 2.5 percent while equities stabilise would suggest lower yields are feeding through to crypto after all.
Conversely, downside risks could intensify if a Middle East oil shock or a sharp AI equity rebound that pulls money out of Treasuries pushes the TIPS yield back above 3 percent or brings expectations of another Fed rate hike forward to 28 October, with a 15.5 percent probability of that as of 17 October. A close below $77,500, the True Market Mean, would expose $76,000 and the $74,484 short-term holder cost basis.

What to Watch
US equities, particularly the AI sector. Meta, Tesla and IBM report earnings after the close on Wednesday 21 October, with Netflix on Tuesday. Capital spending guidance could influence whether investors remain in Treasuries or return to equities, with implications for bitcoin’s direction.
Spot bitcoin ETF flows, monitored daily, and whether price reclaims $84,400.
Futures open interest and funding, to assess whether leveraged position continues to support prices, alongside the 30 October options expiry, with max pain at $79,000.
US economic and energy data: EIA diesel price and housing starts on Tuesday 20 October; the petroleum status report on Wednesday 21 October and initial jobless claims on Thursday 22 October.
The TIPS yield against the S&P 500, monitored daily to determine whether falling yields signal improved financial conditions or continued risk aversion.
