

Issue #225:
Bitcoin Waits for a Tailwind
Futures Can't Carry Bitcoin's Breakout Alone
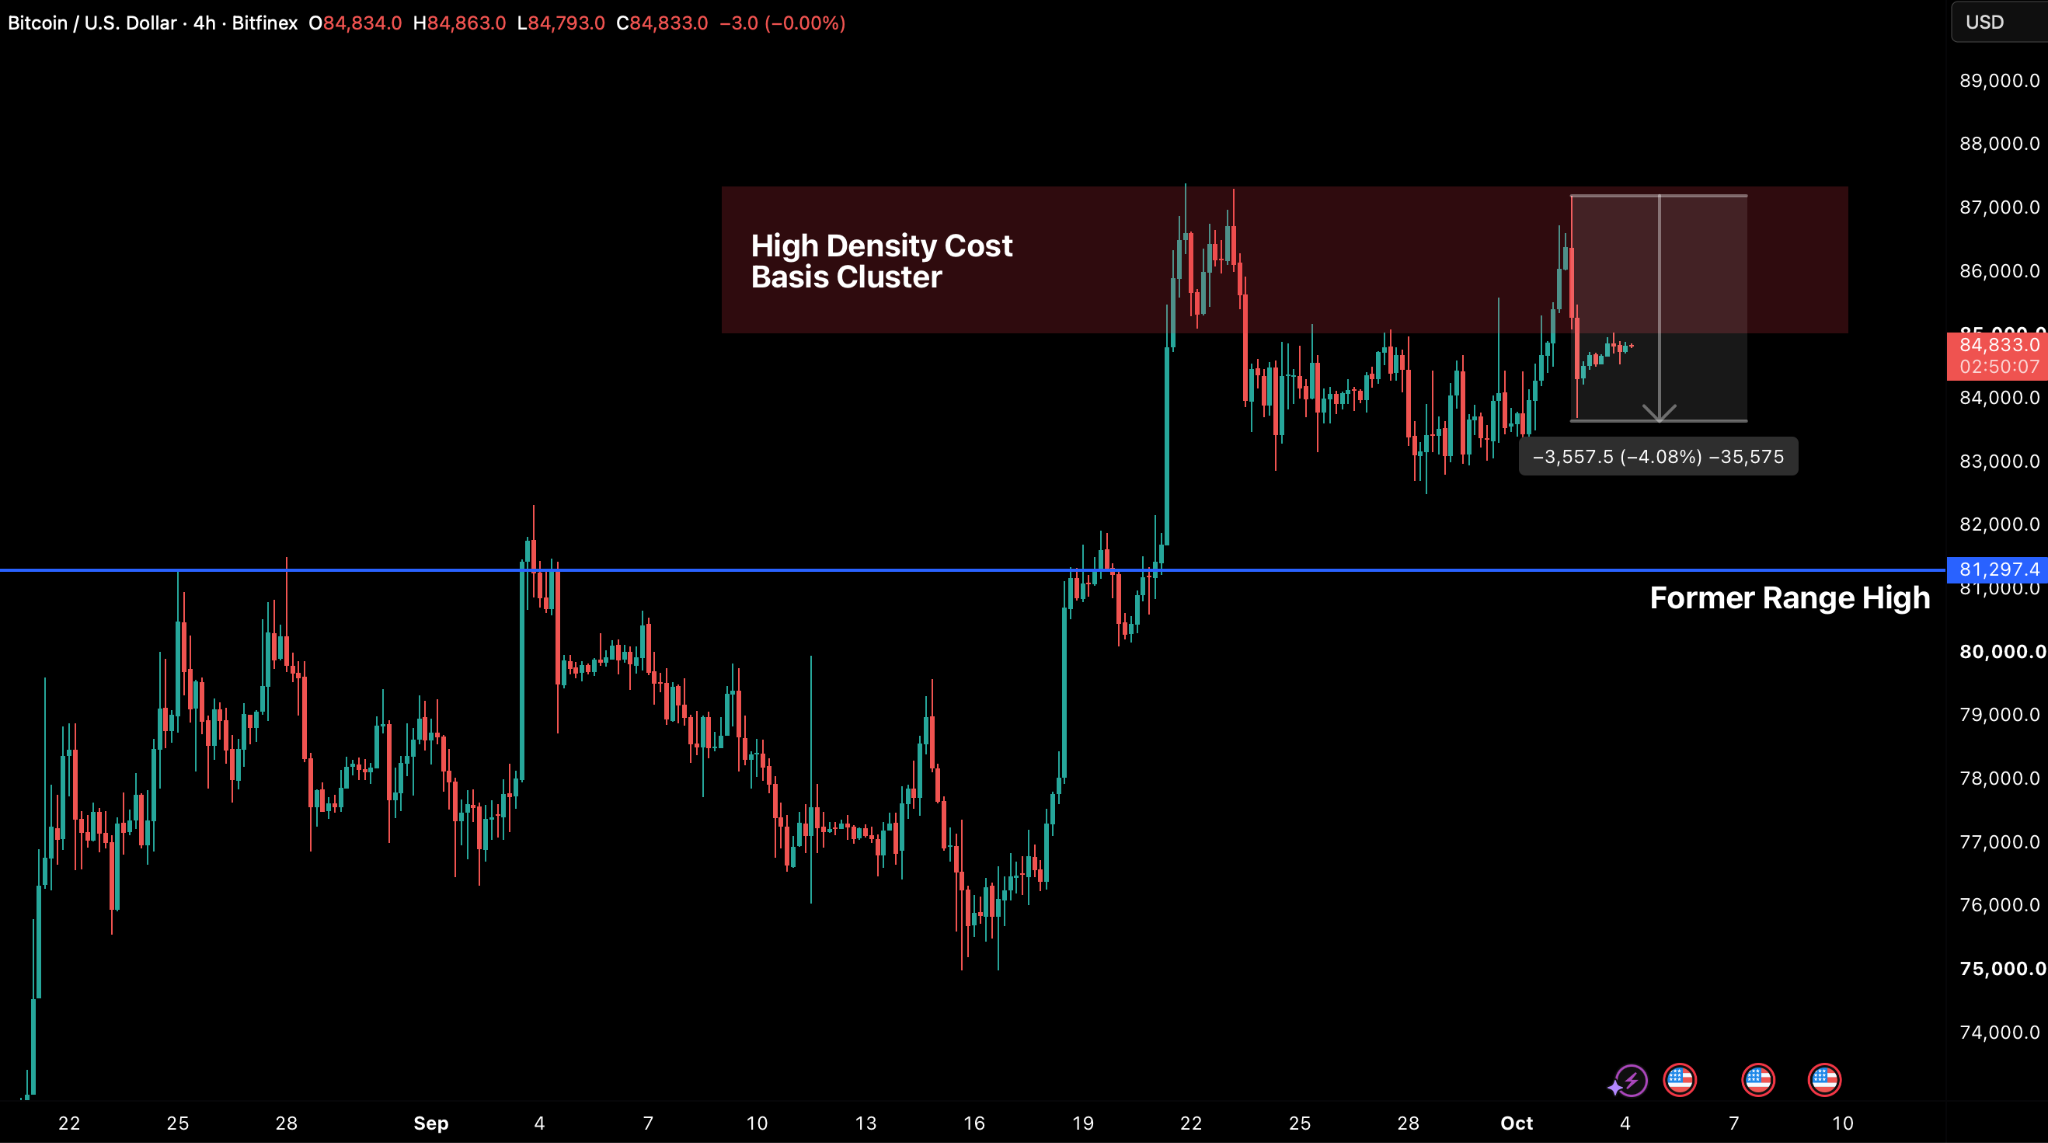
Bitcoin attempted a breakout last week, reaching a high of $87,197 on 2 October before retreating to around $84,000 by the end of the session, its third rejection below the $87,722 yearly open in two weeks. The move was driven mainly by futures positioning rather than spot demand. Open interest grew by $2.1 billion in the 24 hours ahead of last Friday’s September payrolls report and then fell by $1.5 billion as the report was released, with shorts and then longs liquidated in turn. Without sufficient spot follow-through, the move could not hold.
Spot demand remains the missing piece in the current market structure. US spot bitcoin ETFs took in $241.1 million in the week of 28 September to 2 October, against $2.39 billion the week before. The average ETF investor is back at breakeven for the first time since January — a level at which inflows have historically been slow. The supply side is healthier: long-term holder selling has eased, profit-taking is small compared with earlier highs and little supply sits between the yearly open and $90,000.
The macro backdrop removed a headwind without adding a tailwind. Lower-than-expected September payrolls of 29,000 have reduced the chance of an October rate hike, but core PCE inflation at 3 percent and firm consumer spending keep an increase this December in play.
Our base case is consolidation above $84,000, the largest cost-basis cluster and the level at which 75 percent of supply is in profit. A resolution to the upside will depend on ETF flows returning towards the levels seen in late September. Sustained trading below $81,300 on ETF outflows would change that view and bring the $77,000 region and the True Market Mean of $77,200 back into play.

Market Signals
Bitcoin Continues to Wait for Spot Buyer Aggression
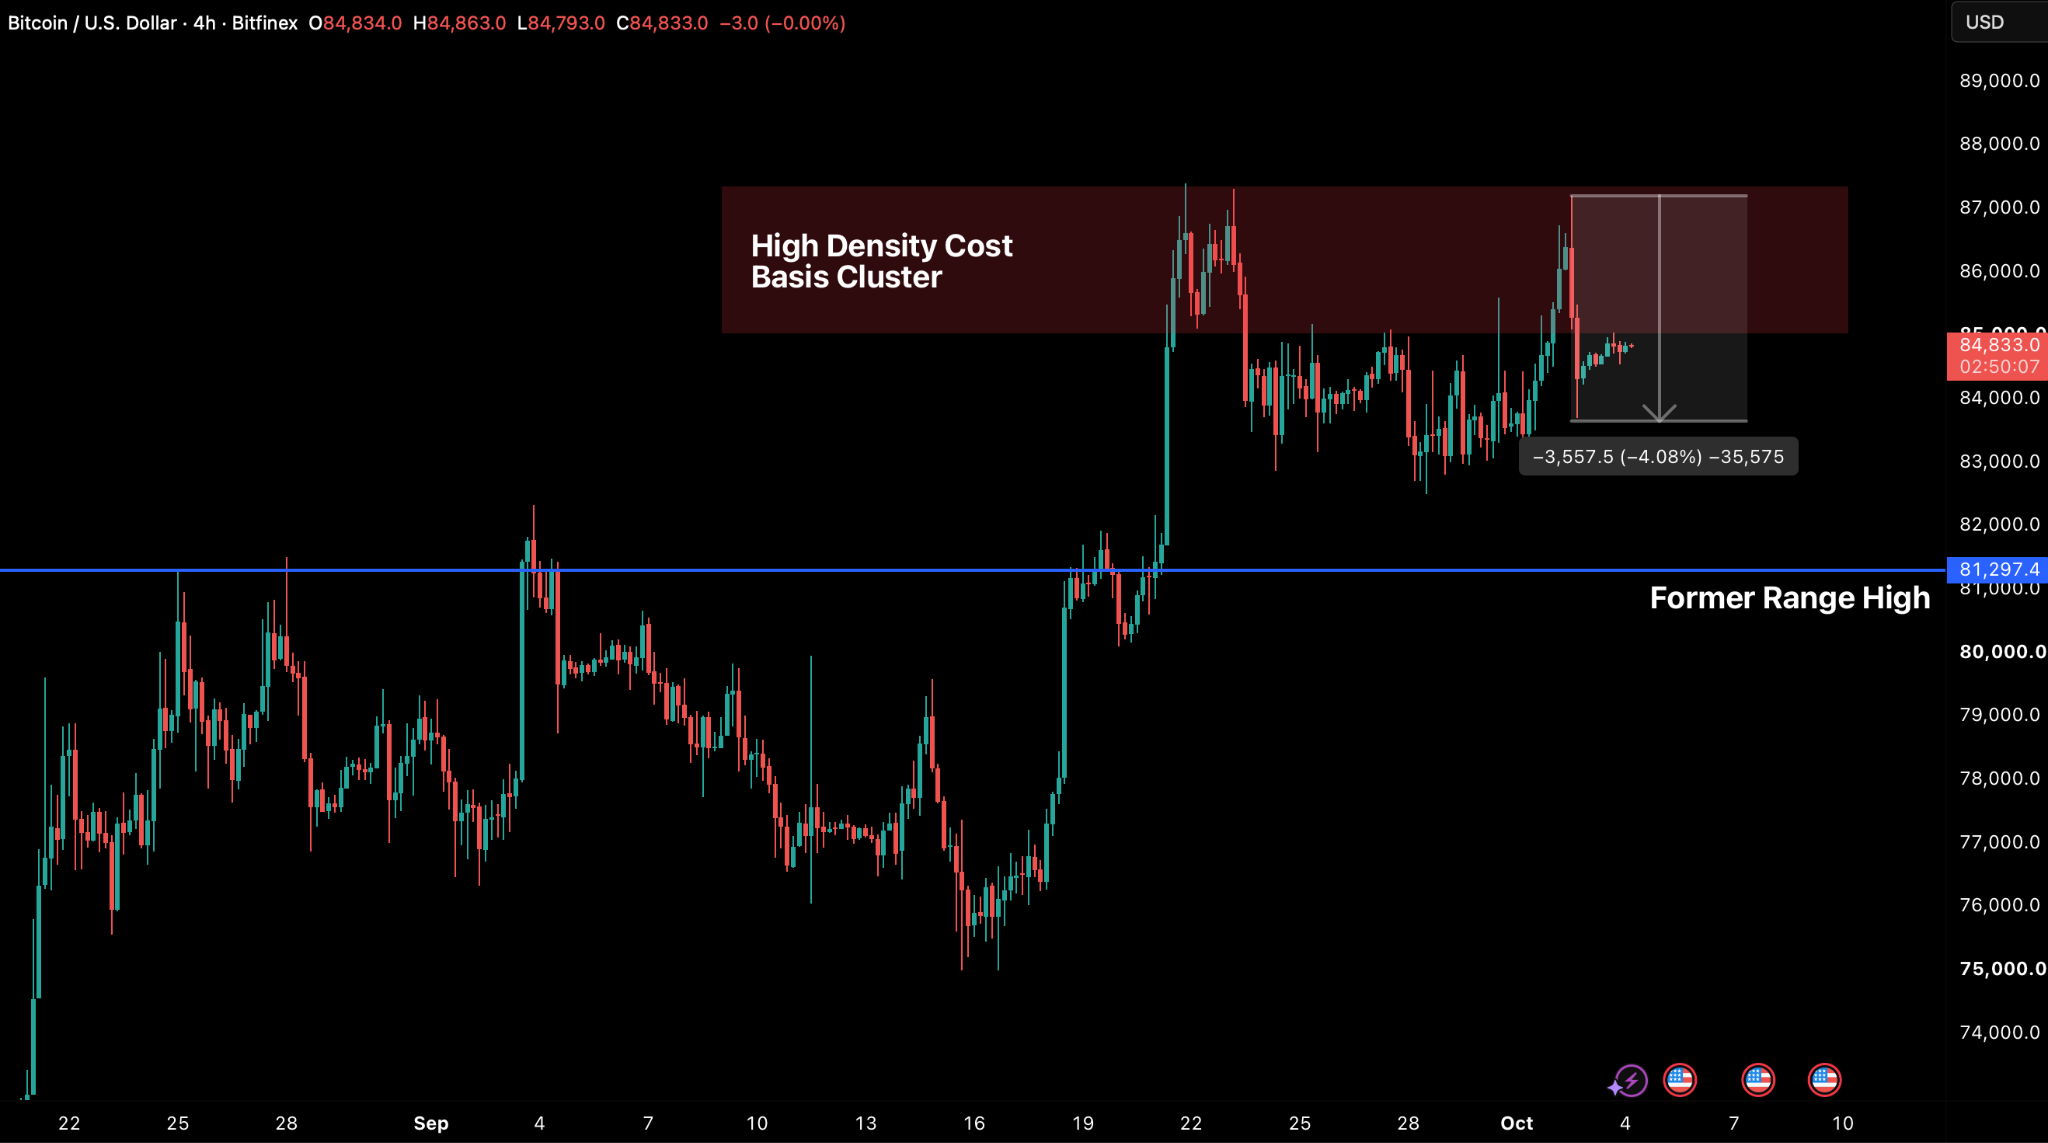
Bitcoin attempted a breakout above the $86,500 upper threshold last week following the release of the September payrolls report on October 2, but the rally failed to hold. After encountering heavy selling around $85,500-$86,500, BTC quickly retraced below the $84,000–$86,500 high-density cost-basis cluster outlined in last week’s Intelligence Update. BTC has consequently returned to a structural consolidation phase, although our base case continues to favour a resolution to the upside once this range matures.
Despite the temporary rejection last week, market structure remains constructive. BTC has now posted three consecutive green weekly closes and on 2 October reached $87,197, its highest level since January, while maintaining firm support above critical on-chain thresholds. Crypto performance, however, continues to be capped by historically high US Treasury yields. With the 5-year yield pushing past 5.0 percent and the 10-year crossing 5.2 percent last week to hit 19-year highs respectively, elevated risk-free rates are restricting broader risk asset participation. While modest Treasury interventions have done little to stem yield expansion, mounting pressure within sovereign debt markets may ultimately necessitate more aggressive policy expansion. A larger intervention, heavier buybacks or a shift of issuance toward shorter bills would lower the hurdle rate for BTC and other risk assets, or add liquidity. It would also be landing on a market that is already constructive above $84,000, with little supply between the yearly open and $90,000.

Derivatives Positions Reset
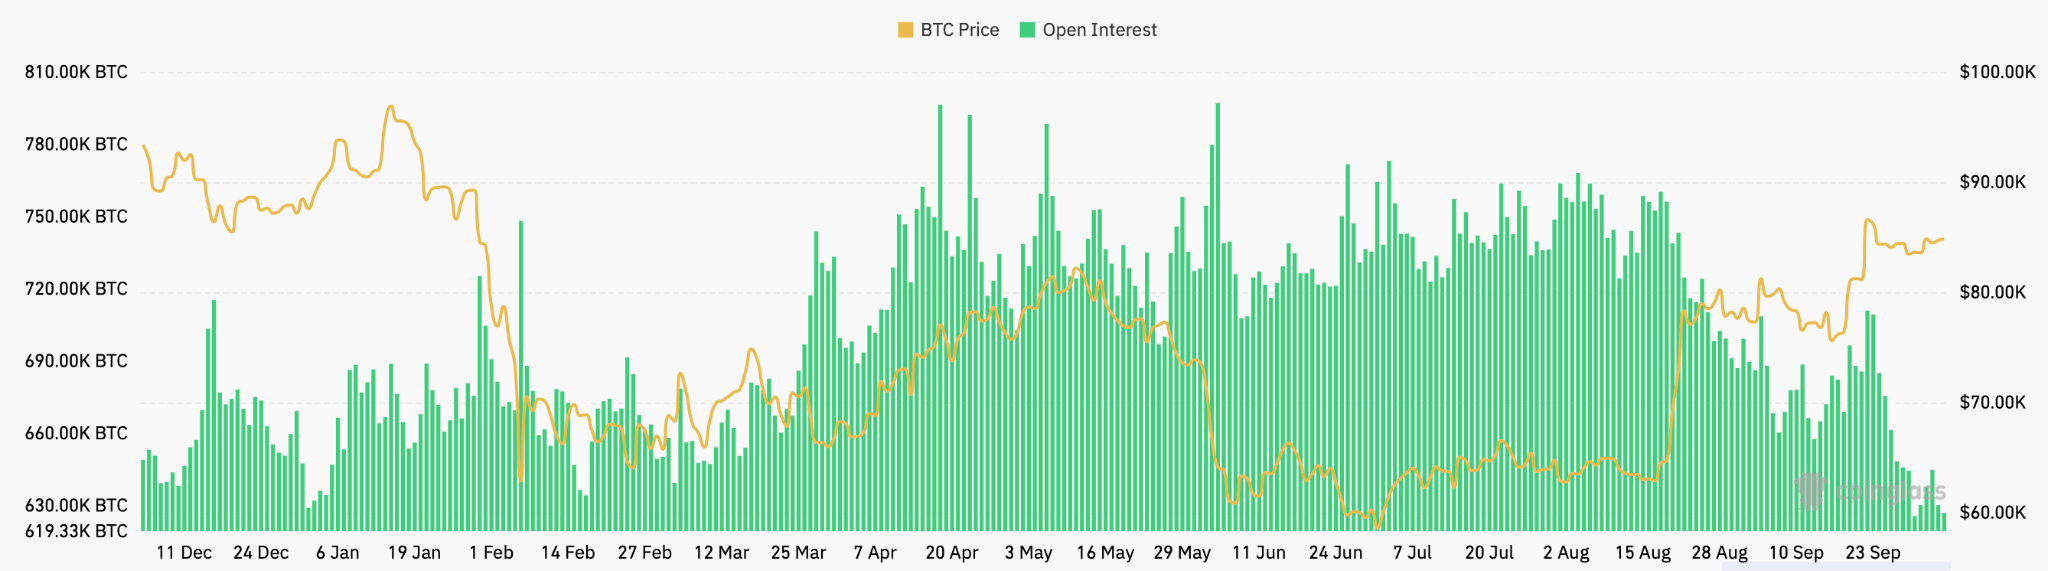
Aggregate futures open interest (OI) in bitcoin-notional terms has fallen to 625,000 BTC, the lowest OI print since 1 January. This remains an orderly reset, with OI falling by 79,000 BTC over the past week, mainly through profit-taking instead of liquidations.
In USD-notional terms, OI expanded by $2.1 billion in the 24 hours preceding Friday’s nonfarm payrolls (NFP) data for September, driven in part by a 3.2 percent rise in bitcoin over the same period. Measured in coin terms, derivative positioning expanded by approximately 2.5 percent.
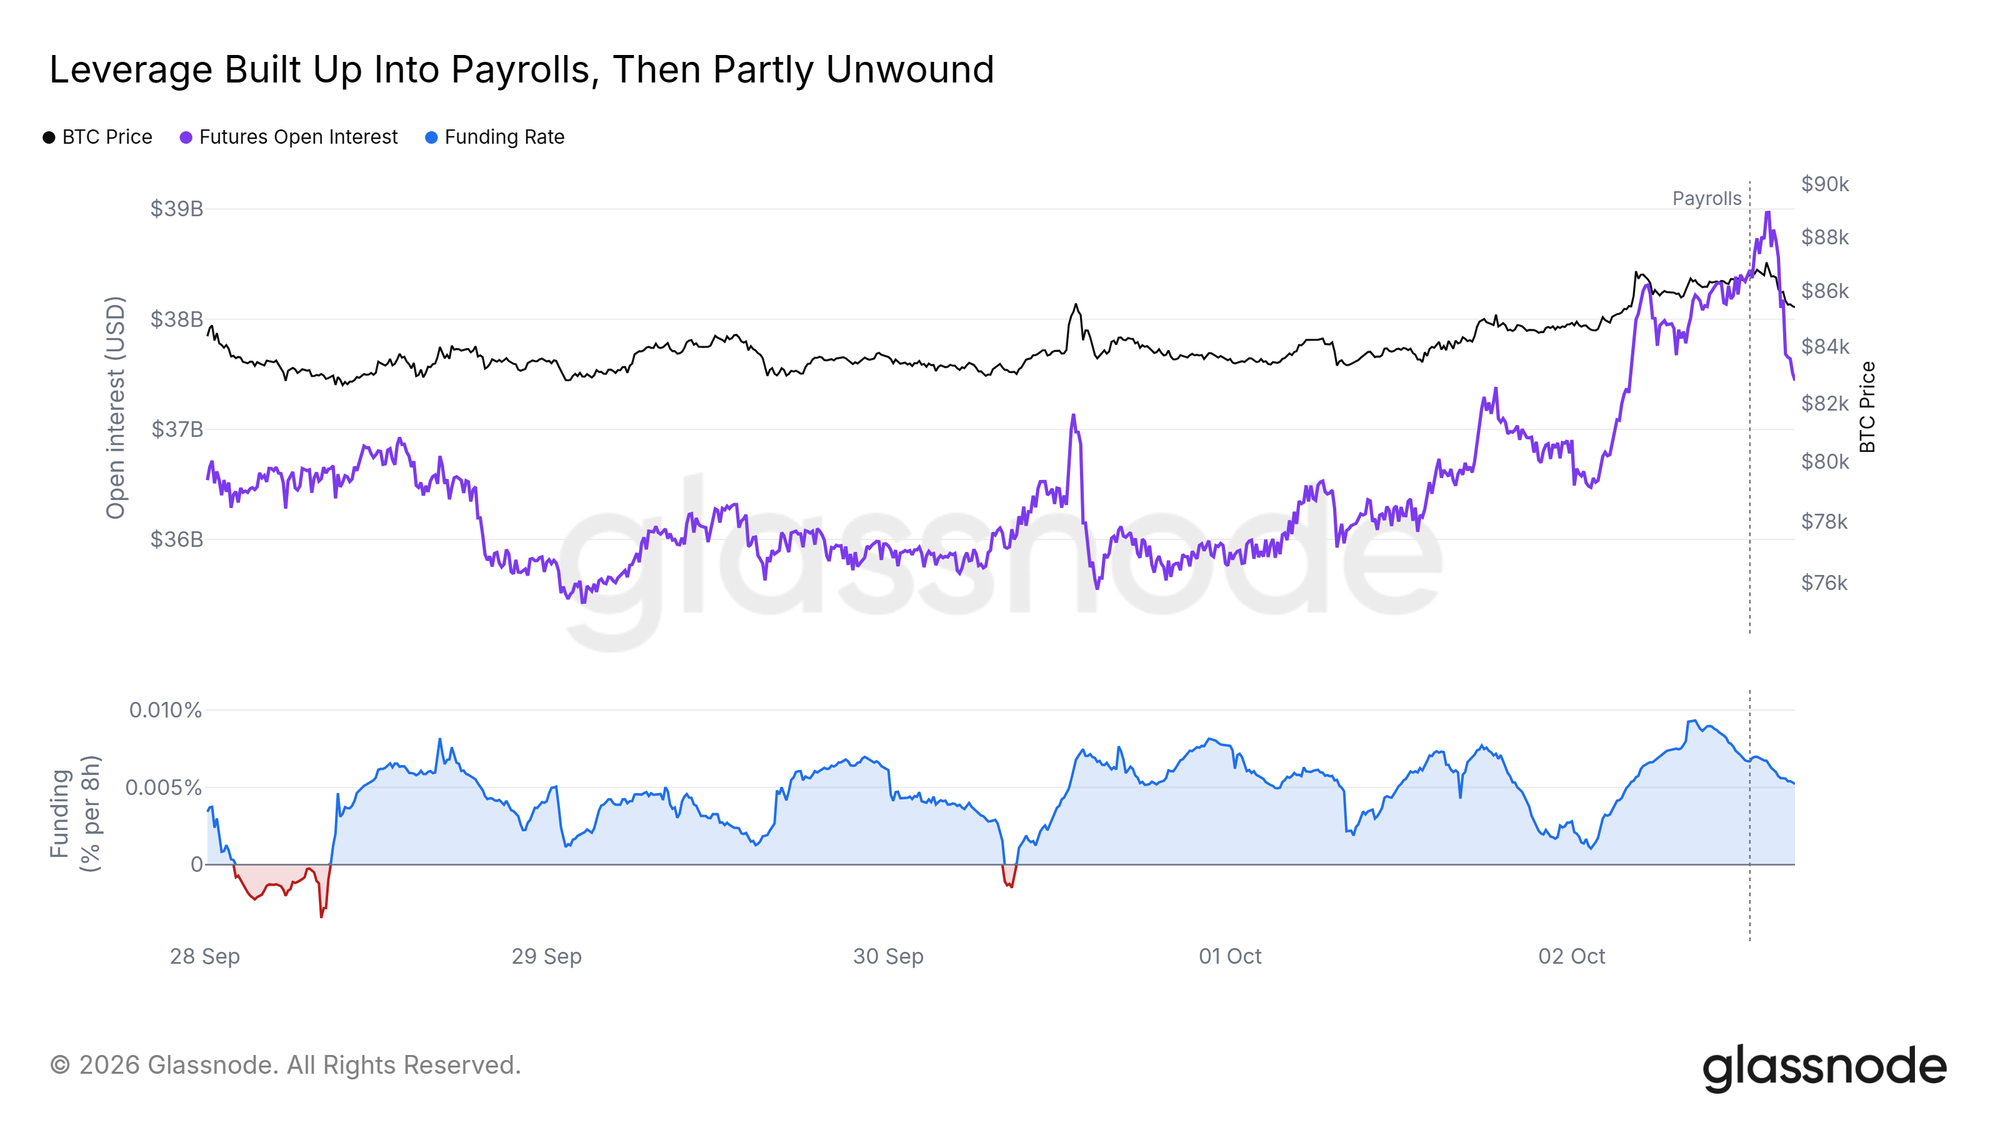
Perpetual funding rates remained positive but below their baseline averages, indicating that leveraged long positioning had not become overly saturated. Open interest continued to rise for roughly an hour following the release of September payrolls before contracting by $1.5 billion as spot price turned lower.
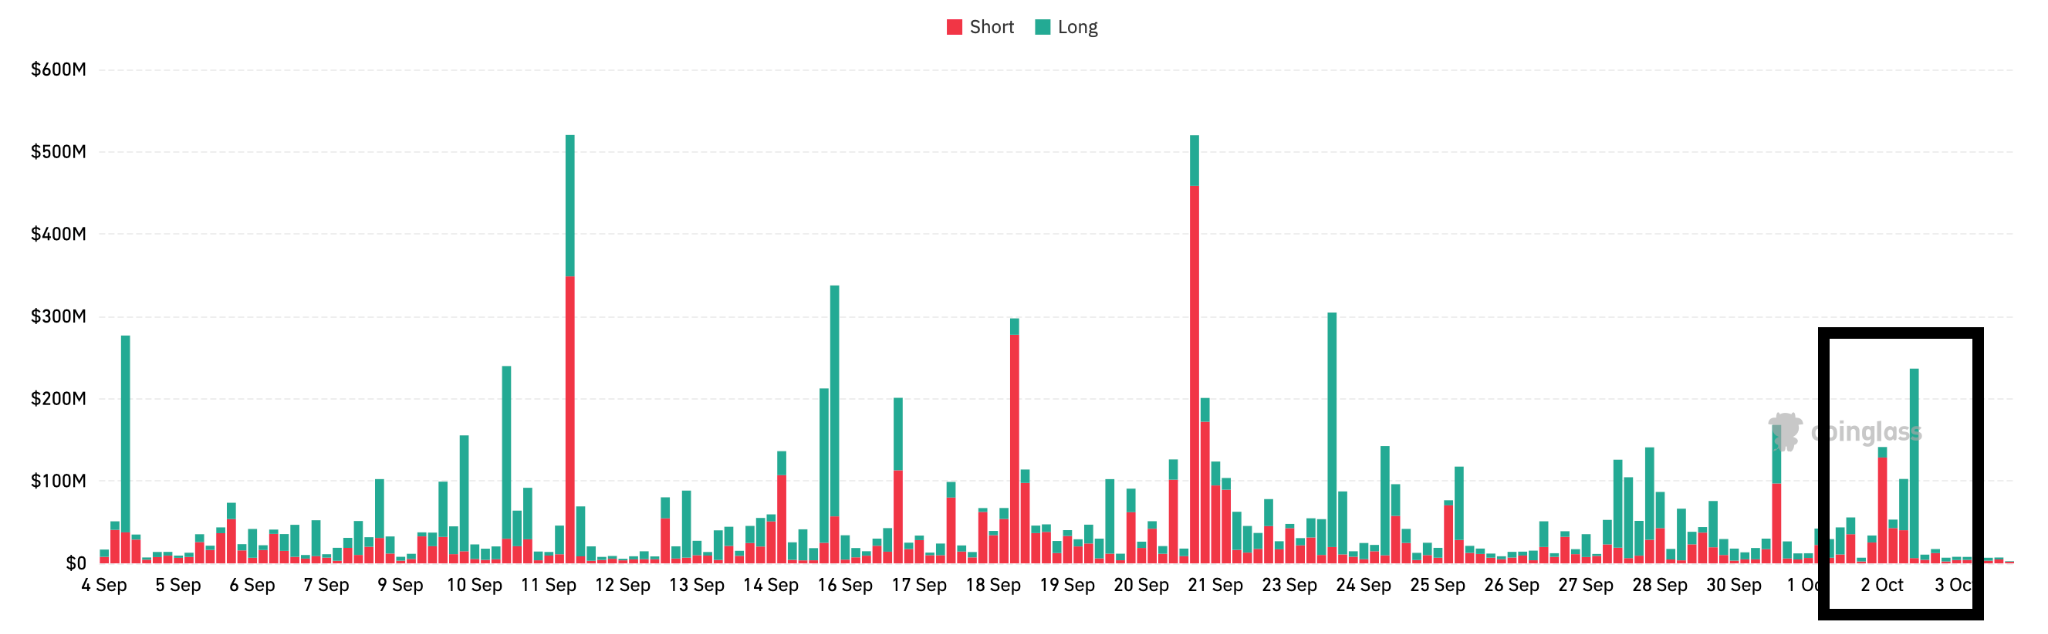
Liquidations remained skewed towards shorts over the week, which accounted for approximately 60 percent of the total. Notably, the sharpest leverage flush occurred at 04:20 UTC on Friday, eight hours before the payrolls release, when $50 million in short positions were liquidated within ten minutes despite no scheduled economic catalyst. The payrolls release itself triggered a considerably milder shorter squeeze. This reinforces how sensitive BTC remains to changes in derivatives positioning, even as OI remains below bull market levels.
Positioning nevertheless remains relatively subdued. Average perpetual funding rose from about three percent annualised last Monday to about six percent ahead of payrolls, before returning to around three percent over the weekend. Liquidation heatmap data shows $380 million in short positions exposed between $85,000 and $87,000 and $1.19 billion in long positions exposed below $80,700, leaving neither liquidation pool within the current range.
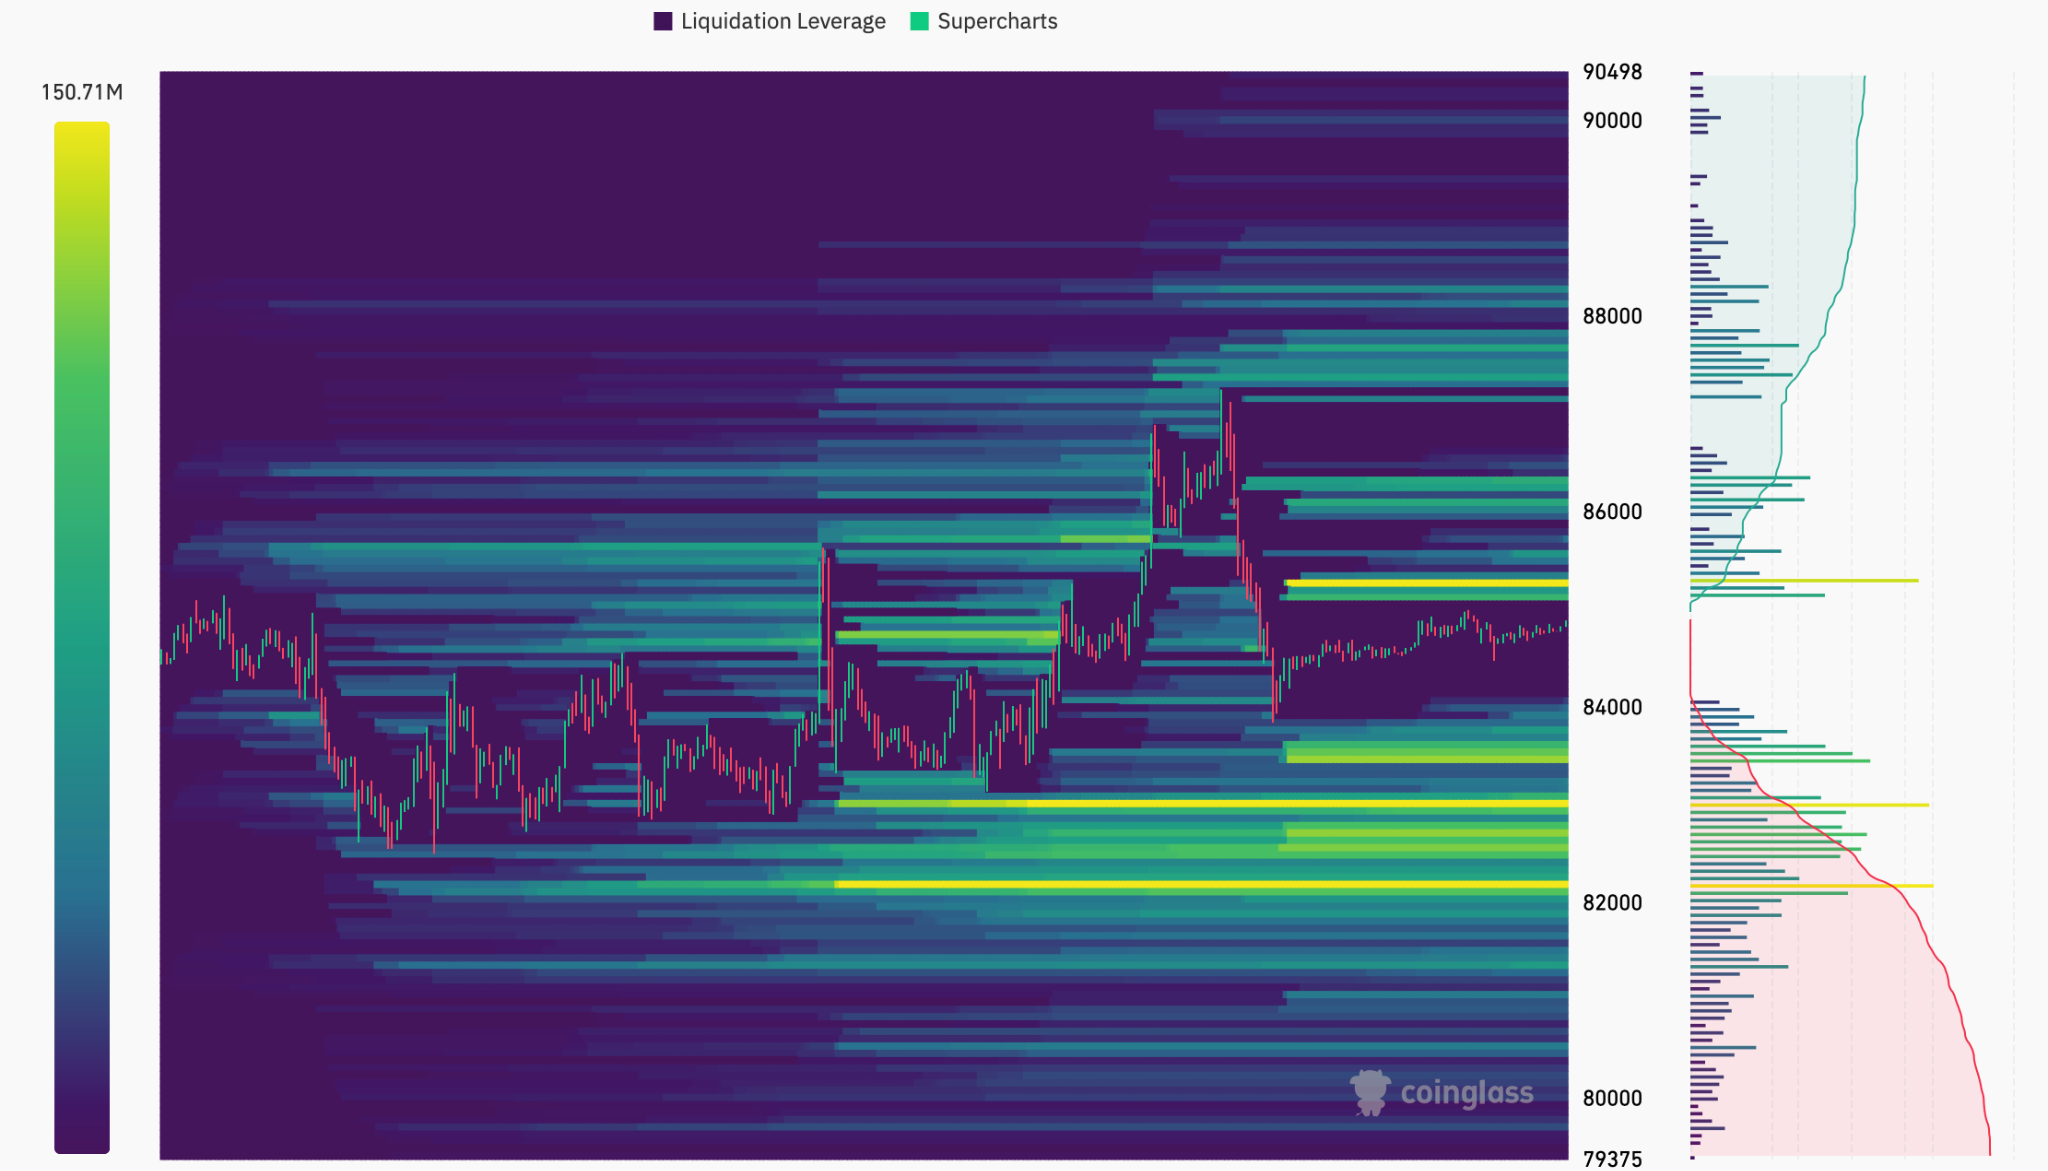
In last week’s Intelligence Update, we wrote that the next sustained move would need to be led by the spot market. Friday tested that view as a futures-led move reached the top of the range and did not survive the day. What is required now is for OI to rise alongside spot volume. OI rising on its own has marked exhaustion near $87,000.

ETF Buyers Are Back at Breakeven
The spot bid that carried bitcoin through $81,300 in September slowed to almost nothing this week. A nine-day run of ETF inflows, totalling $3.08 billion, ended on 30 September with a $148.7 million outflow. It was the largest daily outflow since 16 September, although at just 13 percent of the record $1.11 billion outflow, it remained modest by historical standards. Nevertheless, the reversal after nine consecutive days of inflows suggests buyers had stepped back — at least temporarily.
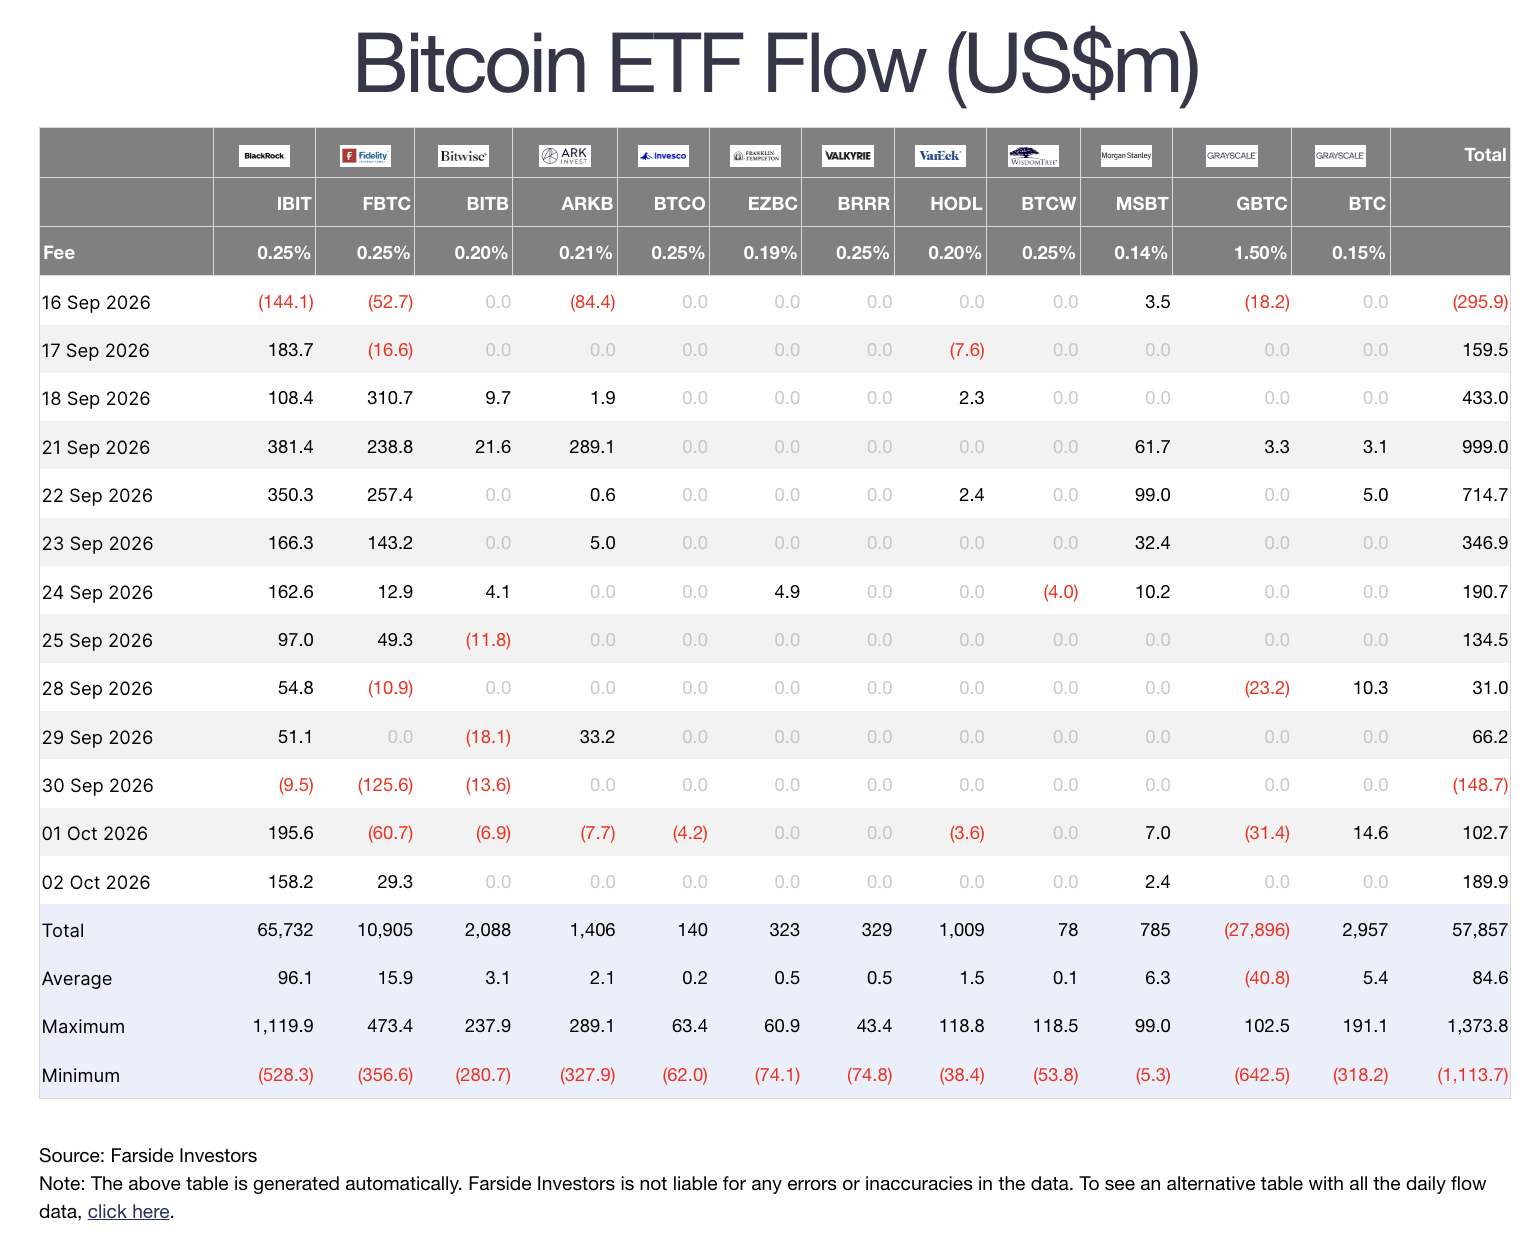
Fidelity’s FBTC recorded $168 million net outflows over the week, while BlackRock’s IBIT took in $450.2 million across the five sessions. During the nine-day run the ETFs averaged about $340 million in daily inflows, while the strongest session this week was 2 October, with a net inflow of $189.9 million.
One possible explanation for the current slowdown in buying is that the average ETF investor is back at their entry price for the first time since January. Estimates of that price differ by methodology. Glassnode’s, which we cited last week, is about $81,700, while Checkonchain’s flow-weighted estimate is $84,320. On the Checkonchain measure, BTC spent 233 consecutive days below the ETF cost basis, from 31 January to 20 September. It reclaimed the level on 21 September and has remained within two percent of it for 11 days, the longest such stretch since the funds launched.
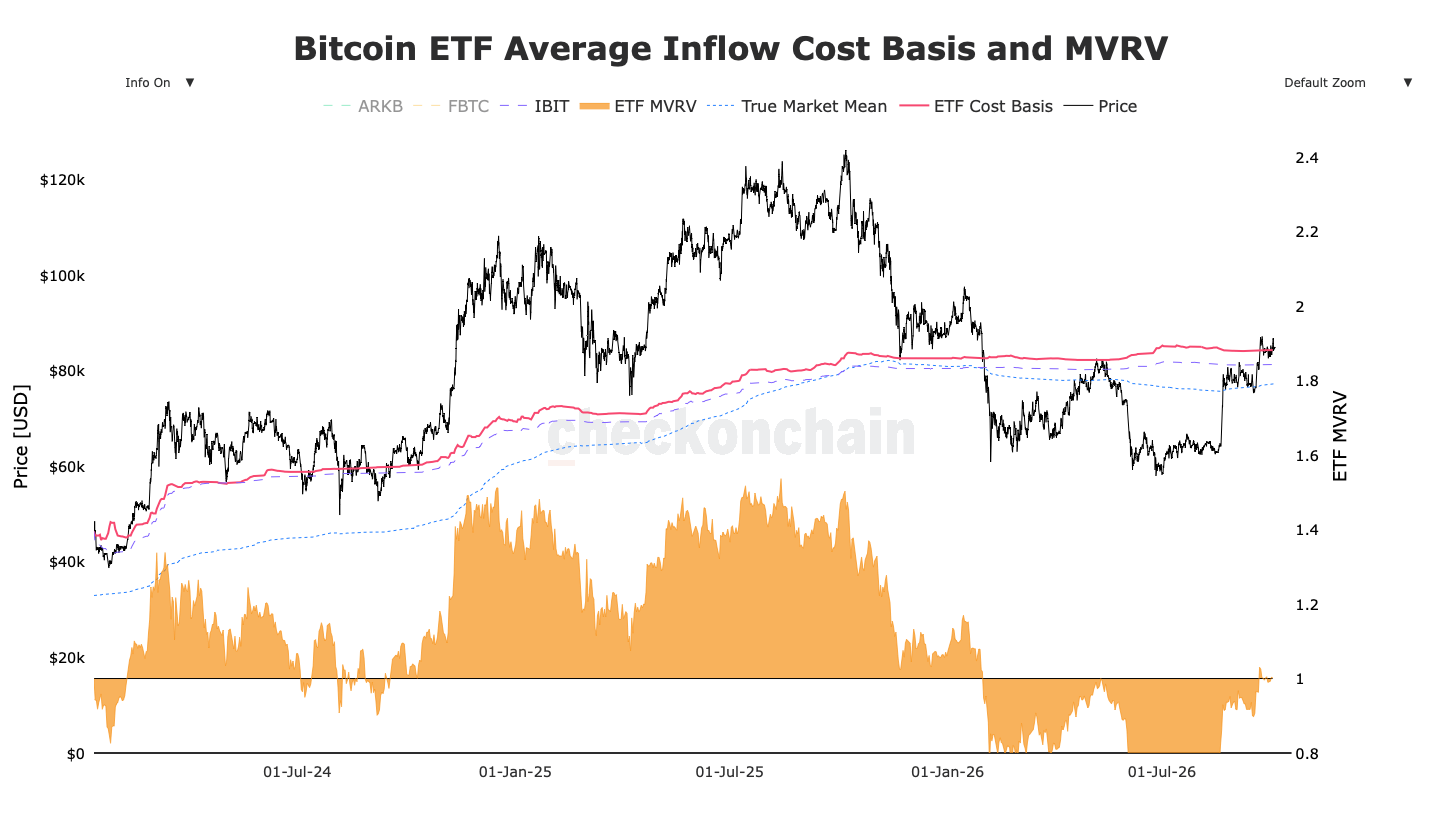
A cohort at breakeven behaves differently from one already in profit. Since launch, ETF inflows have averaged $65 million a day when bitcoin was within two percent of the ETF cost basis, compared with $136 million a day when it was more than 10 percent above it. Buying has been slower around breakeven and faster once holders are clearly in profit.
The precedents are encouraging but not one-sided. On each of the four occasions in 2024 when bitcoin moved back above the ETF cost basis, it was higher 30 days later. The one contrasting case came in May this year, when price approached ETF breakeven, but failed to reclaim it, before falling 24.8 percent over the following month to the $57,803 bear market low.
The Bitfinex Absorption-to-Emission Ratio (BAER) we cited last week measures ETF bitcoin purchases against the roughly 450 BTC issued each day. A return to five times daily issuance, equivalent to about $190 million of ETF inflows a day, remains the minimum needed to work through the supply between $84,000 and $86,500.
Several sessions near the $340 million daily average of the September run would provide stronger confirmation, while a return to the roughly $1 billion pace seen on 21 September would mark an extreme. Price above $86,000 would put the ETF cohort clearly in profit, while a move below $82,600 would put it back underwater, as in May.


Bitcoin is Standing on its Largest Cost-Basis Cluster
The $84,000 level is bitcoin’s lower timeframe pivot point. The $84,000–$84,500 band contains 867,000 BTC (4.3 percent of supply), marking the market’s largest cost-basis cluster and the dividing line where 75 percent of supply sits in profit.
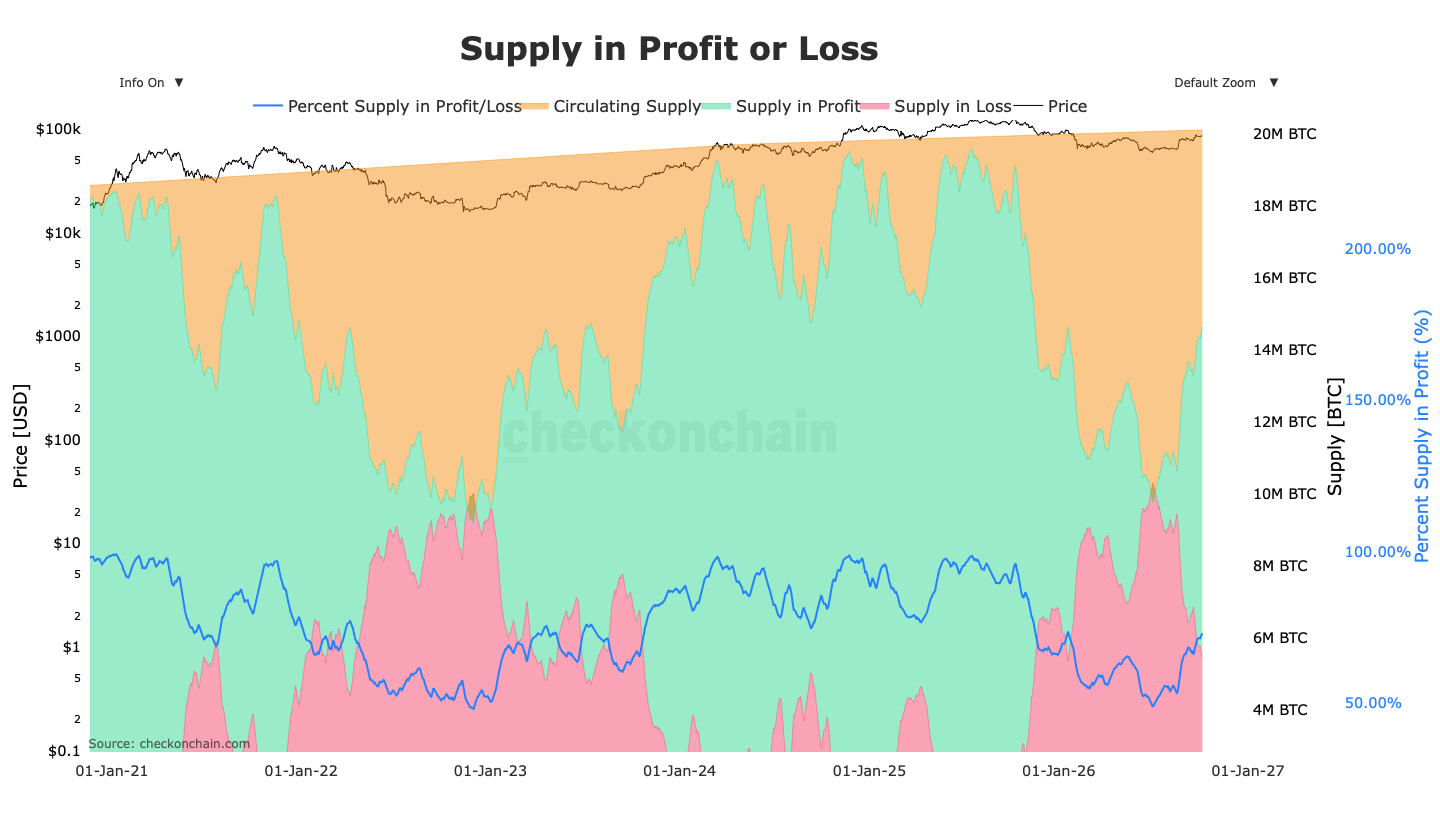
Holding above $84,000 keeps the structural target of $96,700 active. Conversely, a breach below $84,000 would reduce supply in profit to below 70 percent, signalling downside risk toward the $77,000–$81,500 demand zone with key on-chain levels such as the True Market Mean. Traders should monitor $84,000 as the critical line for regime preservation.
Sellers Are Scarce Below $90,000, Which is Where the Next Real Supply Sits
The supply side has improved since last week, and that is why we do not read last week’s rejection as a top. Long-term holders took 55 percent of all realised profit in the week to 29 September, up from 34 percent, as price reached their cluster. That selling has faded. The 30-day change in long-term holder supply in profit moved from a reduction of 37,288 BTC on 30 September to an increase of 16,503 BTC on 3 October, according to Checkonchain.
Profit-taking as a whole is small by the standards of earlier highs. Realised profit is running near $0.76 billion a day on Checkonchain’s measure, against peaks of about $2 billion in October 2025 and $3.7 to $4 billion at the two 2024 highs.
It also matters who holds the coins that were bought above the current price. Short-term holders have only about 370,000 BTC at a loss, 1.9 percent of supply, so the buyers of the recent pushes to $87,000 are too small a group to cap the market by themselves. Long-term holders have about 4.7 million BTC at a loss, and most of it was bought above $90,000 in late 2024 and 2025. Supply is therefore light between the yearly open and $90,000 and heavy beyond it, which is also where the options market holds its largest call positions.
Short-term holders, for their part, are comfortable. Their average cost basis has risen to $73,683, which puts short-term holder Market Value to Realised Value ratio at 1.15, though still below the 1.2 reached on 21 September.

Catalysts and Risks
The Fed is Likely to Hold in October, but a December Hike Stays Live
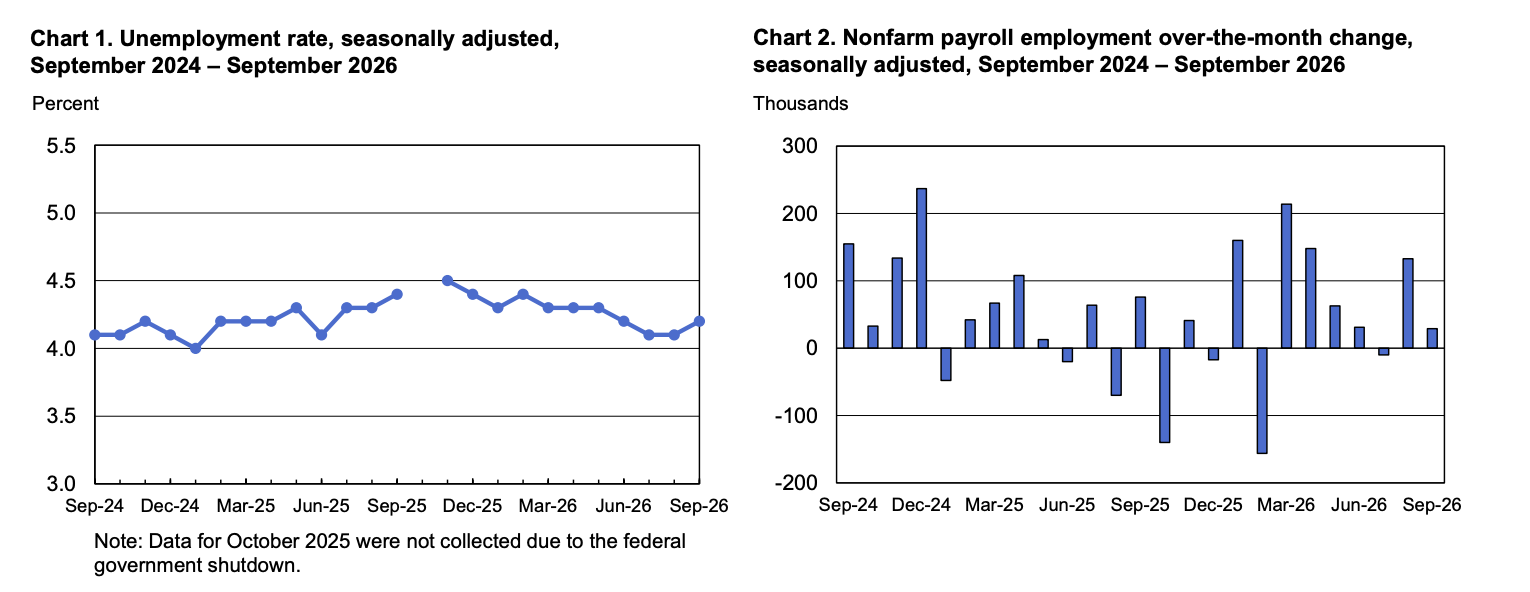
The Employment Situation report from the US Bureau of Labor Statistics showed payrolls rising by 29,000 in September and the unemployment rate edging up to 4.2 percent. These lower-than-expected figures represent slow hiring, however, not a deteriorating labour market. Unemployment rose as more people entered the labour force, and average hourly earnings rose 3 percent on the year, so wages are not adding to inflation.
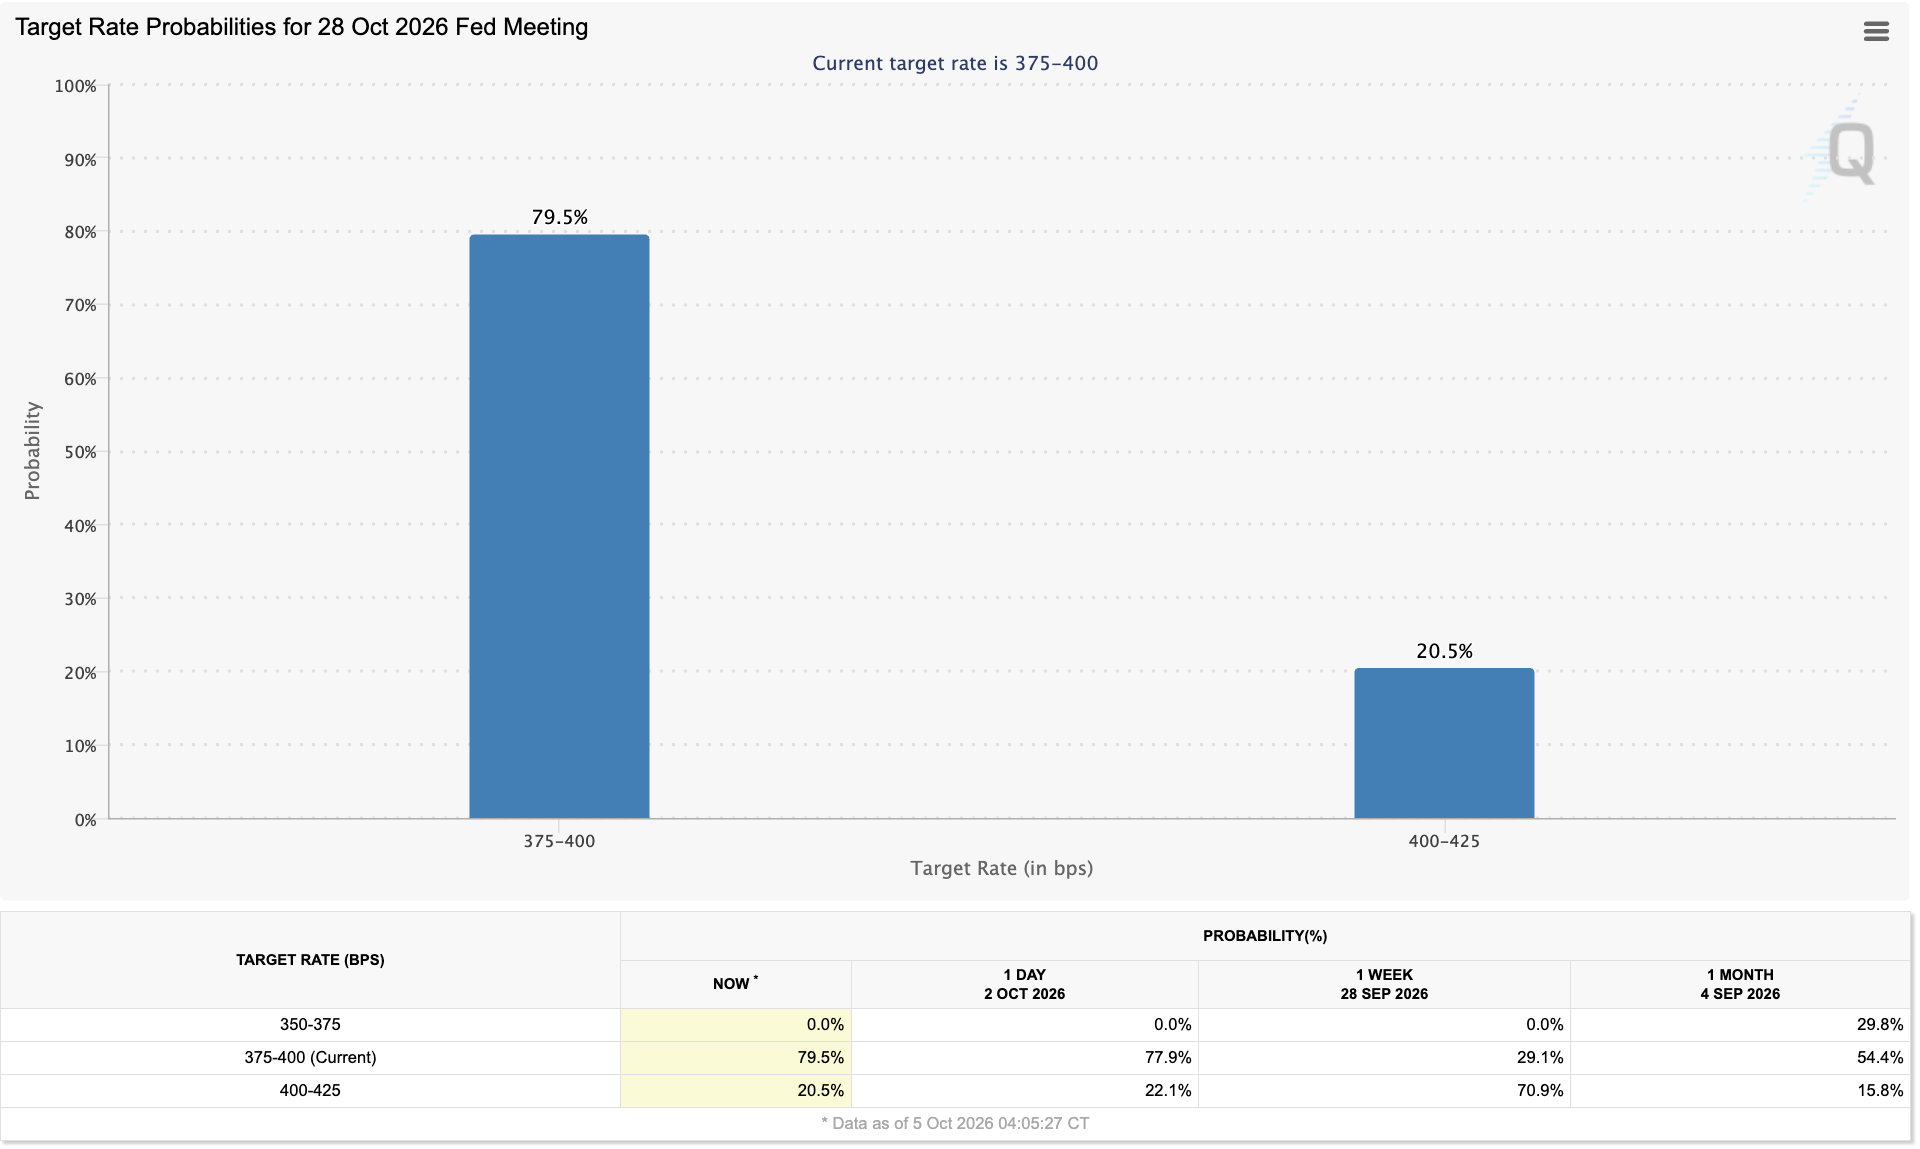
For the Federal Reserve, this weakens the case for announcing a further rate hike this month. Target rate probabilities for a pause rose to 79.5 percent on 5 October from just 29.1 percent a week prior. A Fed on hold keeps short-term yields and the dollar from pushing higher in the near term, which stops financial conditions from tightening further. For Bitcoin, that is the removal of one headwind, but not the arrival of a tailwind. The view is challenged if unemployment rises without a matching rise in participation, because that would signal real weakness and not new job seekers.

The decision in October will be about timing, not direction. The Personal Income and Outlays report from the US Bureau of Economic Analysis (BEA) showed headline Personal Consumption Expenditures (PCE) inflation at 3.4 percent in August. Core PCE, which strips out food and energy and is the Fed’s preferred guide to underlying inflation, was at 3 percent. Both sit well above the Fed’s 2 percent target, and energy prices are up 16.8 percent on the year.
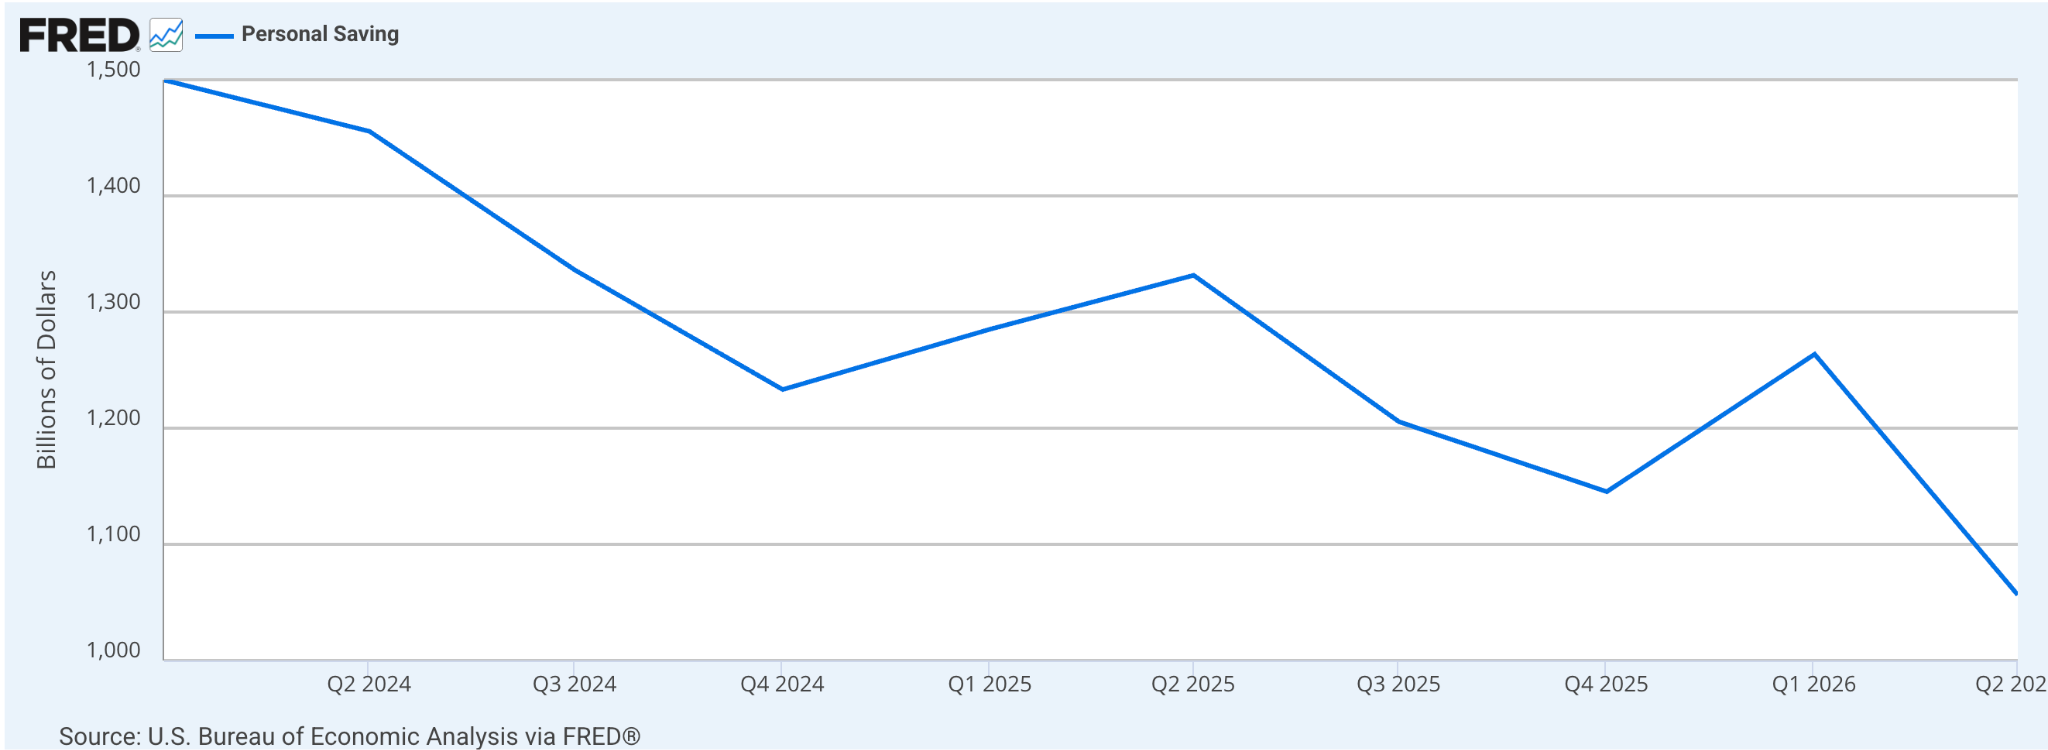
Demand is also not cooling enough to do the Fed’s work for it on inflation. Consumer spending rose 0.6 percent in August after inflation, while real disposable income was flat, so households funded the gap by saving less.
This is what keeps a 25 basis-point rate hike this December still in play. Inflation at 3 percent with firm spending gives the Fed no basis to signal that it is finished, so longer-term yields and the dollar stay elevated and liquidity stays tight. Those are the conditions that cap risk appetite, and crypto with it. The spending is also fragile, because it is funded by lower savings and not by rising income. A saving rate that keeps falling cannot support consumption indefinitely.
The next test is September CPI, which will be announced on 14 October. It will be the last indicator of consumer inflation that the Fed has before it meets on 27 and 28 October. Conditions turn more supportive for crypto if core CPI shows signs of slowing, weakening the case for a December rate hike. They turn less supportive if core inflation holds or rises while spending stays firm, which would put a December hike back at the centre of the rate outlook.

Outlook for the Week
Base Case
We expect bitcoin to spend the week between $84,000 and the $87,722 yearly open without resolving in either direction. The two forces that could end the range are both on hold. ETF buyers are currently at their entry price, and the Federal Reserve has no fresh inflation print to react to before the middle of the month. With macro neither helping nor hurting, any advance has to be paid for by spot buying, and that buying has not yet returned. Our upside view is intact, but the timing depends on flows and not on the calendar.

What Would Confirm It
Price: Daily closes that stay above $84,000 and below the yearly open.
Flows: ETF sessions that are positive but stay under the $340 million daily average of the September run.
Positioning: Funding near three percent annualised, and no build in open interest that outpaces spot volume.
Macro: Treasury yields holding near current levels, and Fed officials treating October as a hold.

What Would Invalidate It
An earlier breakout: Several ETF sessions at or above $340 million with a daily close above the yearly open would mean spot demand has returned sooner than we expect, making $90,000 the next test.
A loss of the range floor: Daily closes below $84,000 would end the range but not the recovery. Between $84,000 and $81,300 bitcoin would be retesting the September breakout level, with less than 70 percent of supply in profit and, below $82,600, ETF holders back under water. We would expect slower inflows and a later upside resolution, not a change in direction, provided ETF flows remain flat to positive and short-term holder Spent Output Profit Ratio (SOPR) holds above 1.0.
A breakdown of the recovery: Sustained trade below $81,300 alongside ETF outflows and a short-term holder SOPR under 1.0 would show recent buyers giving up and bring the $77,000 region back into play. A brief dip that clears the long liquidations near $80,700 and reverses within the session would not count.
A macro shock. Fed officials reopening the case for an October hike, or a further leg up in Treasury yields, would put the range floor at risk before flows can recover.

What to Watch
Daily ETF flows and short-term holder SOPR. These will determine which of the scenarios above is in play. SOPR compares the price at which recent buyers sell with the price they paid. It is currently at 1.02 and has not fallen below 1.0 since 17 August.
Fed minutes, Wednesday 7 October. The key question is how many officials still favour another rate hike this year.
September CPI, Wednesday 14 October. It falls outside this week but the next inflation release and the event most likely to end the range.
The Fed meeting on 27 and 28 October. We expect no change in rates, so any signal on a December hike matters more than the decision itself.