

Issue #224:
BTC Breakout Now Depends on Spot Demand
BTC Breakout Now Depends on Spot Demand
Last week saw the highest daily close since January, after Bitcoin successfully broke through its previous $81,300 range high, closing 6.68 percent higher at $86,607 on 21 September. That intraday high carried BTC’s recovery past the critical 50 percent mark that often separates bear market rallies from new uptrends. We saw substantial demand. US spot bitcoin ETFs took in $2.38 billion, the largest weekly inflow since October 2025. CME positioning shows leveraged funds also hedged no more than 15 percent of the absorbed supply, indicating predominantly directional demand. Price has since stalled at the $85,000 to $86,500 cost-basis node and consolidated between $83,000 and $85,000. The base case is consolidation between the $84,000 long-term holder cluster and the $87,722 yearly open.
The macro setup has tightened further since rates were increased earlier this month, even as crypto has decoupled, with fuel-supply constraints rather than excess demand continuing to pressure goods prices. Additionally, long-term borrowing costs have climbed since the decision. The 10-year Treasury closed at 5.17 percent on 25 September and the 10-year inflation-adjusted yield at 2.83 percent, against 5.01 percent and 2.68 percent respectively on 16 September.
The principal constraint on BTC this week is therefore the rising real return on low-risk assets, not sentiment. Any advance must be carried by spot demand, with the August core Personal Consumption Expenditures (PCE) price index data on 30 September providing the main macro test.

Market Signals
BTC Stalls at Cost-Basis Resistance but Holds $84,000
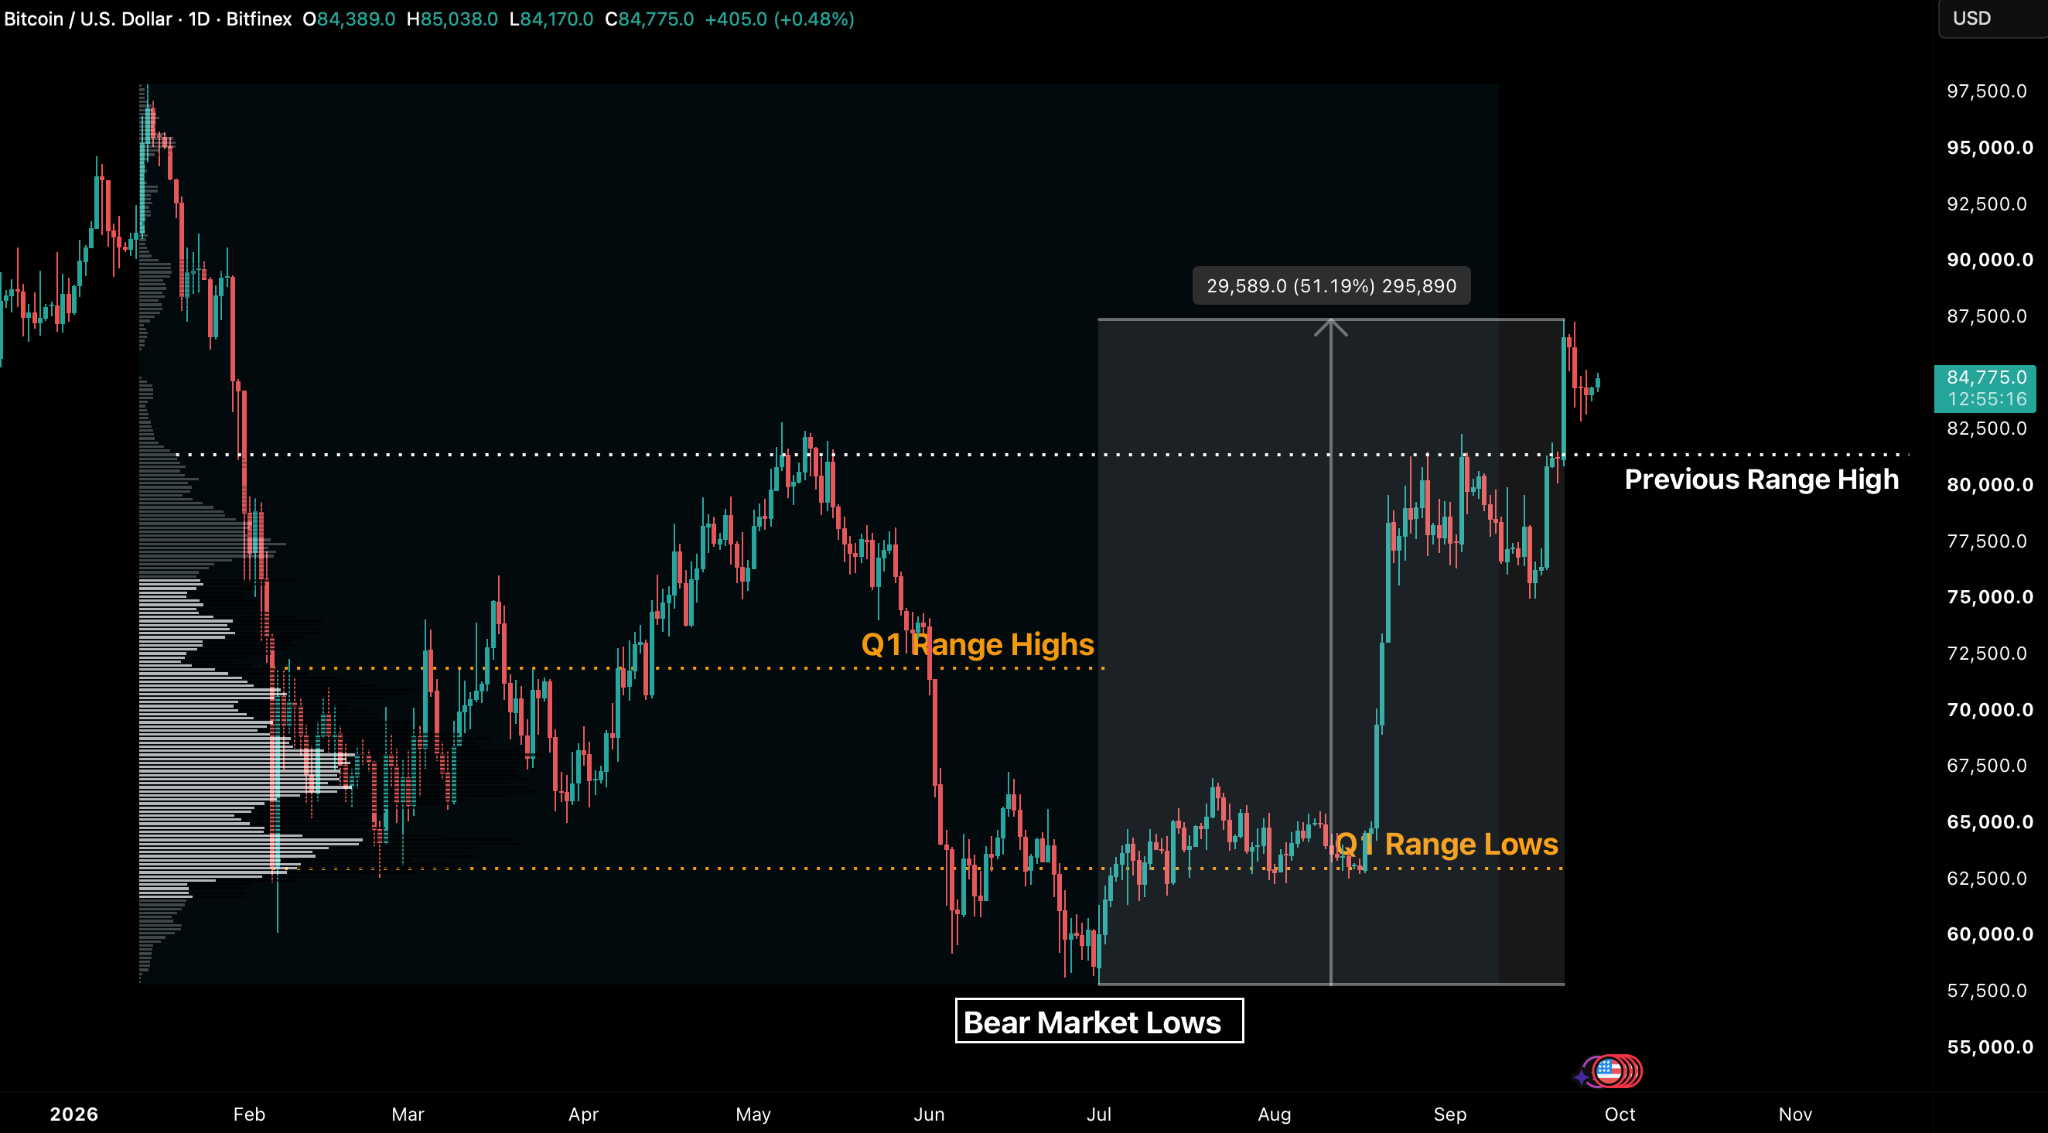
Following the Federal Open Market Committee (FOMC) rate increase earlier this month, bitcoin has decoupled, outperforming other risk assets despite a hawkish Federal Reserve and rising Treasury yields. BTC broke above the former $81,300 range high and closed 6.68 percent higher at $86,607 on 21 September, its highest close since late January. The move extended its recovery from the early-July low to beyond 51 percent, crossing the threshold that has typically separated bear market recoveries from uptrends that begin new bull markets.
The $87,722 yearly open remains untested, with BTC stalling last week at highs of $87,392 on 21 September and $87,301 on 23 September, before settling under the $85,000 key resistance we have previously identified. Currently, over 650,000 BTC lies within the $85,000 to $86,500 cost band, making it the densest cost-basis concentration between the $57,803 bear market low and the $126,110 all-time high. Price has held the level as resistance for now. Our view is that exchange-traded fund (ETF) flows, corporate treasury accumulation and broader spot market flows will decide where price resolves over the coming week and into the monthly and quarterly closes.
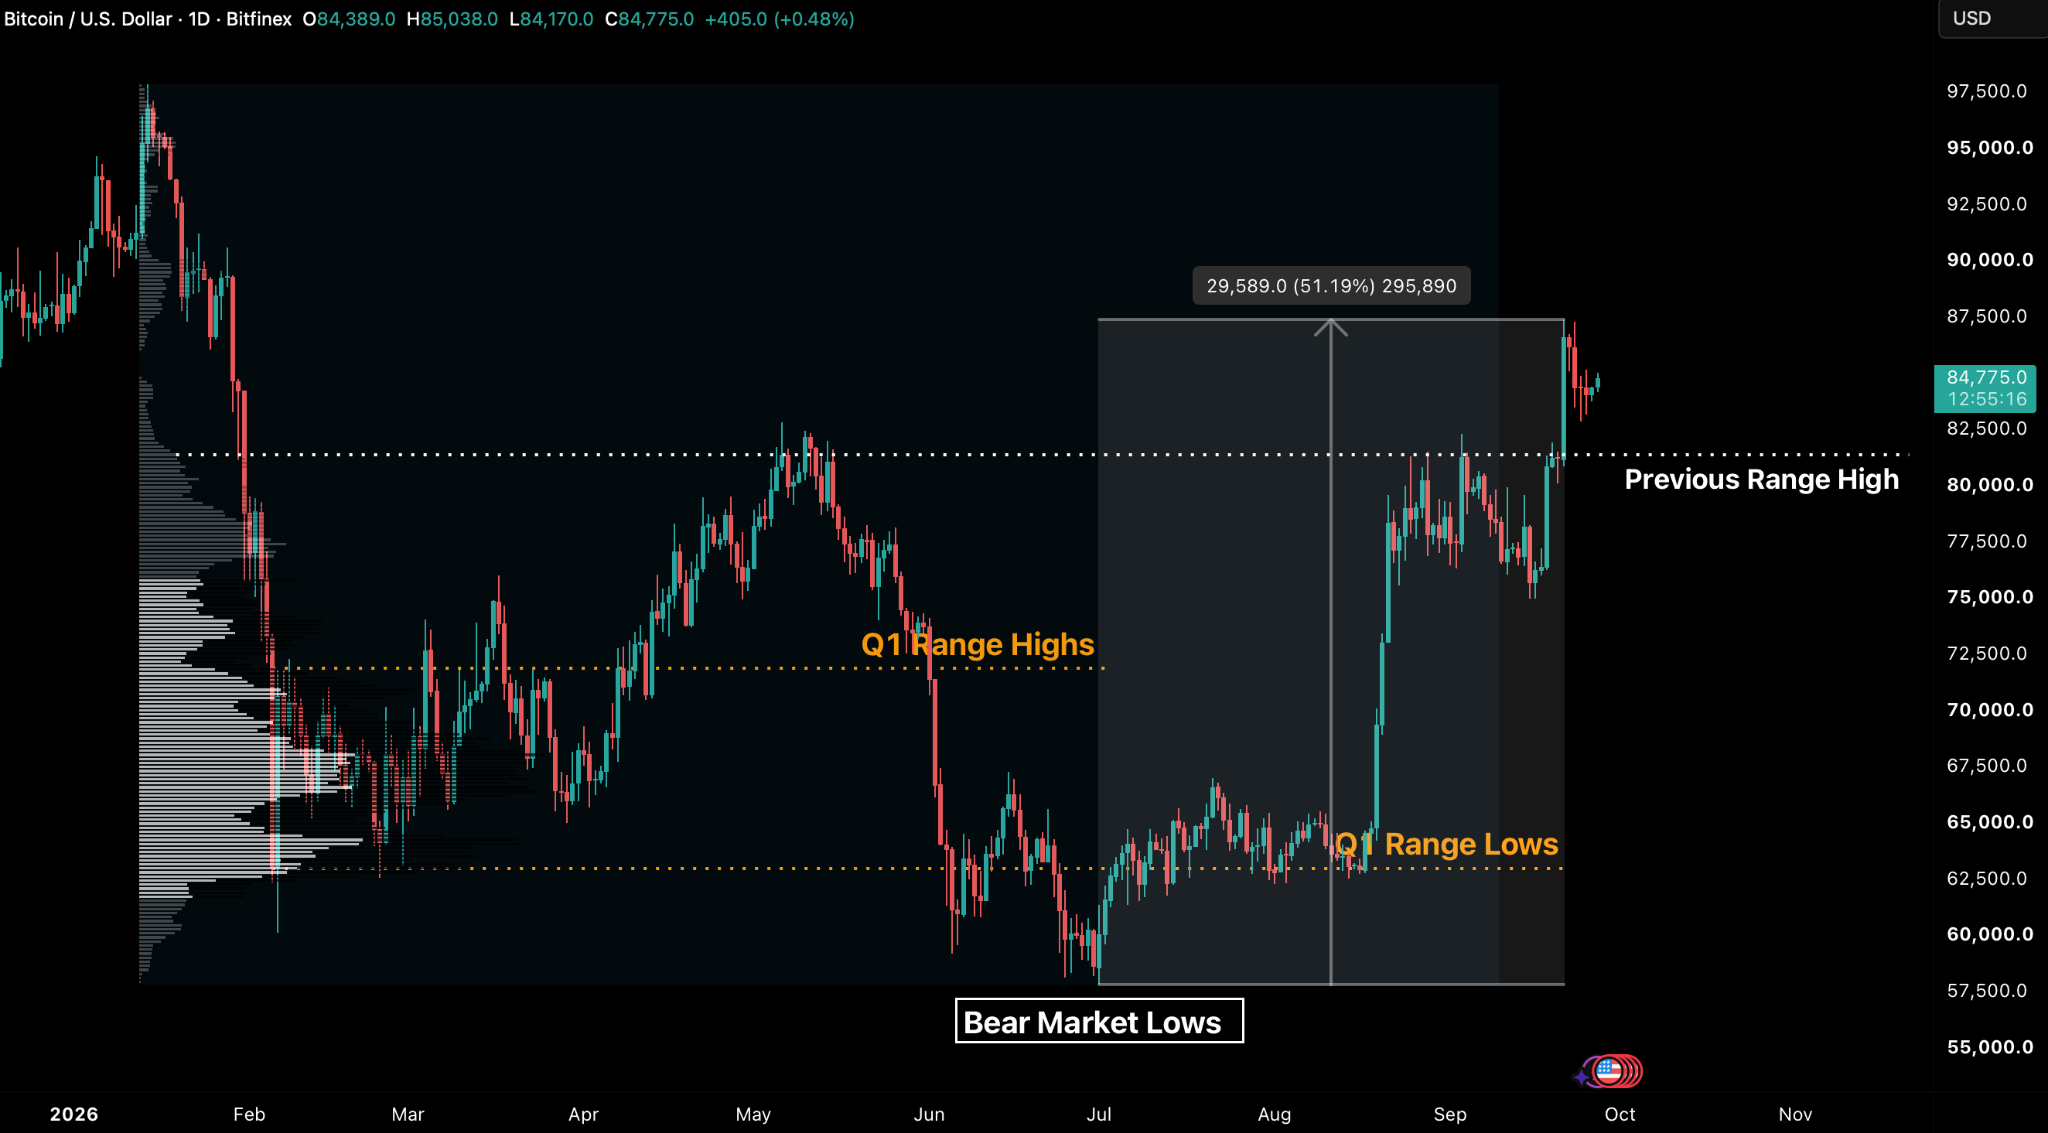
Since the spike above $87,000, BTC has consolidated within a $83,000 to $85,000 range over four consecutive sessions. Last week’s low of $82,865 on 24 September marked the sole probe into the lower-liquidity $82,500 to $84,000 zone, which also has a dense cost-basis distribution.
BTC closed the week up 4 percent, bringing September gains to 6.1 percent and Q3 performance to 42.1 percent from the $58,585 opening price. If sustained through quarter-end, this would be BTC’s strongest quarter since Q4 2024, its second-best Q3 on record and its best since September 2013.
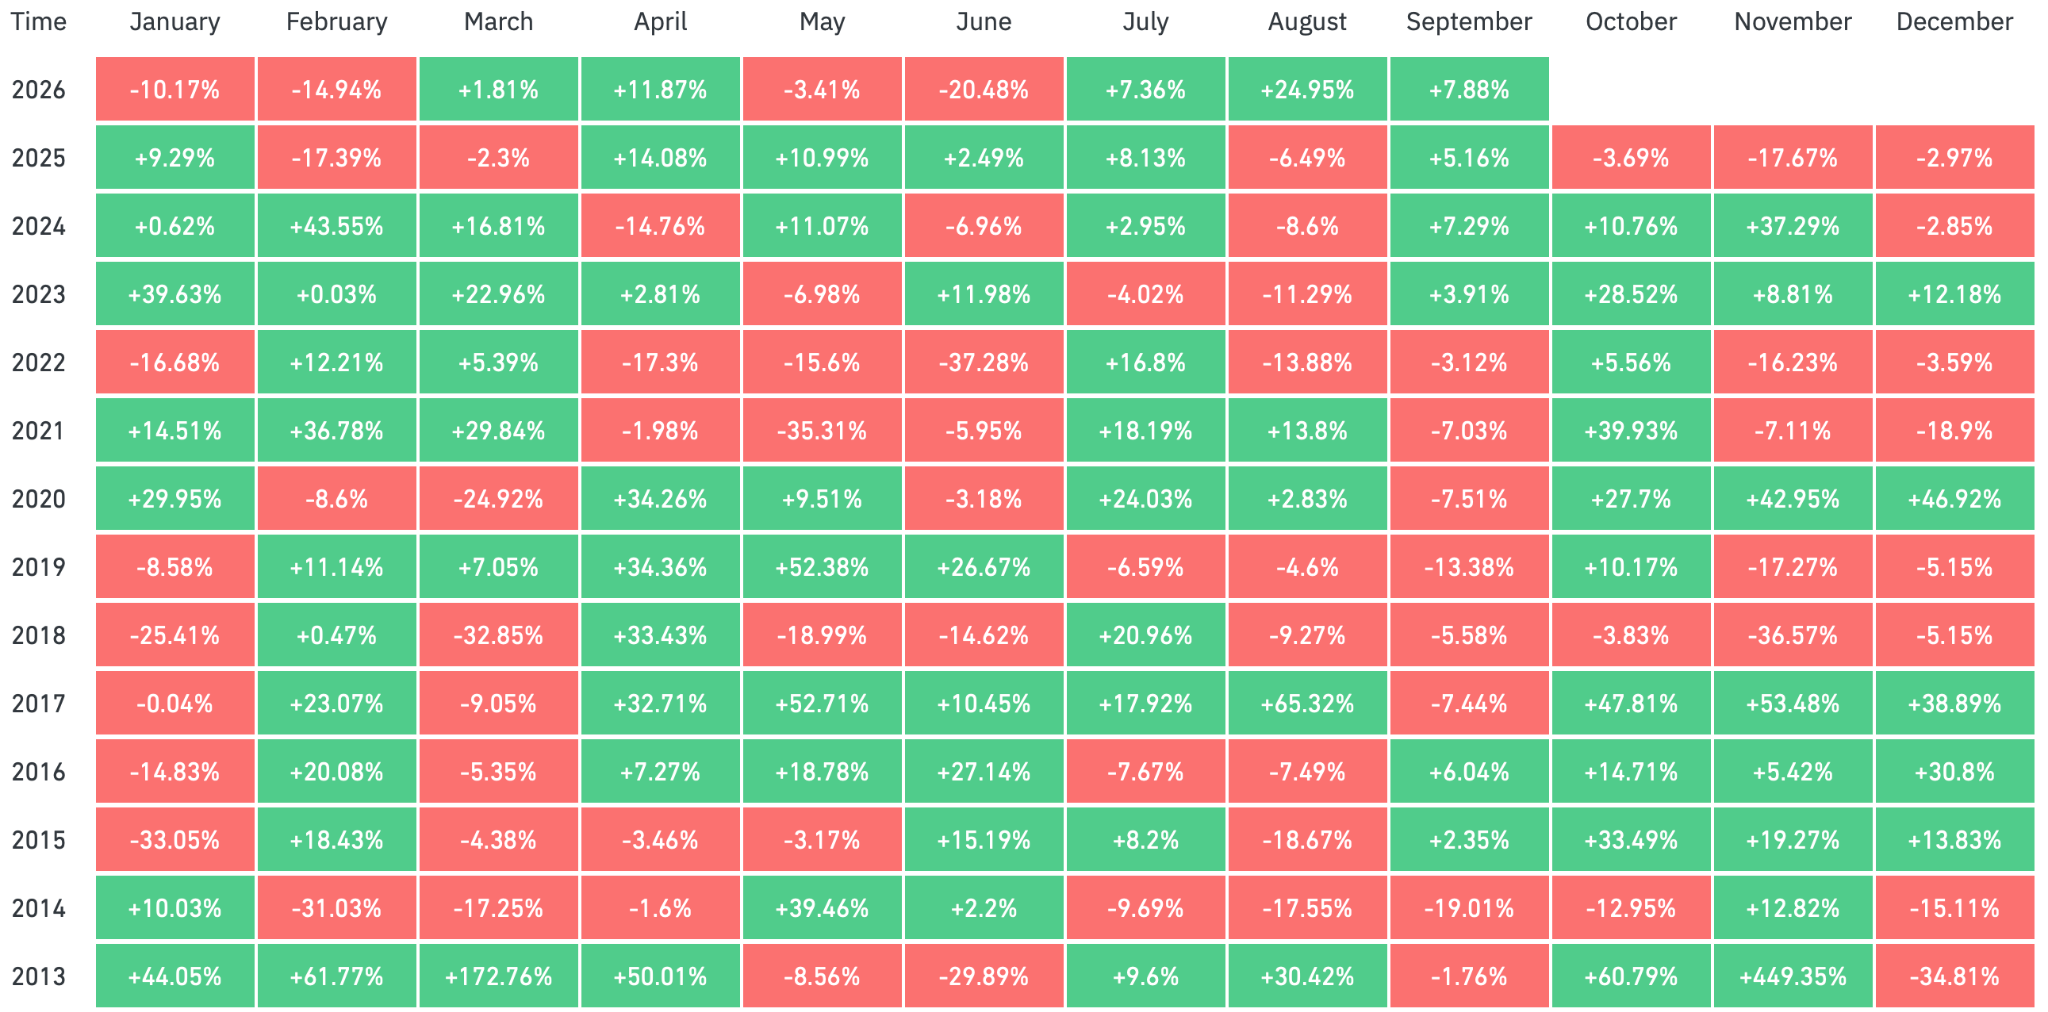
September has historically been bearish for BTC, with an average decline of 3.1 percent. The third quarter is also historically the weakest quarter for bitcoin and crypto markets in general, with an average return of 6.1 percent. The current strength seen, despite macro headwinds, points to an asymmetric bid that has outpaced other assets.

Asymmetric Strength Was Led by Leverage and Then Faded
Following the Fed’s rate increase, the US dollar rallied while Treasury yields rose, with the 10-year Treasury yield moving back above five percent. The S&P 500 declined 1.4 percent, while gold reversed its gains to close roughly $100 down on the session. Digital assets were the notable exception to this broader tightening response.
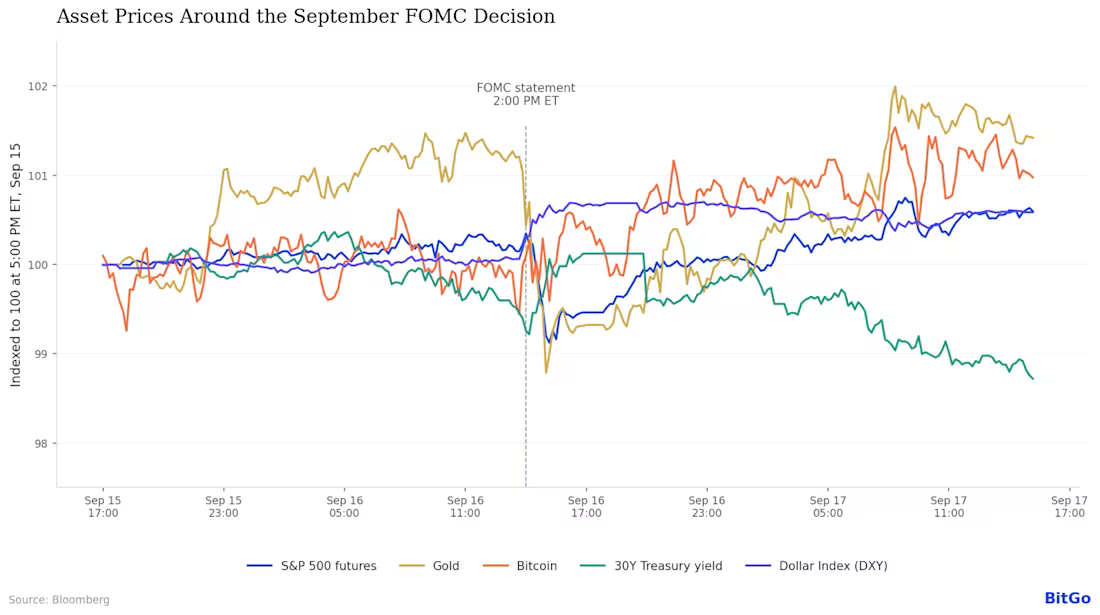
Immediately after the announcement of the Fed’s rate increase on 16 September, BTC briefly fell toward $75,000 before swiftly recovering into the $76,000 to $76,700 zone, fully absorbing the policy shock. It then rallied above $85,000 over the following days, fully reversing its initial decline. Other risk assets recovered only modestly during the following week, leaving BTC as the only risk asset trading materially above its pre-announcement level.
This decoupling marks a clear departure from prior policy tightening cycles, where BTC traded as a high-beta risk asset correlating directly with equities.
While the rate increase-inspired move is behind us, its effects may continue to follow into the October FOMC meeting, where the odds of another increase have risen to over 65 percent from under 15 percent two weeks ago.
It is notable that BTC’s breakout above its previous $81,300 range highs was accompanied by increased leveraged positioning, but this was unwound during the 23 September pullback.
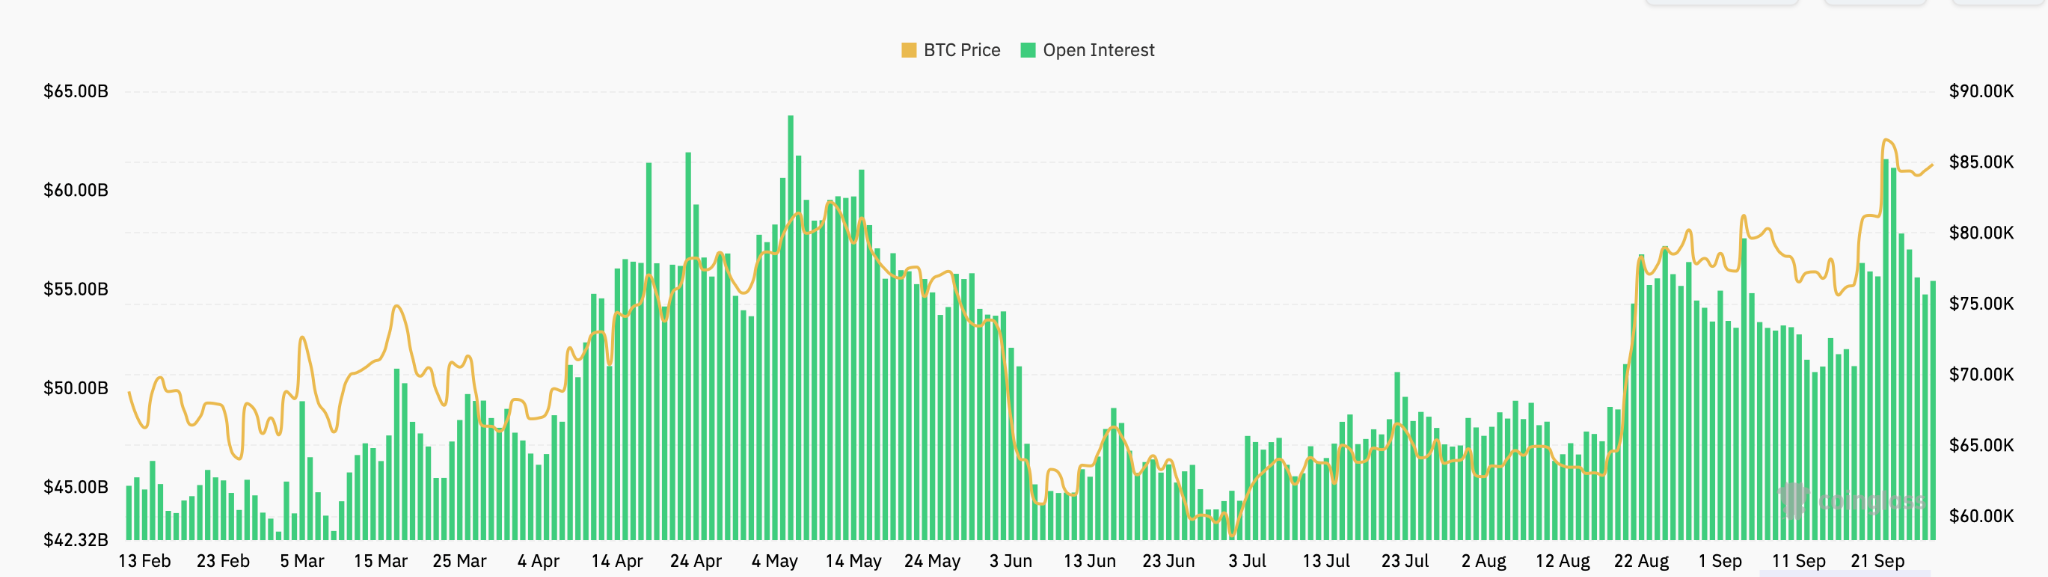
Aggregate open interest (OI) reached a multi-month high on 23 September at $61.57 billion, before dropping 6.6 percent on the same day. Since then, OI has fallen more than 10 percent, dropping below the $55 billion level which it held before the range breakout. Total liquidations reached $581 million, with long positions accounting for $438 million of the total. The initial short squeeze on 21 September, followed by the 23 September pullback, effectively reset leveraged positioning on both sides within three days.
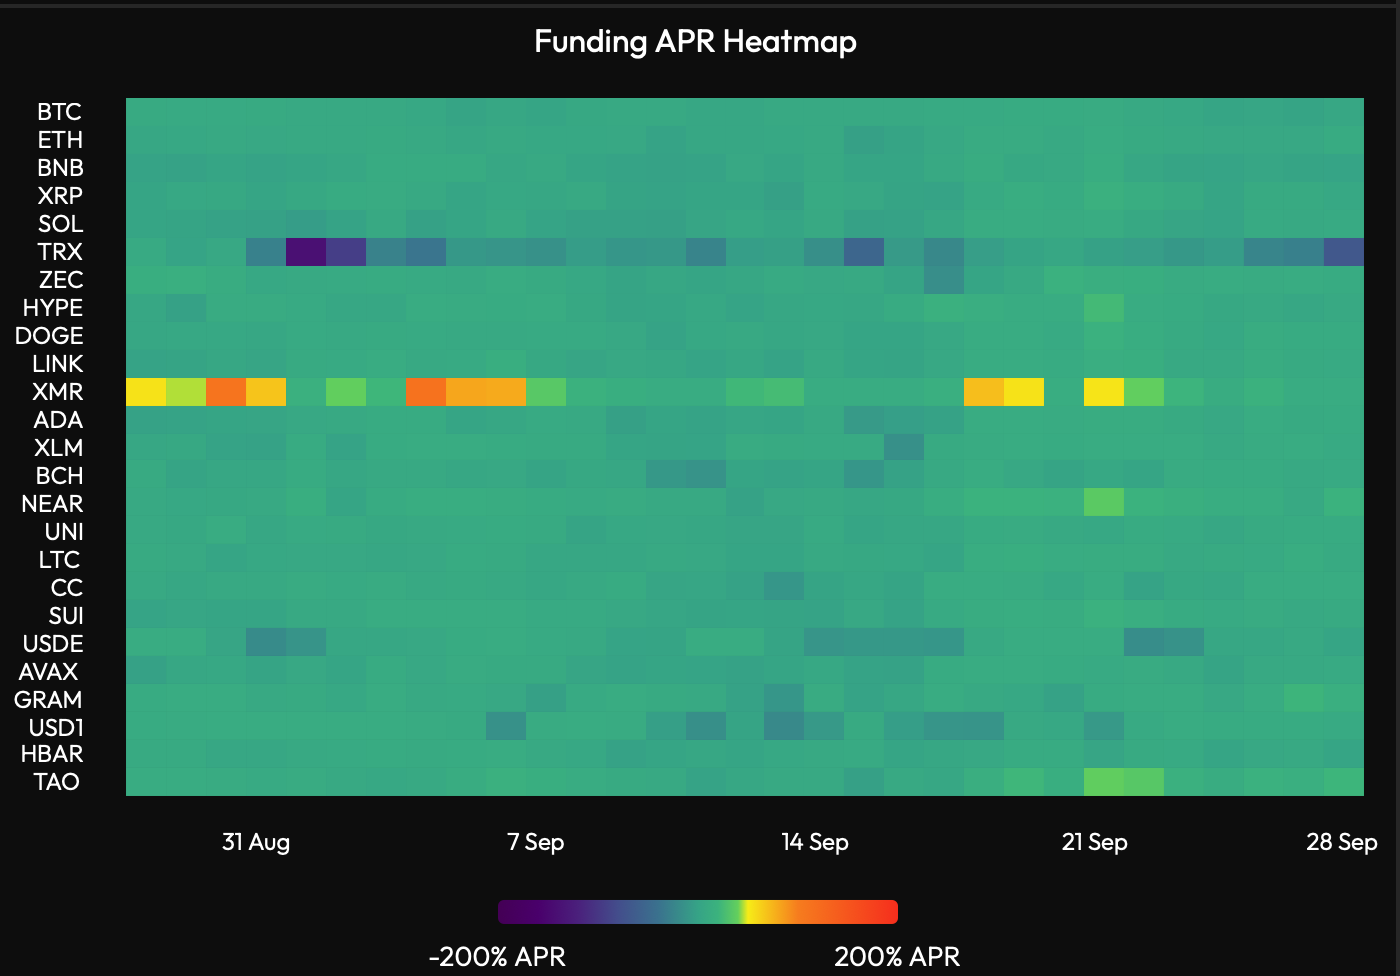
Metrics for perpetual trading pairs have returned to moderate levels, with futures basis and funding rates signaling controlled optimism that is common for uptrends of the nature we are seeing, rather than any over-extended leverage. Bitfinex margin metrics reflect a similar picture: total margin longs edged down slightly from 90,639 BTC to 90,408 BTC through a $4,000 price drop as price consolidated, representing a minor 0.25 percent contraction.
BTC’s resilience following the rate increase, muted reaction to the Clarity Act’s legislative impasse and price stability, despite falling open interest, suggest that monetary-tightening and order-flow headwinds are largely priced in. The failure to extend lower across these adverse catalysts points to robust underlying demand — a stronger bullish signal than any single market metric.
BTC’s Roadmap Moving Forward
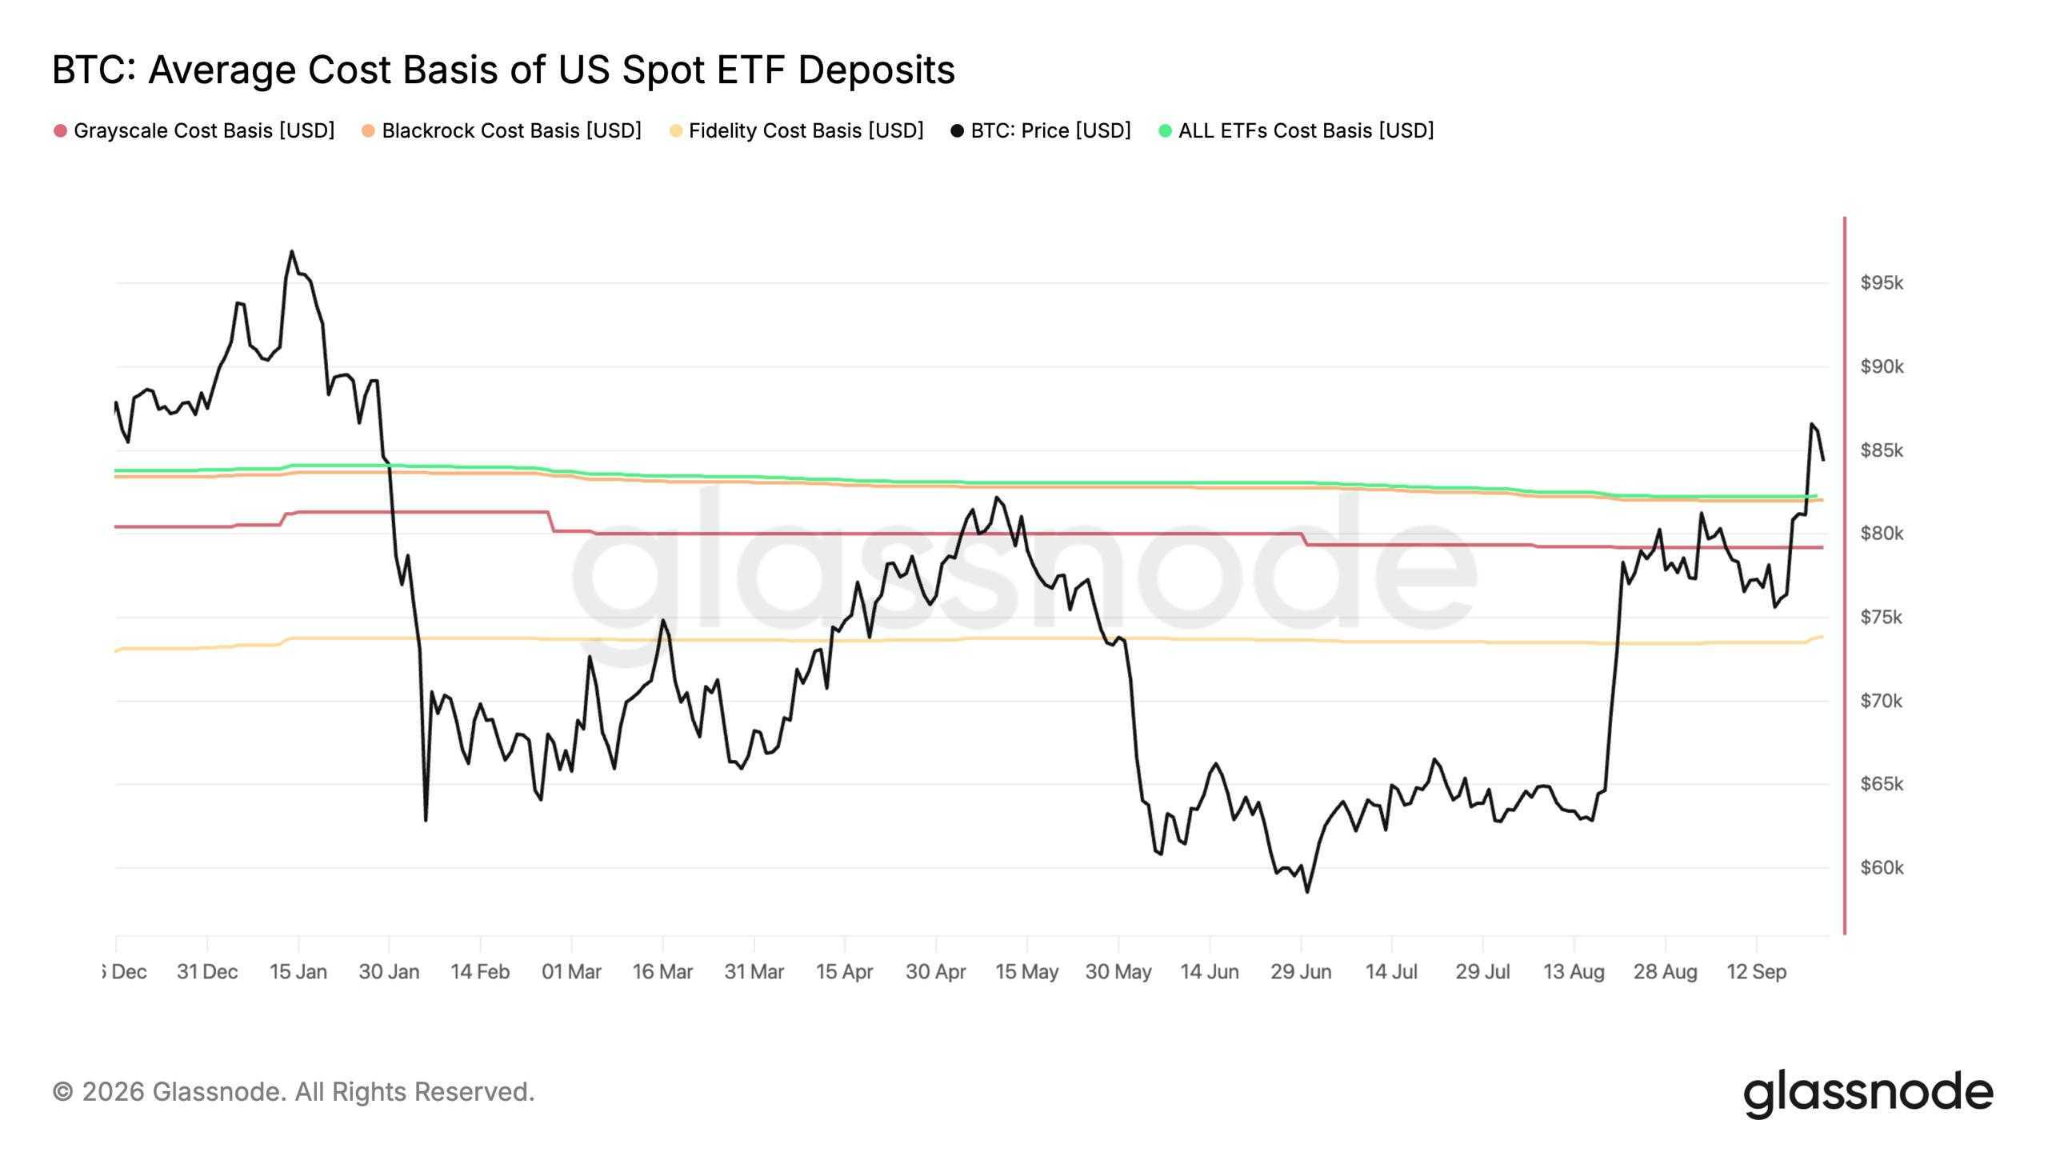
In the initial breakout in mid-August (triggered by the announcement of extended long bond buybacks by the US Treasury), the debate for bitcoin was whether the rally was anything more than a short squeeze. That question has been settled: bitcoin is trading above every cost basis that capped it this year. That includes the $81,722 average entry of US spot ETF holders, which crossed on 21 September for the first time since January. The question for Q4 is how far the move can extend. The answer will depend on whether the buyers who drove the rally continue to buy above their own cost. This behaviour has been common historically for ETF buyers and corporate treasury accumulators such as Strategy.
The demand side answered convincingly this week. US spot Bitcoin ETFs took in $2.38 billion, the largest weekly inflow since the week ending 10 October 2025, enough to turn 2026 net flows positive after standing at minus $5.7 billion in mid-July.
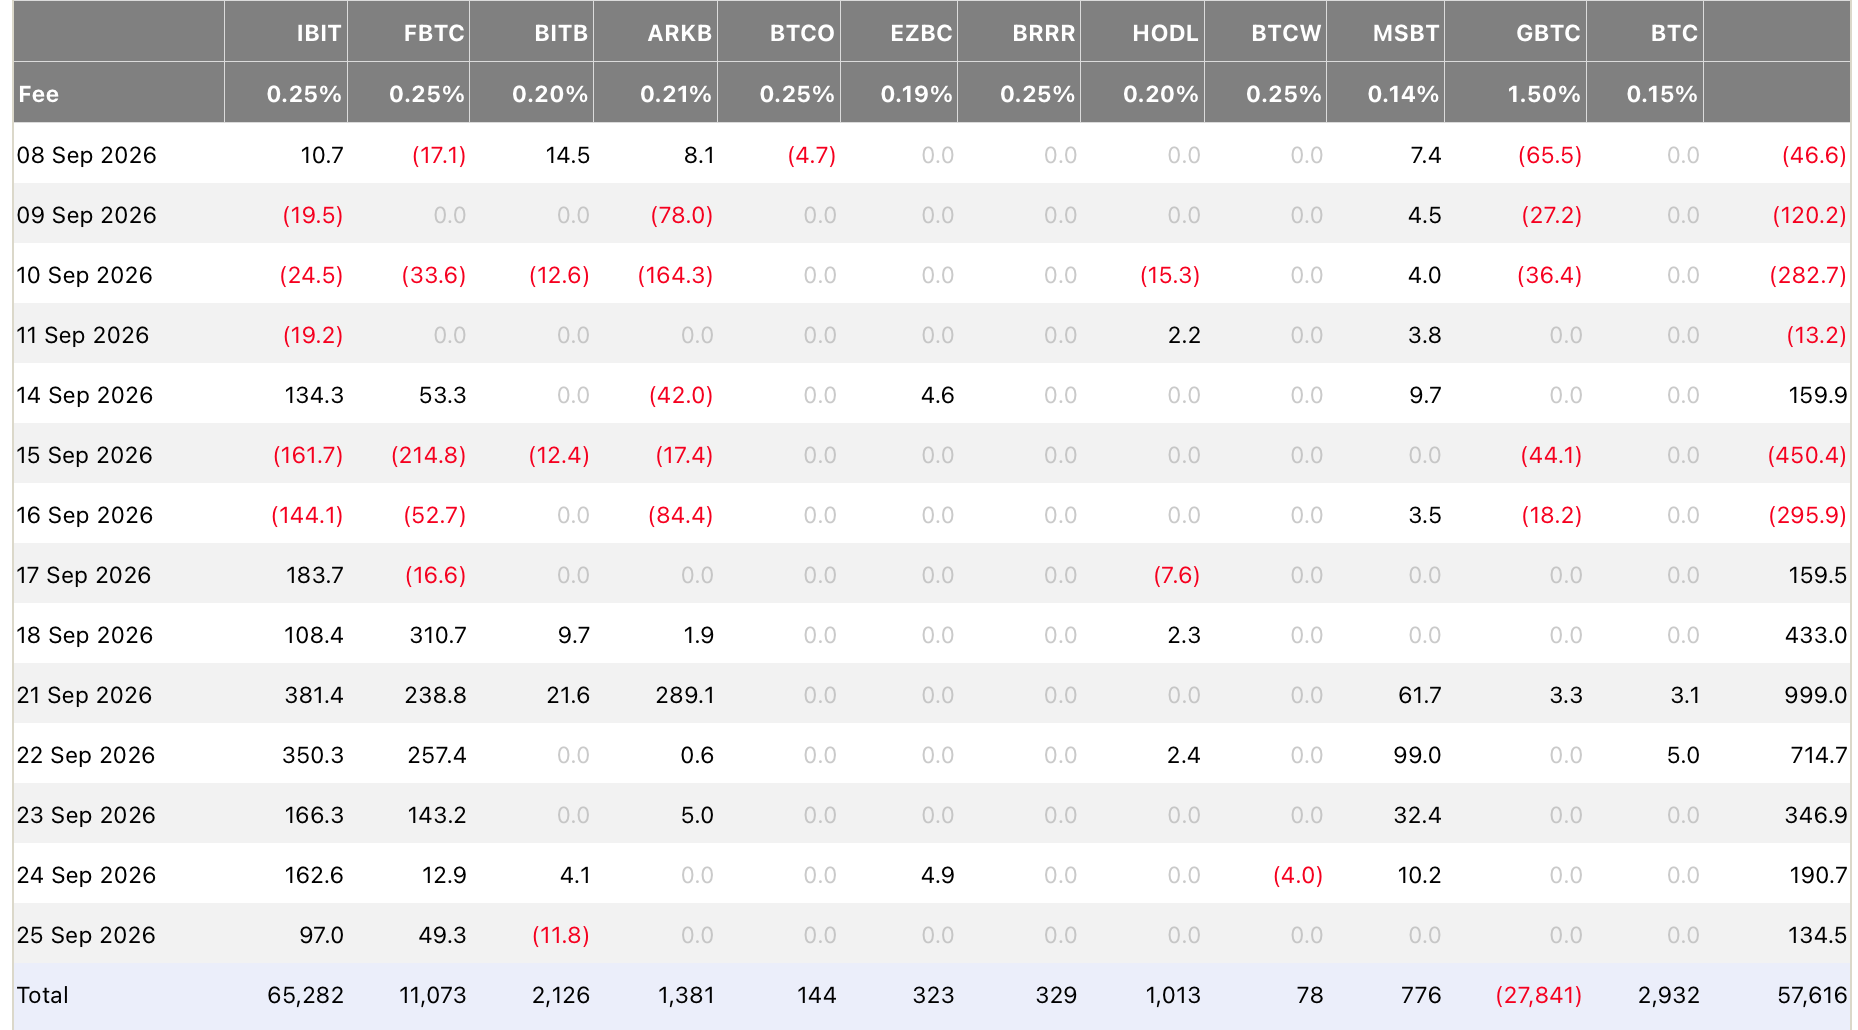
ETFs absorbed roughly 27,800 BTC over the week, equivalent to two months of new issuance. Commodity Futures Trading Commission (CTFC) data on Chicago Mercantile Exchange (CME) positioning shows leveraged funds hedging at most 15 percent of it, indicating directional demand rather than basis-trade money. Daily inflows fell from $999 million on Monday to $134.5 million on Friday, and the Coinbase Premium Index stayed negative throughout, suggesting that US spot buyers were not aggressively taking liquidity. Whether inflows stay positive now that the squeeze has faded is the key signal.
Corporate demand also continued. Strategy acquired 1,665 BTC for approximately $142.7 million between 21 and 27 September, at an average price of $85,681. This marked its second consecutive week of purchases, confirming that the largest corporate buyer continued accumulating above its cost basis.
The on-chain data gives the roadmap its levels. The largest cluster of long-term holder supply sits between $84,000 and $85,000. This is where this week’s buying settled and where the next correction will be decided.
The first major resistance is the mean Market Value to Realised Value (MVRV) price at $96,700, which is the realised price multiplied by bitcoin’s long-run average. It marks the point at which the average holder’s profit returns to its historical norm. Buyers from one to two years ago break even close to the same level, so overhead supply thickens there.
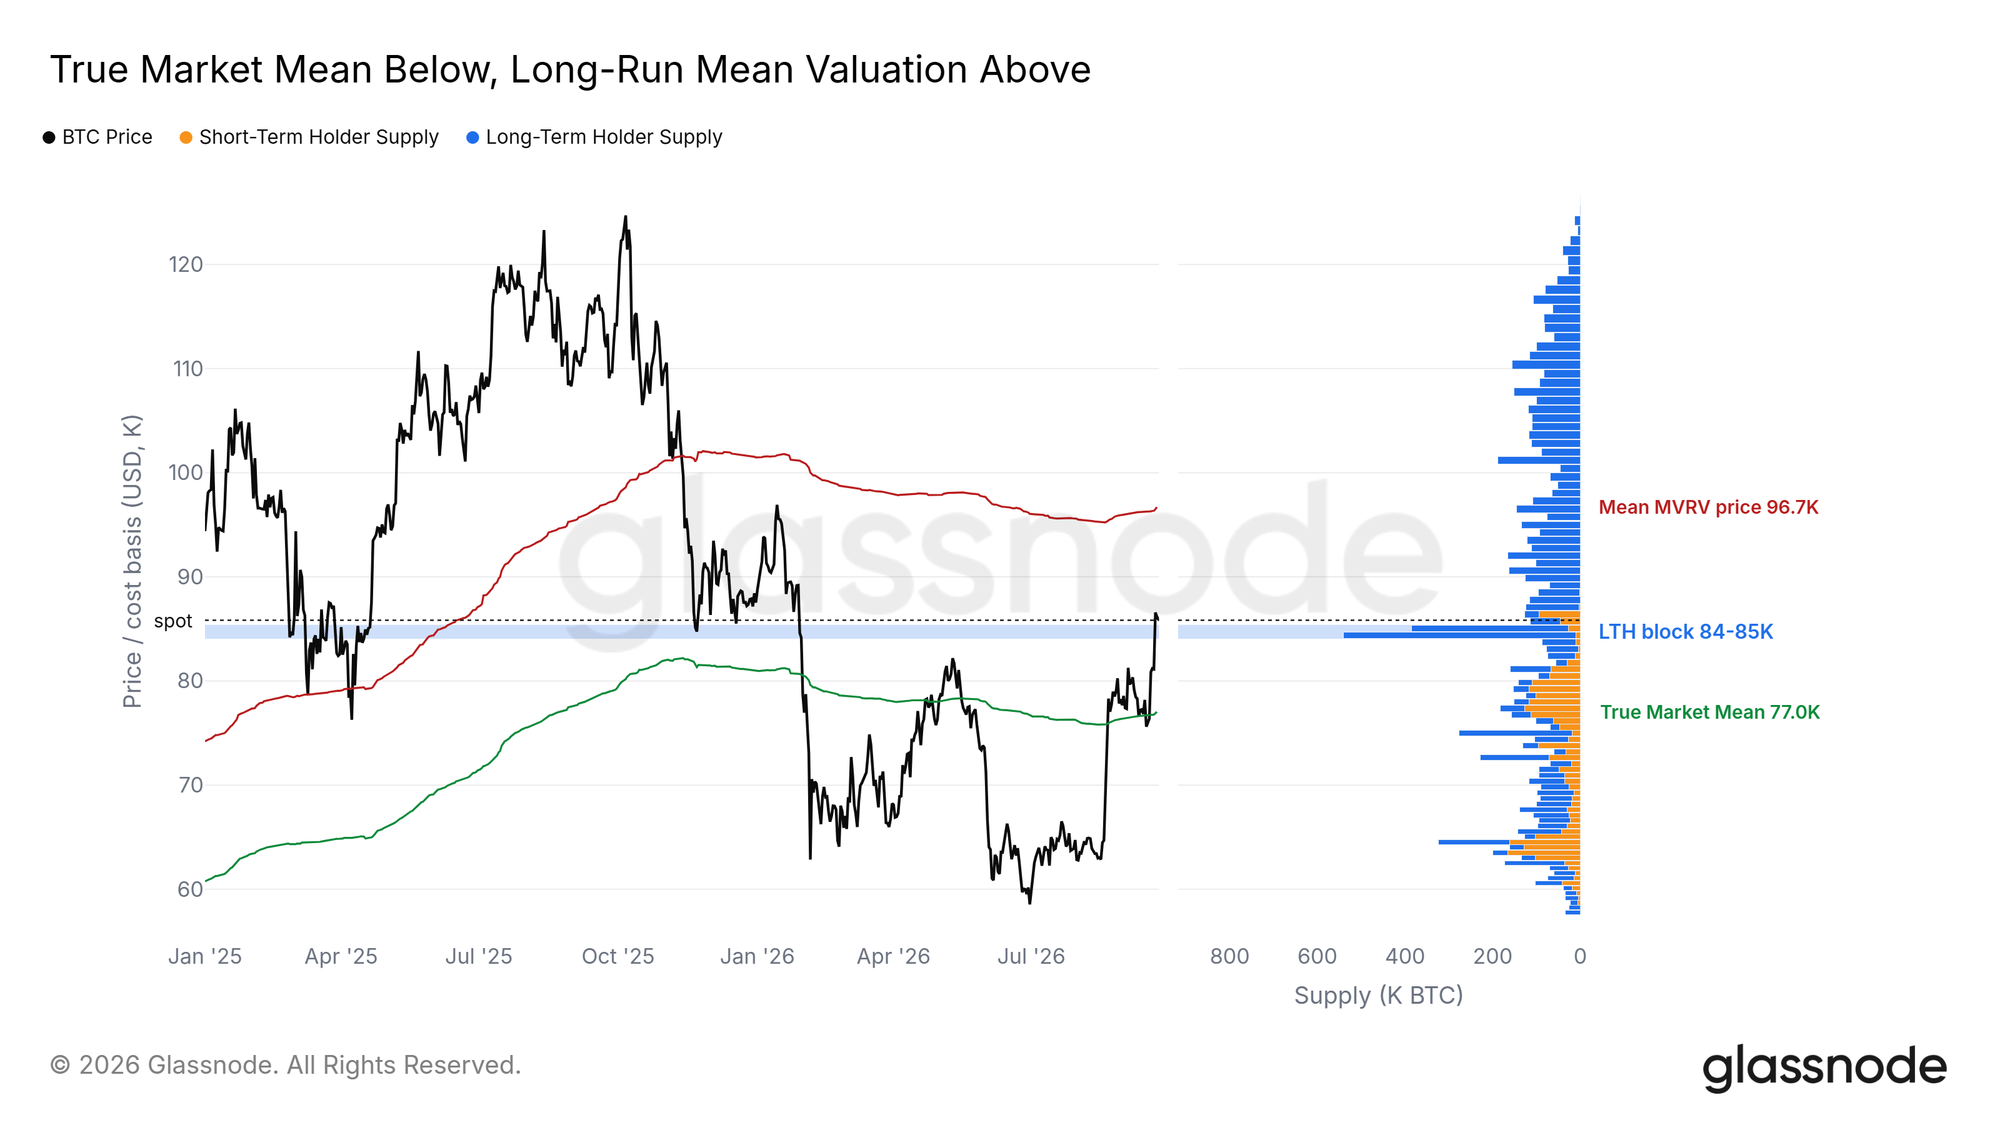
Below, the True Market Mean at $77,000 remains the main support and the level that separates a consolidation from a failed recovery. BTC holding above $84,000 keeps the path to $96,700 open. A drop back into the former range under $81,300 brings $77,000 into view.
Catalysts and Risks
Fuel Supply Constraints are Sustaining Goods Inflation
The average US on-highway diesel price reached $6.529 per gallon on 21 September, up $0.244 in a week and $2.780 from a year earlier. Diesel prices are a key component for freight costs and are part of the delivered cost of almost every good. The increase reflects a shortage of supply, rather than strong demand. The US Energy Information Administration (EIA)’s measure of demand for diesel and heating oil averaged 3.63 million barrels per day in the four weeks to 18 September against 3.62 million a year earlier.
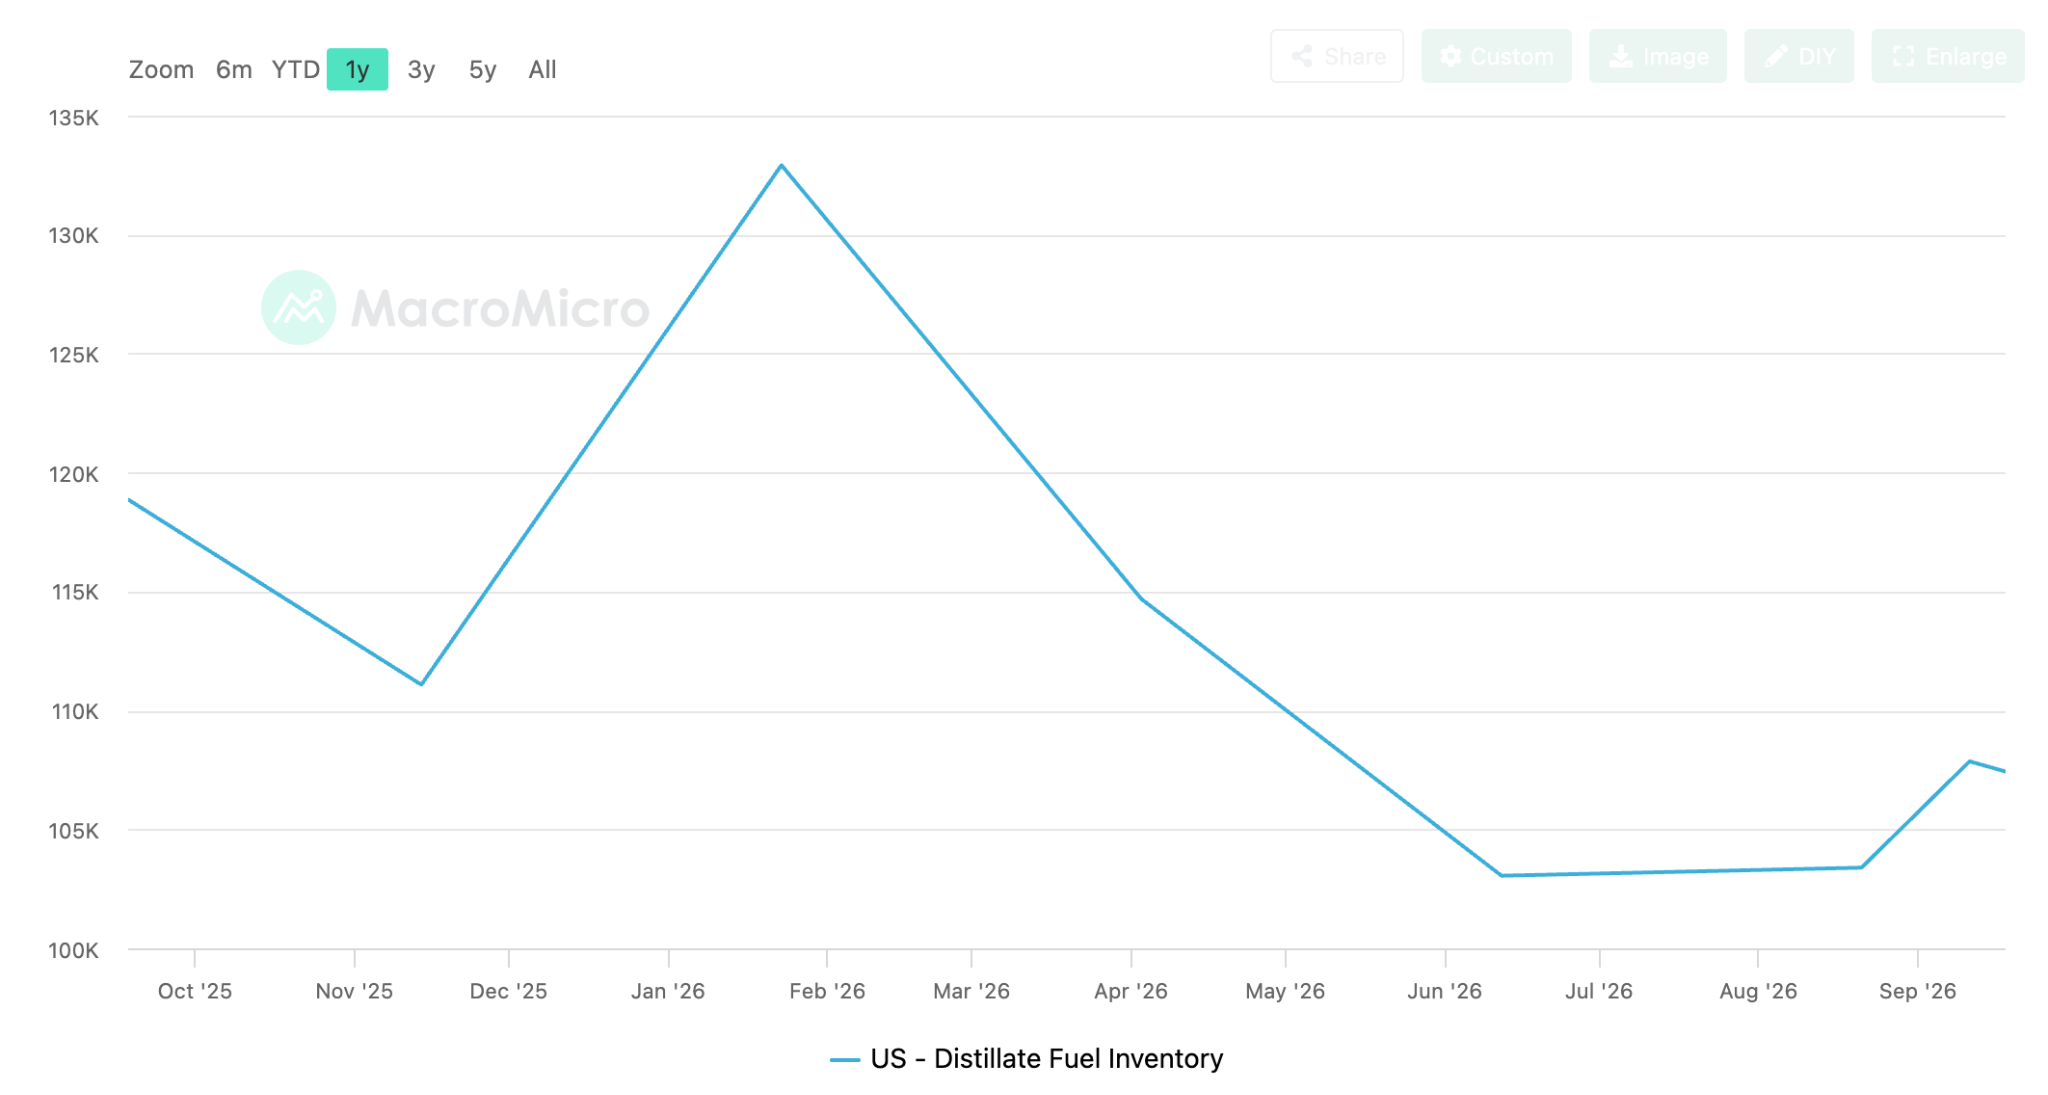
The forward risk sits in the buffer. Inventories of 107.4 million barrels sat about 12 percent below the five-year average and refineries averaged 96.6 percent of operable capacity over the same four weeks, slipping to 94.0 percent in the latest week. With stocks thin and refineries running near full capacity, any surge in demand will show up directly in the price.
Higher interest rates can reduce demand, but they cannot directly restore disrupted diesel supplies. Although US distillate production, which includes diesel, averaged 5.215 million barrels a day over the past four weeks against domestic demand of 3.636 million, overseas buyers compete for that fuel, keeping US prices exposed to global shortages. A 90-day export ban could initially keep more fuel at home and ease domestic prices, but Energy Secretary Chris Wright ruled out a blanket ban on 23 September. Restricting exports could also weaken refinery profits and encourage production cuts, potentially reducing the initial benefit.
For crypto markets, the significance is that fuel-driven inflation gives the Fed less room to ease policy. A cost that enters prices through freight rather than demand cannot be lowered by a policy rate, so it holds inflation above target.
Consumers are already beginning to price in the persistence of higher costs, with the University of Michigan’s final September survey putting long-run inflation expectations at 3.4 percent, ending three consecutive months at 3.3 percent. Expectations at that level will be a significant impediment to the FOMC easing early.
If the Fed keeps rates high because of fuel costs it cannot fix, the real return on safer assets stays attractive. That cuts against bitcoin twice: investors have less reason to take on its risk when Treasuries pay them to wait, and tighter financial conditions slow the ETF and corporate treasury buying that has carried the move. Without that demand, bitcoin has less support to push through the levels where existing holders sell to recover their cost.

Higher Real Yields Are Landing On Housing, Not On Fuel
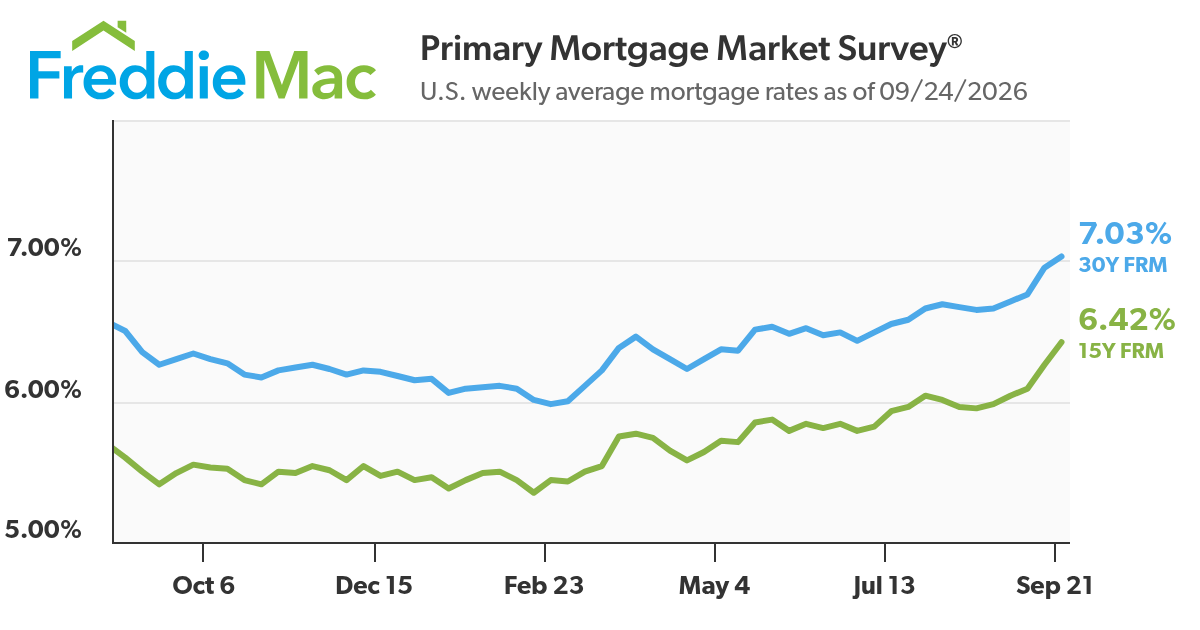
The tightening in rates is being felt more acutely on the borrowing side of the economy, rather than in transport costs. The 30-year fixed mortgage rate, the rate at which most US households borrow to buy a home, rose to 7.03 percent in Freddie Mac’s 24 September survey from 6.3 percent a year earlier, which adds about $193 to the monthly payment on a $400,000 loan. Existing home sales fell to a 3.98 million annual rate in August, the lowest of 2026, while the median existing price held at $429,100. Builders cut prices instead, with the median new-home price down 5.8 percent on the year at $393,700.
A mortgage above 7 percent keeps existing owners in the loans they have and stops home equity being refinanced into spendable cash, so the channel that would carry household liquidity into risk assets stays shut. The longer fuel keeps prices elevated, the more of the adjustment housing carries, and the longer that channel stays closed. The headwind weakens materially if the Freddie Mac 30-year rate holds below 6.75 percent for two consecutive weeks.

Outlook for the Week
Base Case
Our basis case is that Bitcoin consolidates between the $84,000 long-term holder cluster and the $87,722 yearly open into the monthly and quarterly close on 30 September. Spot demand, rather than prevailing financial conditions, is expected to determine how the range resolves. BTC has exhibited strength against macro headwinds and asymmetric strength during cross asset pullbacks. The leverage accumulated during the breakout to the high last week of $87,392 has largely been cleared. With perpetual positioning now close to neutral, the uptrend is healthier during previous recovery attempts, including in May.
The macro constraint remains unchanged. The Fed’s median projection still puts the policy rate at 4.1 percent by year-end, consistent with one more increase, and the 10-year real yield at 2.83 percent is further from the 2.5 percent level at which we would expect the headwind to ease. Today (28 September, 2026) the current low of $82,491, is the first test of that base and should be read against how the ETF flows play out later this week rather than in isolation.
Strategy’s latest purchase of 1,665 BTC confirms a second week of corporate accumulation, leaving ETF flows as the outstanding demand test. If inflows remain positive, the 1.15 million BTC accumulated between $83,000 and $86,500 becomes the floor of the next range rather than the top of a recovery. The yearly $87,722 open will then be the next test. If either corporate buying or ETF inflows stalls, price has little cost basis to lean on until the $77,000 True Market Mean.

What Would Confirm It
Price holding above $84,000 into quarter-end, US spot ETF inflows remaining positive even at Friday’s slower pace and the corporate cohort continuing to accumulate above its $80,500 cost basis would confirm that demand remains sufficient to support the range.
August core PCE of 0.3 percent or more, together with a 10-year real yield at or above 2.8 percent, would confirm that the macro constraint remains in place and that spot demand must continue to carry the move.
What Would Invalidate It
A sustained break above $87,722 accompanied by accelerating ETF inflows would invalidate the range to the upside and open the path to the $96,700 mean-MVRV price. A close back inside the former range under $81,300 with ETF flows turning negative would invalidate it to the downside, bringing the $77,000 True Market Mean into view. On the macro side, August core PCE at 0.2 percent or less on the month, or a 10-year real yield that falls back below 2.5 percent, would remove the constraint underpinning the base case and improve BTC’s prospects of an upside break

What To Watch
August personal income and outlays, including core PCE, and the third estimate of Q2 GDP, on 30 September. The weekly EIA diesel price on Monday and the Freddie Mac mortgage survey on Thursday.
