

Issue #205:
BTC Pulls Back As Rate Cuts Fade
Bitcoin Loses Momentum On Higher Rate Expectations
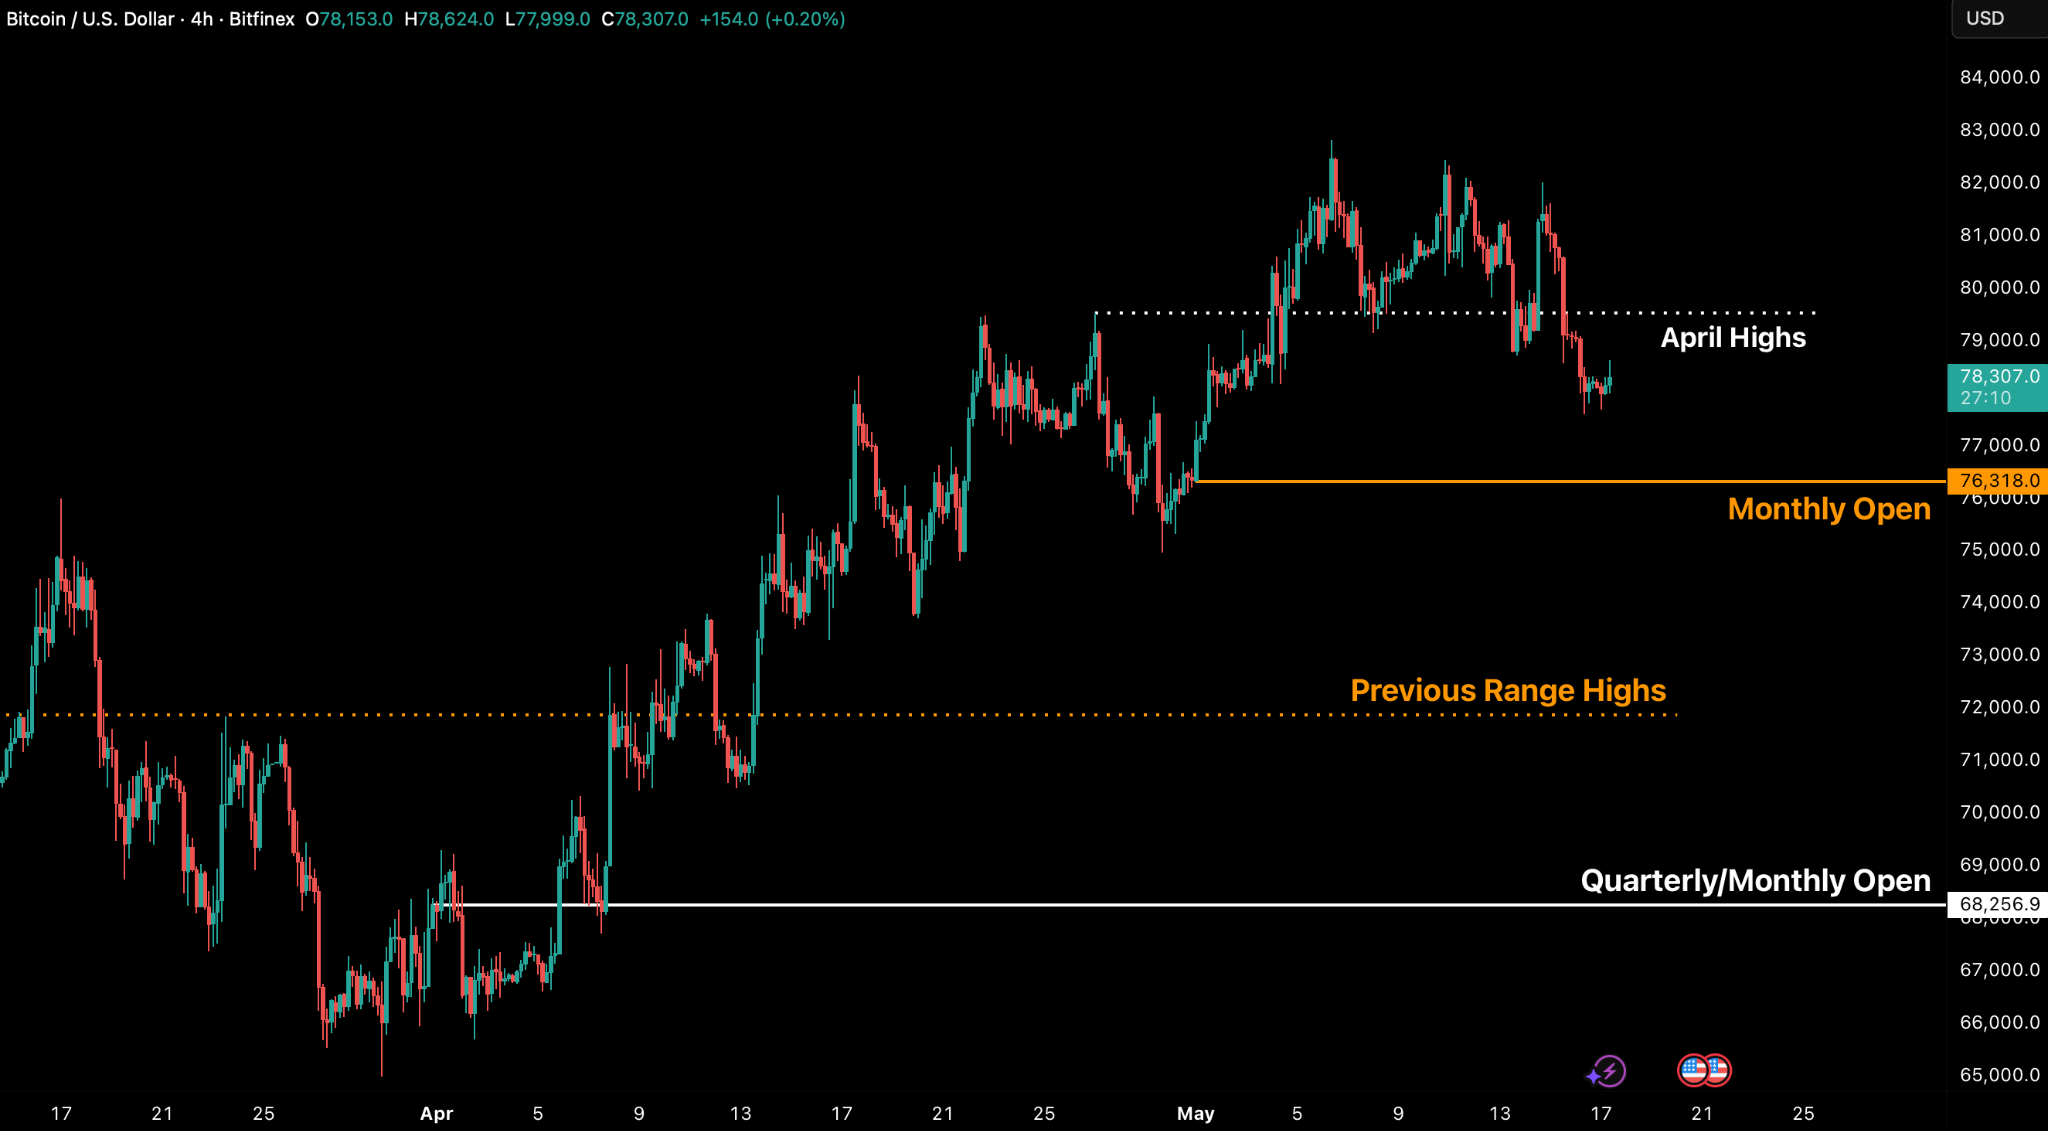
Bitcoin’s rally is starting to lose momentum as weakening institutional demand and mounting macro pressure leave the market increasingly vulnerable to further downside. After opening the week at $82,160, Bitcoin was rejected once again from the $80,000-$83,000 resistance zone and closed 4.6 percent lower, with geopolitical tensions and rising oil prices shifting market sentiment sharply risk-off. BTC is now testing levels below $78,000, close to the monthly open, a key area that could determine whether the broader recovery structure remains intact.
The decline comes as both spot Bitcoin ETF flows and yield-bearing products such as STRC continue to weaken simultaneously, removing two major sources of marginal demand. US spot Bitcoin ETFs recorded nearly $1 billion in net outflows for the week, ending a six-week inflow streak, while even BlackRock’s IBIT joined the broader institutional retreat amid renewed fears of a “higher-for-longer” interest rate environment.
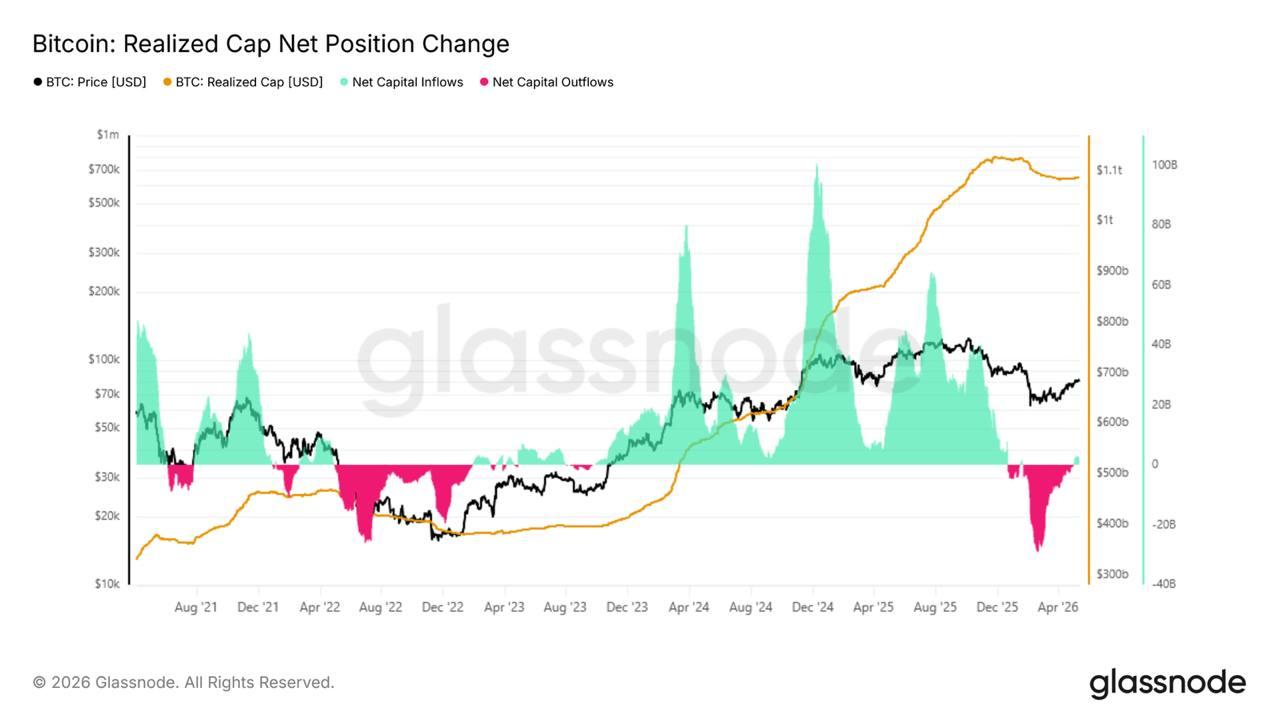
On-chain data also points to fading momentum beneath the surface. While monthly capital inflows remain positive at $2.8 billion, the pace remains well below the $10 billion levels typically associated with strong bull market continuation phases. The divergence suggests that, despite the earlier recovery toward $82,000, institutional conviction remains insufficient to absorb ongoing macroeconomic shocks and rate volatility.

BTC/USD 4H Chart. (Source: Bitfinex)
The US macroeconomic backdrop has shifted decisively toward a higher-for-longer inflation environment, as April CPI data showed inflation accelerating to 3.8 percent year-over-year, driven not only by energy prices but also by persistently elevated services inflation.
Real wage growth has turned negative, long-term Treasury yields have climbed to multi-year highs, and markets that previously expected Federal Reserve rate cuts are now increasingly pricing in the possibility of renewed tightening later this year. At the centre of this inflation reset is the ongoing Strait of Hormuz disruption, which has severely constrained global oil flows and pushed Brent crude above $100 per barrel, feeding directly into higher fuel, freight, and consumer prices across the economy.
Against this increasingly fragile macro backdrop, the cryptocurrency sector continues to experience both regulatory progress and institutional expansion. The US Senate Banking Committee advanced the landmark CLARITY Act, a major step toward establishing clearer regulatory boundaries between the SEC and CFTC and creating a more defined framework for digital assets in the United States. Meanwhile, Bitwise launched its spot Hyperliquid ETF with integrated staking rewards, reflecting growing institutional appetite for more sophisticated crypto investment products beyond BTC and ETH.
However, macroeconomic pressures are beginning to weigh on broader digital asset markets, with US spot Bitcoin ETFs recording approximately $1 billion in weekly outflows as investors reduced exposure to risk assets amid rising inflation expectations and higher Treasury yields.

Market Signals
A Market Dependent On Catalysts
Bitcoin opened the week at $82,160 on Monday and was immediately rejected off that technical zone for the third consecutive time, moving 5.6 percent lower from the open. Prices between $80,000 and $83,000 were the region where the Short-Term Holder Realised Price and True Market Mean had been concentrated for an extended period of time before the breakout above Q1’s range highs.
Price declined below but recovered shortly to move above the $80,000 level through the April CPI print on Wednesday, 13 May. It then settled lower on Thursday, 14 May after fresh US strikes on Iran lifted Brent crude past $105 and reset the macro narrative. Net of the week, BTC closed 4.6 percent lower in line with our expectations of a potential correction on the horizon given the dwindling STRC flows and the fluctuating cyclical ETF flows that have shown up recently.
By the time of publication on 18 May, BTC price was at $76,887, slightly over the Monthly Open of $76,318. Until the STHRP and TMM levels referenced above are reclaimed, we expect price to move within the $72,000 to $80,000 range, with the previous range highs acting as support and the cost-basis levels acting as resistance.
Our previous analysis identified early instability in the spot ETF demand channel, compounded by a strategic pivot at MicroStrategy. During the 5 May earnings call, Chairman Michael Saylor signalled potential BTC liquidations to fund dividend payments, removing a primary pillar of corporate treasury support.
The signal hierarchy has deteriorated. The two primary engines of marginal demand, the spot ETF complex and yield-bearing products like STRC, are now simultaneously under significant duress. This convergence of hostile macroeconomic conditions and a waning structural buyer base has left the market with its lowest level of liquidity ammunition since early February.
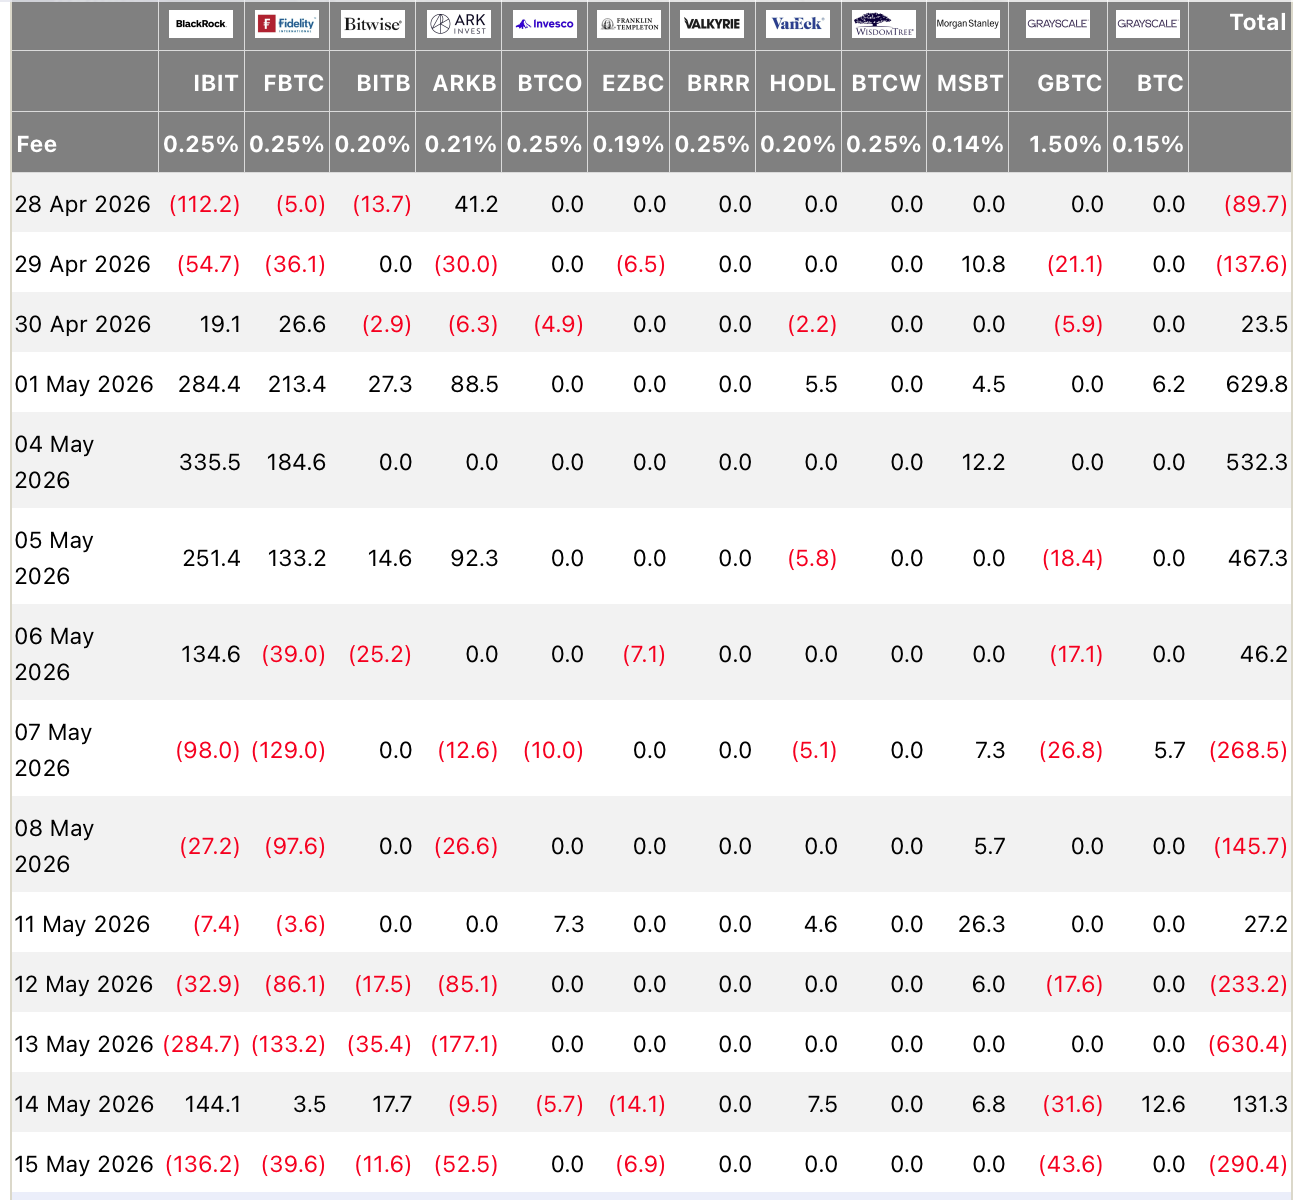
The quantitative impact of this shift was underscored by a $994.5 million net outflow for the week, decisively terminating a six-week inflow streak and marking the most severe capital flight in months. A single-session liquidation of $630 million on 13 May represented a three-month high in redemptions, with the exodus spanning the institutional spectrum.
Even BlackRock’s IBIT, which recently established a five-week record for daily inflows, succumbed to the broader trend, joining Fidelity and Bitwise in a synchronised retreat as the macro narrative pivoted toward a “higher-for-longer” rate environment.
As market sentiment transitions from acute fear toward persistent uncertainty, the validity of the current recovery hinges on objective measures of net capital inflows. The Realised Cap 30-Day Net Position Change, which quantifies the monthly fluctuation in on-chain capital, serves as the primary barometer for this structural support. In the wake of the recent ascent to $82,000, this metric reached a positive $2.8 billion per month, providing a basis for recent constructive momentum. A quantitative divergence emerges, though, when compared with the 2023–2025 bull cycle, where high-conviction rallies were characterised by rapid acceleration from a $2 billion baseline toward the $10 billion per month threshold.
The current $2.8 billion reading remains significantly shy of this historical benchmark, representing a substantial shortfall in aggressive capital commitment. This data-driven discrepancy suggests the recovery lacks the institutional velocity required to withstand a “higher-for-longer” macroeconomic regime, leaving the market vulnerable to exogenous shocks and interest rate volatility.

General Macro Update
Inflation Resets Higher As The Fed Loses Its Cut Path
April CPI rose 3.8 percent year-over-year, driven by energy but reinforced by services inflation that is decelerating far more slowly than the Federal Reserve has been expecting. The combination of hotter prints, an oil supply shock tied to the Strait of Hormuz, and a sharp move higher in market-based inflation expectations has removed the case for rate cuts in the first half of 2026 and reintroduced rate hikes as a credible scenario into the second half. Growth remains positive, but the mix increasingly fits what some economists are describing as “stagflation lite”: continued expansion against inflation that refuses to settle back toward the Fed’s 2 percent target.
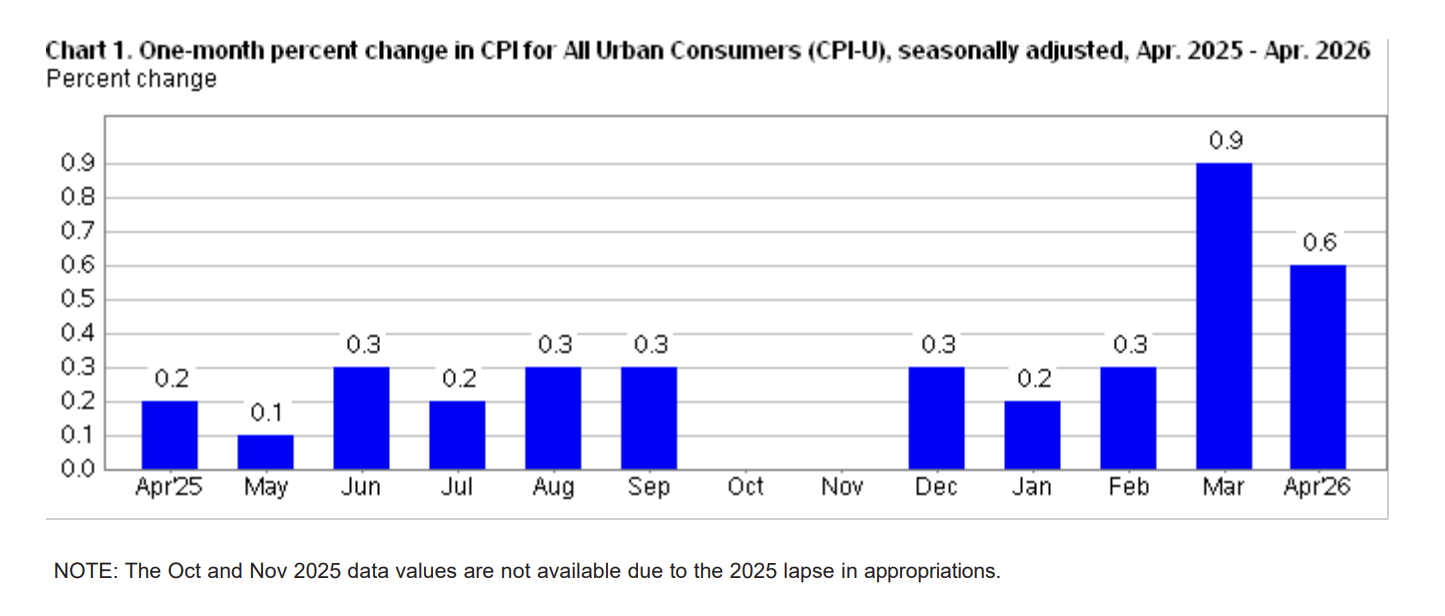

Headline CPI rose 0.6 percent month-over-month, following a 0.9 percent gain in March. Energy contributed the largest share at 3.8 percent month-over-month, with gasoline up 5.6 percent and food prices accelerating as higher fuel and freight costs filtered through supply chains. Core CPI rose 0.4 percent month-over-month and 2.8 percent year-over-year.
The more concerning detail lies in services inflation excluding energy, which rose 0.6 percent month-over-month and 3.4 percent annually. Shelter, transportation services, and apparel were the main drivers. Central banks typically look through energy-driven inflation because supply shocks are self-correcting, but they cannot look through demand-driven services inflation without losing credibility on the inflation mandate. This is why the services component matters more for policy than the headline number.
Real average hourly earnings have turned negative as headline CPI growth has overtaken nominal wage growth, which remains near 3.5 percent year-over-year. Sell-side forecasts for May CPI sit above 4 percent, with some scenarios placing year-end inflation closer to 4.5 percent if Brent crude remains near current levels. The implication is a real-income compression that begins to constrain household consumption in the second half of the year.
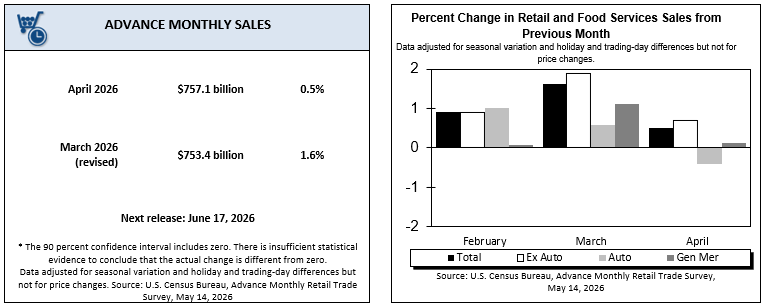
The April retail sales report showed underlying demand holding up better than the headline deceleration suggested, but with one important caveat: total sales rose 0.5 percent month-over-month after a 1.6 percent gain in March, with the largest single contributor being gasoline stations at +2.8 percent month-over-month, a price effect more than a volume effect.
Sales excluding autos and gasoline and the GDP control group both exceeded consensus forecast. Durable goods prices were flat to lower during the month, which is the strongest evidence that real spending volumes remain firm in non-energy categories.
The April print also contains a temporary lift from tax-refund disbursements tied to recent fiscal measures, which will fade by mid-summer. Combined with negative real wage growth and elevated gasoline prices, the underlying strength most likely reflects households accelerating non-energy purchases in anticipation of higher prices later in the year. Once that pull-forward unwinds, year-over-year comparisons deteriorate quickly.
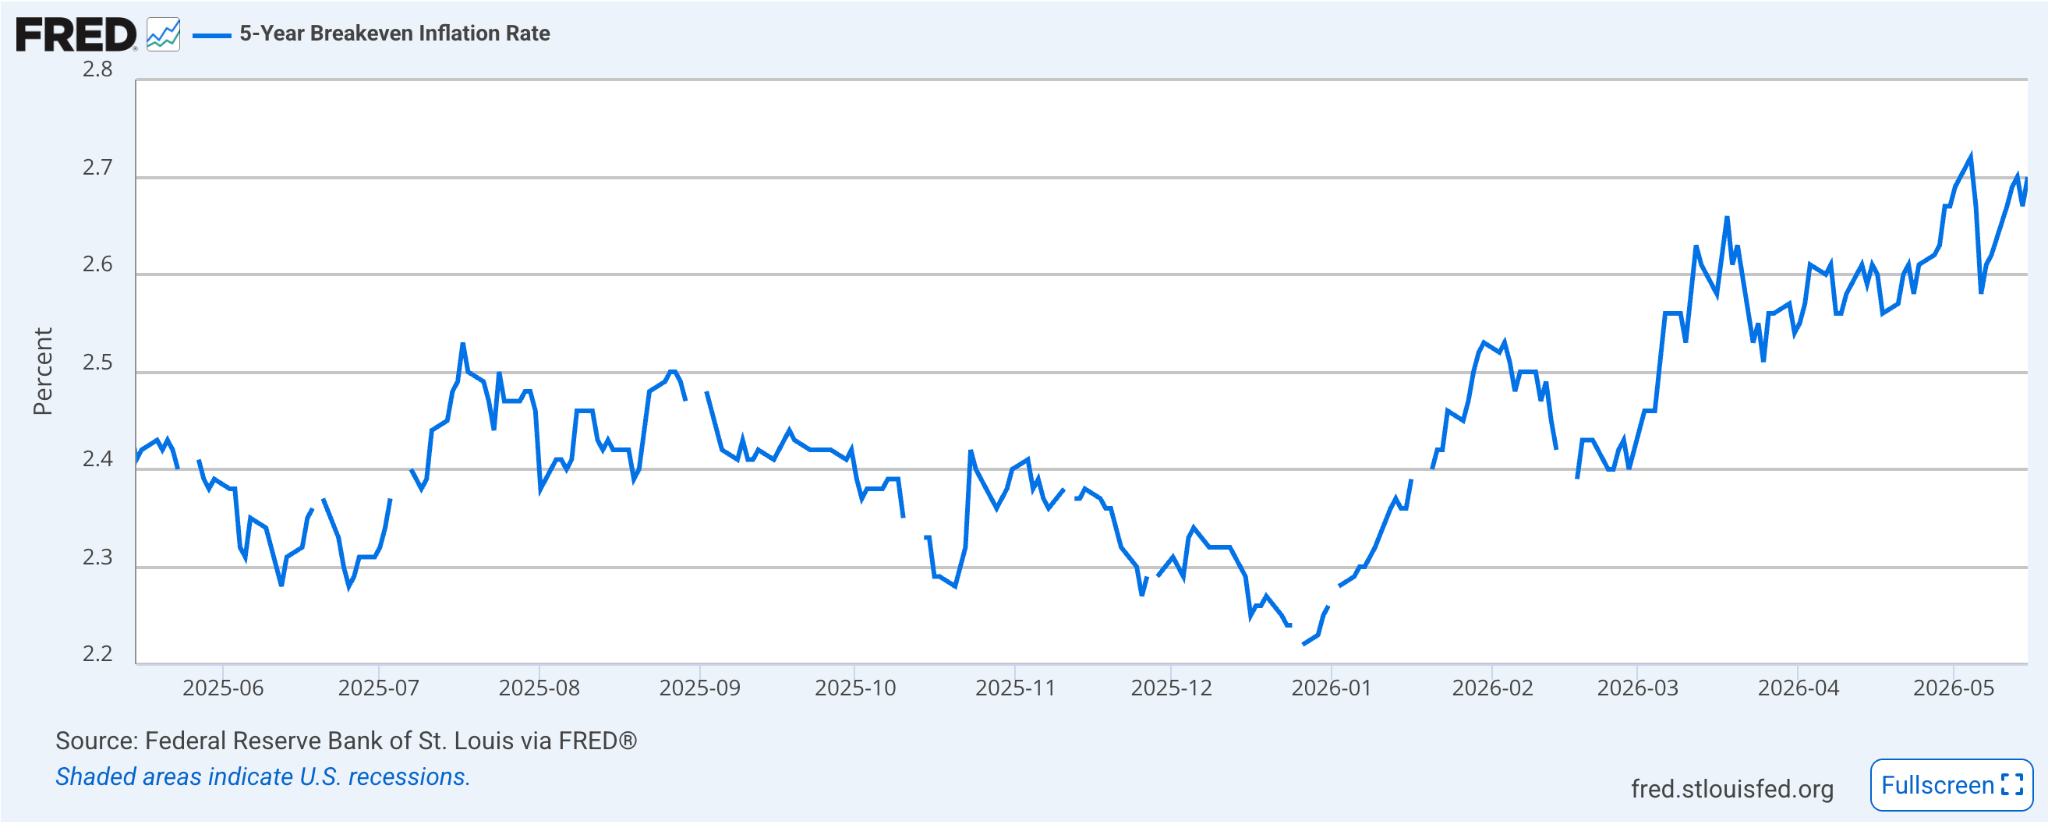
The bond market is no longer pricing further disinflation. Five-year breakeven inflation expectations have risen to 2.62 percent in May from approximately 2.45 percent in late February, with 10-year breakevens at 2.45 percent against a late-February level near 2.25 percent and 30-year breakevens following the same path.
The Federal Reserve has now missed its 2 percent inflation target for more than five consecutive years, and inflation expectations themselves, which Chair Powell defended through two prior policy cycles, are now resetting higher. Once households and businesses begin anchoring wage and contract decisions to a 2.5 to 3 percent inflation assumption, the cost of returning inflation to target rises significantly. That is the central reason the Federal Open Market Committee (FOMC) should remove its easing bias at the June meeting regardless of the May CPI print.
With rate cuts effectively priced out of the front end of the curve, the question shifts to whether an additional rate hike enters the official outlook in the second half of the year. If Brent crude remains near current levels and June core CPI rises another 0.3 to 0.4 percent month-over-month, the September FOMC meeting becomes a live policy event, with the resumption of the tightening cycle replacing the rate cut markets were pricing in February.
The April inflation print landed one day after Kevin Warsh was sworn in as Chair of the Federal Reserve. Warsh was elected with the closest Senate confirmation in modern history, following a 54-45 vote on 13 May.
The new Fed chair inherits a central bank that has missed its inflation target for five consecutive years, an inflation expectations curve that is no longer anchored at 2 percent, and a market that continues to interpret his prior commentary as dovish despite a data environment that no longer supports that reading. His immediate test is whether he can credibly hold without cutting at a moment when political pressure is moving in the opposite direction.
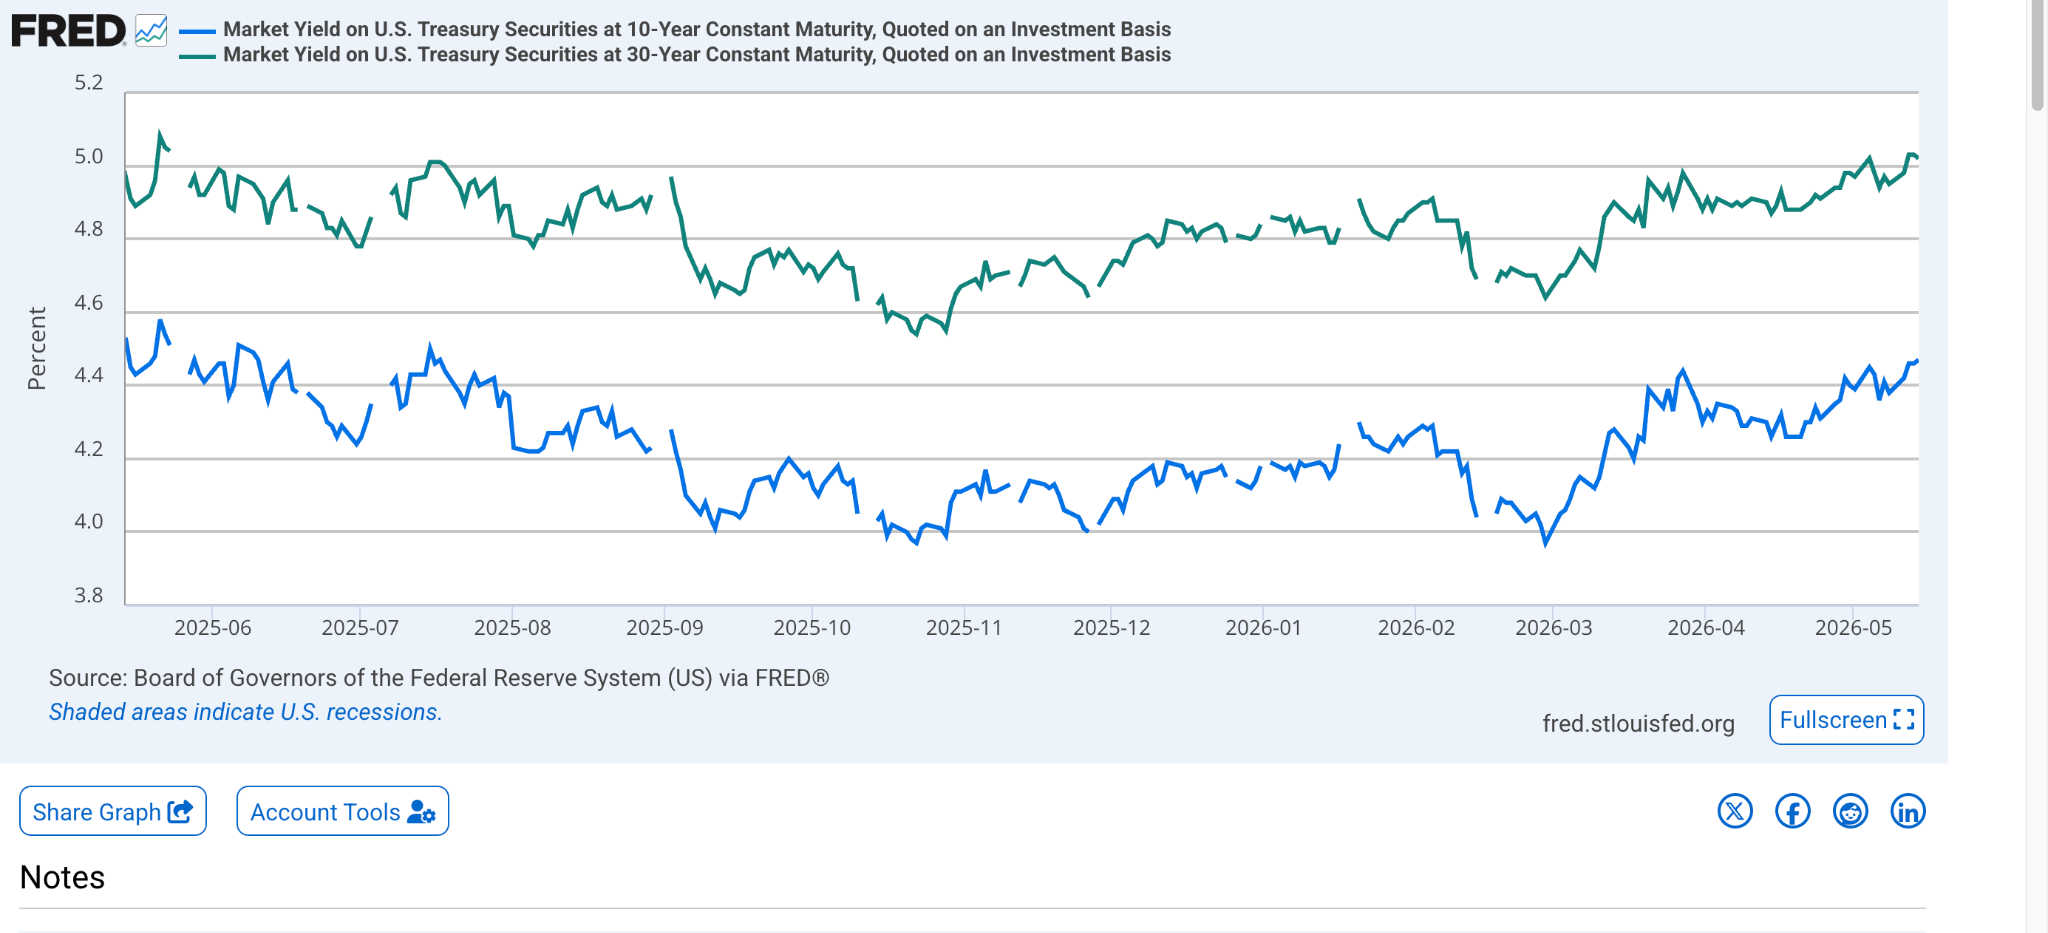
Long-end Treasury yields are repricing the inflation outlook rather than growth. The 10-year yield closed at 4.59 percent on 15 May, a one-year high, and the 30-year yield closed at 5.12 percent, the highest level since May 2025. The Treasury sold $25 billion of new 30-year bonds last week at 5.00 percent, the first auction to clear with a five-handle since 2007.
The move reflects a rebuild of the term premium rather than a change in growth expectations. The curve indicates that the market no longer expects the Federal Reserve to cut rates in the second half of 2026 and is increasingly unwilling to commit capital to a 2-handle inflation regime at any reasonable horizon.
Recession probability estimates remain near 30 percent, supported by continued capital expenditure in the technology sector, household balance sheets benefiting from equity gains, and the residual effects of fiscal stimulus. In this context, the more important question is whether the economy has entered a new inflation regime. An energy supply shock combined with persistent services inflation, negative real wage growth, and a bond market that no longer prices a return to 2 percent does not describe a transitory environment.
The base case for the second half of 2026 has shifted from rate cuts and a soft landing toward a Federal Reserve that must defend its inflation credibility against a market positioning for the opposite.

Hormuz At 79 Days: The Supply Shock Driving The Inflation Reset

The largest single-region oil supply shock in modern market history is now 79 days old, and the disruption shows no clear resolution path. Crude and refined product flows through the Strait of Hormuz collapsed from approximately 20 million barrels per day before the war to just over 2 million barrels per day in March, according to the International Energy Agency’s May Oil Market Report.
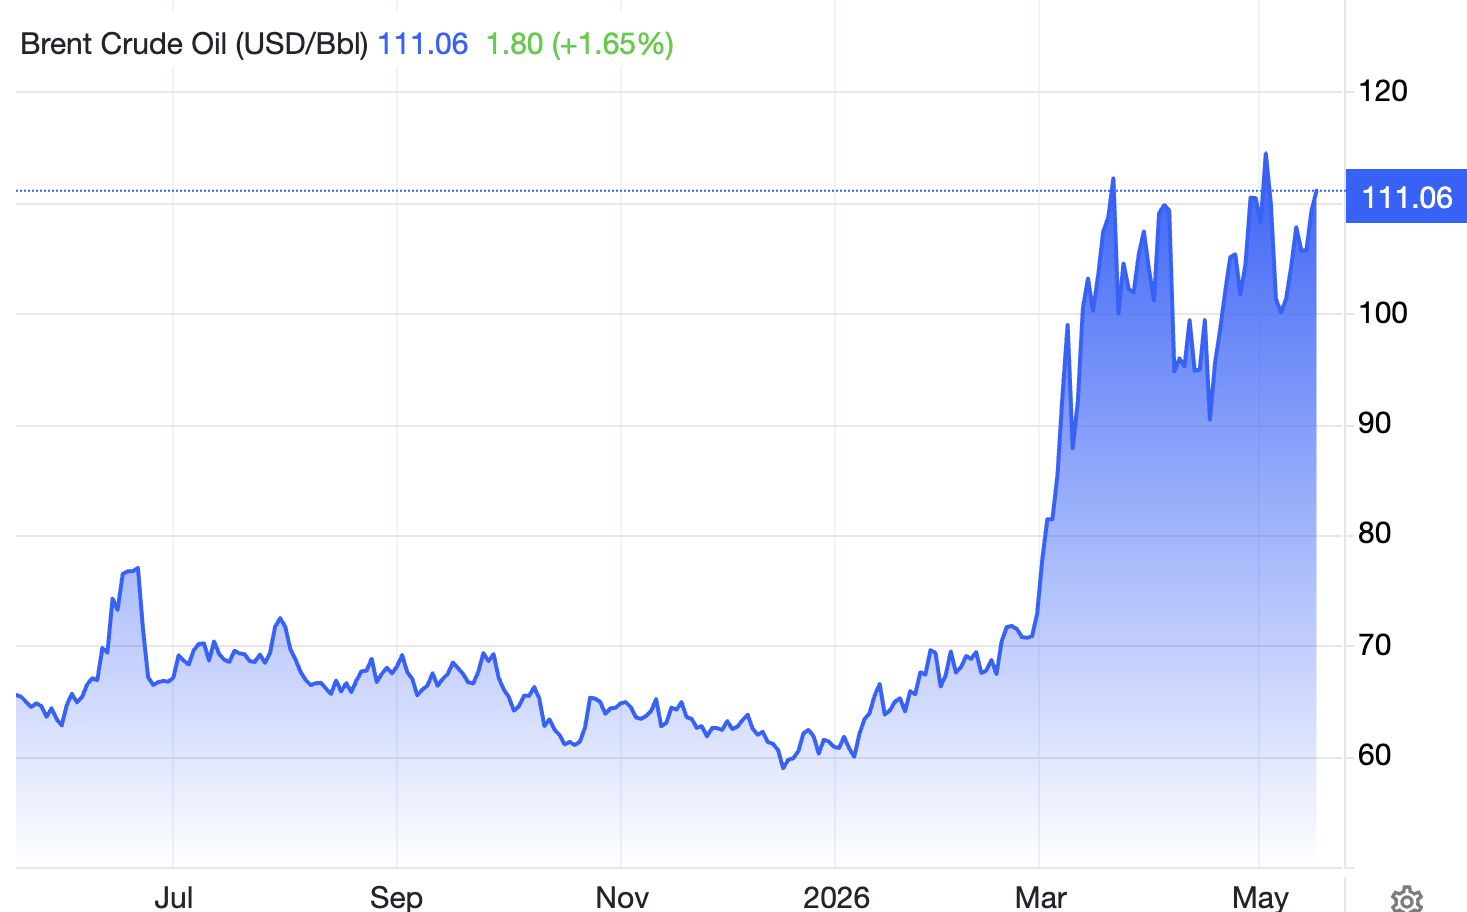
Brent crude reached a 2026 peak of $114.40 per barrel on 5 May and is trading near $106 in mid-May. The International Energy Agency’s Executive Director has described the situation as the biggest energy security threat in modern history, a characterisation made on 23 April when cumulative supply losses were still below 1 billion barrels. They have since exceeded that threshold. This is the supply-side mechanism driving the current inflation reset.
The conflict began on 28 February 2026 with Operation Epic Fury, the joint United States and Israeli airstrikes on Iranian nuclear and military infrastructure. Iran responded by declaring the Strait of Hormuz closed on 4 March and threatening any vessel attempting transit. The strait remains under a dual blockade, with Iran enforcing closure on one side and the United States maintaining a naval blockade of Iranian ports on the other.
President Trump suspended the United States-led “Project Freedom” operation intended to force the strait open and held direct discussions with President Xi Jinping on 14 May, confirming both governments’ support for reopening the waterway. Iran’s counter-proposal to the United States ceasefire framework, delivered through Pakistan, was rejected by President Trump as “totally unacceptable.” Until a working ceasefire framework is in place, every projection in the energy complex carries significant war risk.
The supply numbers are without precedent. The International Energy Agency’s May report places March throughput at just over 2 million barrels per day against a pre-war baseline of approximately 20 million barrels per day, with cumulative supply losses now exceeding 1 billion barrels and more than 14 million barrels per day of capacity shut in.
Even in the International Energy Agency’s base case, which assumes Hormuz tanker traffic gradually resumes from June, global oil supply is projected to fall by 3.9 million barrels per day year-over-year in 2026 to 102.2 million barrels per day, leaving a 1.78 million barrels per day shortfall relative to demand. That is the optimistic scenario. A reopening that slips into the third quarter widens the deficit toward 3 million barrels per day and reshapes the entire 2026 inventory outlook.

OPEC+ has attempted to fill the gap but structurally cannot. The 5 April meeting committed to an additional 206 thousand barrels per day of output for May implementation. The 3 May meeting added a further 188 thousand barrels per day and was notable as the first held without the United Arab Emirates, which exited the group.
Both increases are largely symbolic in market impact. Multiple OPEC members cannot physically lift production because of war damage and shipping constraints, and the cartel that historically functions as the swing supplier in oil supply shocks is itself absorbing the largest share of the current disruption.
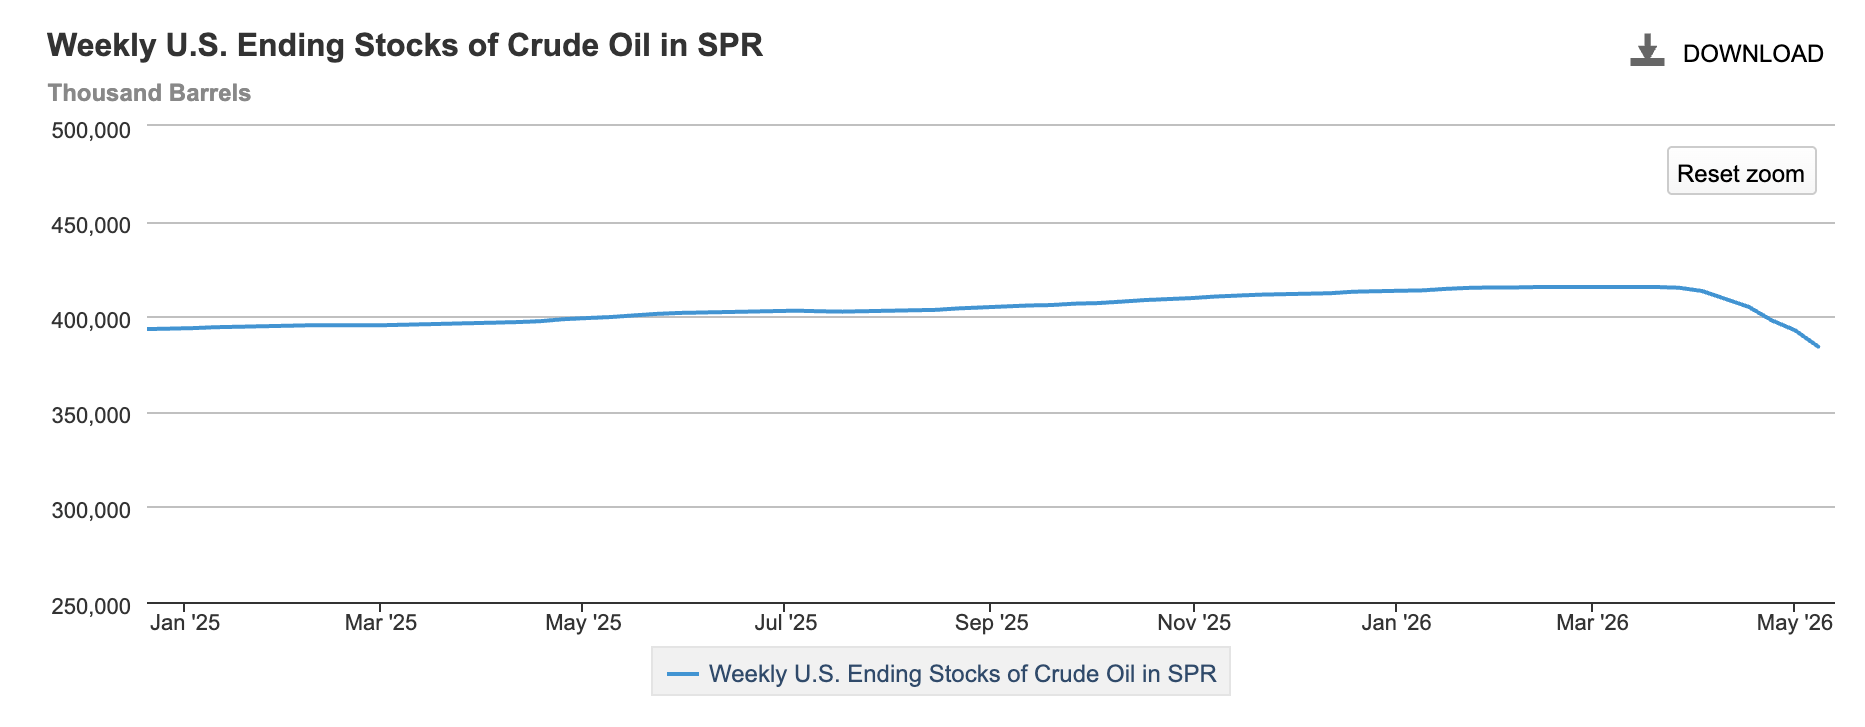
The United States policy response operates on two fronts, and both carry political cost. Strategic Petroleum Reserve drawdowns have reduced the reserve from approximately 415 million barrels in early March to a range of 384 to 397 million barrels currently, an estimated drawdown of 18 to 30 million barrels over 77 days. The Strategic Petroleum Reserve now sits at roughly 55 percent of authorised capacity, with limited ability to refill while Brent crude trades above $100 per barrel.
The naval blockade of Iranian ports is the second front. On 8 May, United States forces disabled two Iranian-flagged tankers attempting to access Gulf of Oman ports, while Iran reciprocated by seizing the Ocean Koi. Neither policy track is sustainable into 2027 if the conflict extends.
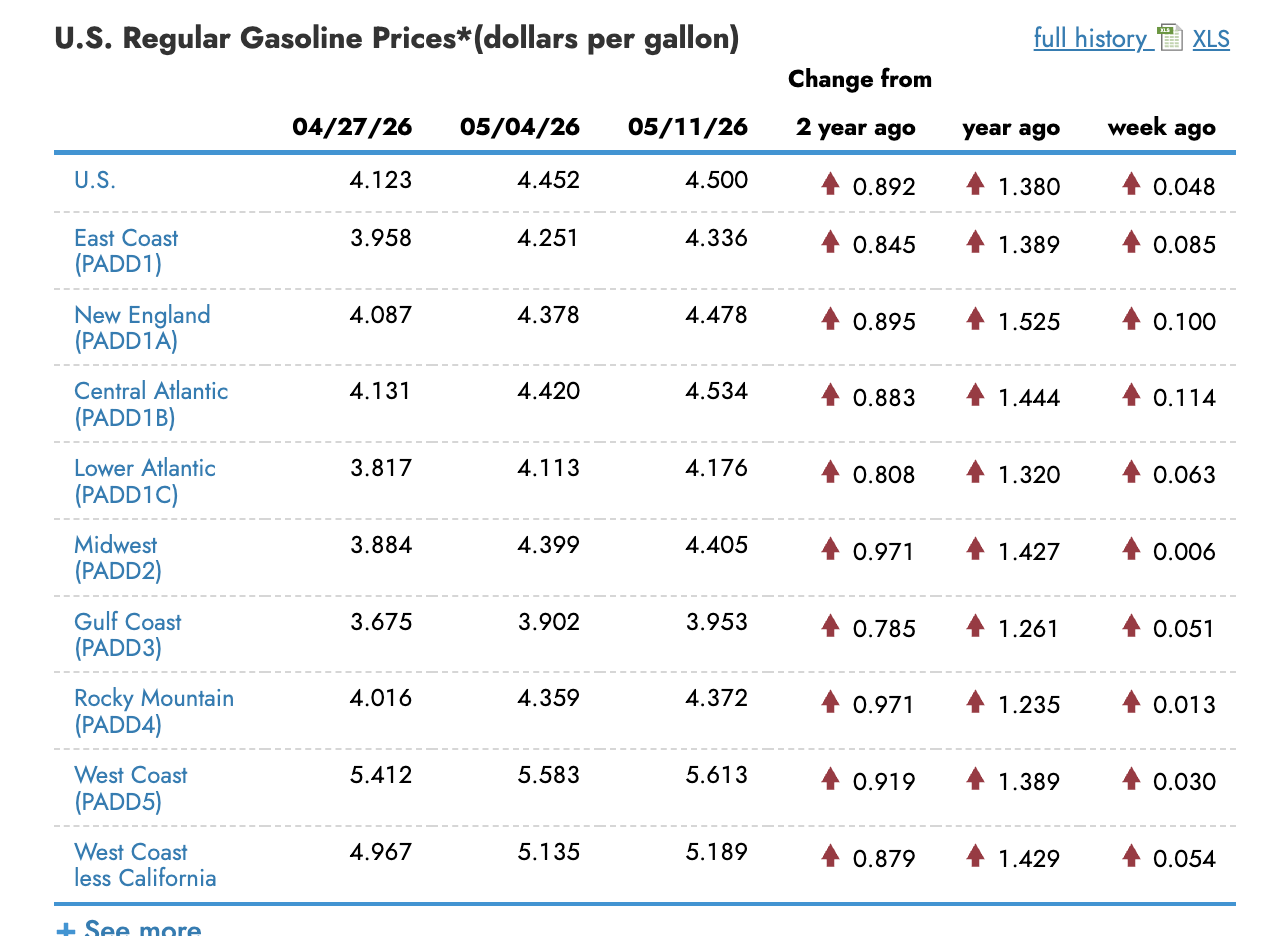
The pass-through to United States consumers is now visible across the energy complex. Retail gasoline prices reached $4.5 per gallon in the 11 May Energy Information Administration weekly survey, up from $4.452 on 4 May and below $4.00 as recently as late February. Refining margins expanded sharply in March as Brent crude rose from $78 to $112 over 29 days while refined product prices lagged. That gap has now closed, and the higher margin is fully reflected in retail prices.
Diesel represents the larger inflation risk going forward because freight, food distribution, and industrial activity all depend on diesel pricing in ways that headline gasoline figures understate.
This pass-through is what produced the April CPI energy print of +3.8 percent month-over-month and gasoline at +5.6 percent month-over-month.
Demand destruction is beginning, which is the only mechanism short of a ceasefire capable of bringing prices back. The International Energy Agency projects 2026 global oil demand to contract by 420 thousand barrels per day year-over-year to 104 million barrels per day, 1.3 million barrels per day below the pre-war forecast trajectory.
Demand destruction at the consumer level also functions as a real-income shock to households and a margin shock to industrial activity, which feeds directly into the broader consumer slowdown thesis. The macroeconomic setup is recursive. High oil prices reduce real wages, real wage compression slows consumer spending, and reduced consumer spending eventually compresses oil demand. The cycle ultimately clears at a lower price but at a higher overall cost basis for the economy.
Three variables will determine the trajectory from here. The first is a confirmed Hormuz reopening framework, which remains stalled at the United States-China-Iran negotiation level. The second is any escalation that draws additional Gulf producers into the conflict, with Saudi Arabian infrastructure representing the largest remaining tail risk. The third is the marginal United States shale supply response, which is price-elastic but operationally slow, with two to three quarters of lag before meaningful additional barrels reach the market.
The energy shock is the primary driver of a broader inflation reset. A ceasefire on the International Energy Agency’s June timeline would return Brent crude toward $80 per barrel and bring breakeven inflation expectations lower with it. A continued absence of a ceasefire through the third quarter raises the probability of $130 Brent and elevates the September FOMC rate hike scenario from a tail risk to the base case.

News From the Cryptosphere
US Senate Banking Committee Advances Landmark CLARITY Act in Historic 15-9 Vote

The US Senate Banking Committee advanced the Digital Asset Market Clarity Act on 14 May 2026 in a 15-9 vote, sending one of the most significant pieces of cryptocurrency legislation in US history to the full Senate floor. The vote crossed party lines, with Democratic Senators Ruben Gallego of Arizona and Angela Alsobrooks of Maryland joining all Republicans on the committee in support. The result marks a structural turning point for the cryptocurrency sector after years of jurisdictional uncertainty between the Securities and Exchange Commission (SEC) and the Commodity Futures Trading Commission (CFTC).
The CLARITY Act defines how digital assets are regulated in the United States, drawing bright lines between SEC and CFTC oversight responsibilities. Under the bill, spot cryptocurrency markets would fall predominantly under CFTC jurisdiction, while the SEC would retain oversight of digital assets classified as securities.
The framework also establishes rules for stablecoin yield payments, consumer protection in decentralised finance, law enforcement engagement, safe harbours for software and protocol developers, and coordinated rulemaking between the two agencies. Industry participants have argued for years that the absence of these jurisdictional boundaries has chilled institutional participation and limited domestic innovation.
The most significant unresolved issue heading into the full Senate vote is the Van Hollen ethics amendment, which sought to bar senior government officials and their immediate families from holding certain cryptocurrency business interests. The amendment failed by a vote of 11-13 in committee and remains a flashpoint for opposition lawmakers concerned about conflicts of interest in the sector. Banks, labour unions, and law enforcement agencies have also expressed concerns about specific provisions, particularly those touching consumer protection in decentralised finance and stablecoin-related yield rules.
The bill now proceeds to a full Senate floor vote, with no official date confirmed but a likely window in June. To overcome a probable filibuster, Republicans will need to secure at least seven Democratic or independent votes, more than the bipartisan support received in committee. The legislation also replaces the text of an earlier market structure bill passed by the House of Representatives in 2025, meaning the House will need to consider the Senate version again before the bill can become law.
Crypto-linked equities responded sharply to the committee vote on 14 May, with Coinbase rising 9.10 percent, MicroStrategy gaining 8.16 percent, and Robinhood adding 6.16 percent in the session. Bitcoin briefly climbed to $81,965 before retracing as macroeconomic pressures from the ongoing Iran energy shock and the Federal Reserve leadership transition weighed on broader risk appetite. The CLARITY Act represents the most substantive US federal effort to date to create a unified regulatory framework for digital assets and is widely viewed as the precondition for the next phase of institutional adoption.
Bitwise Launches Spot Hyperliquid ETF (BHYP) on NYSE With In-House Staking

Bitwise Asset Management began trading its spot Hyperliquid Exchange Traded Fund (ETF) on the New York Stock Exchange under the ticker BHYP on 15 May 2026, becoming one of the first products in the US to provide regulated spot exposure to the HYPE token alongside integrated staking rewards. The launch represents a meaningful expansion of the spot crypto ETF complex beyond BTC, ETH, and SOL into the rapidly growing on-chain derivatives sector.
The product carries a 0.34 percent sponsor fee, with the fee waived to zero for the first month on the fund’s first $500 million in assets under management. Bitwise has confirmed that it will stake the fund’s HYPE holdings through its in-house staking arm, Bitwise Onchain Solutions, allowing investors to capture network yield in addition to spot price exposure. The staking integration distinguishes BHYP from many earlier spot crypto ETFs that excluded yield-generating activities pending regulatory clarification.
HYPE responded sharply to the ETF launch and to a separate Coinbase partnership announcement on the same day, rising 21 percent over 24 hours to $46.64. The 21Shares Hyperliquid ETF, which launched earlier in 2026 under the ticker THYP, recorded what the issuer described as its best single-day inflows of $5 million on the same session. The dual product launch reflects accelerating institutional positioning around on-chain derivatives venues, where Hyperliquid has emerged as the dominant platform.
The ETF launch coincides with Coinbase’s announcement that it will become the official treasury deployer for the USDC stablecoin on the Hyperliquid network. According to Coinbase, total USDC supply on Hyperliquid has now reached approximately $5 billion, reflecting the platform’s growing role as an institutional venue for perpetual derivatives. The combination of regulated spot ETF exposure, in-house staking, and deepening exchange integration positions HYPE as one of the first non-Layer 1 tokens to attract mainstream investment infrastructure.
The Bitwise launch follows the broader pattern of 2026 crypto ETF activity, in which issuers have expanded beyond BTC and ETH to include SOL, XRP, and now Hyperliquid as the regulatory framework around staking-enabled products has gradually loosened. Industry analysts view the rapid product proliferation as evidence that the US spot crypto ETF model has matured into a standard institutional access vehicle, with applications now filed for several additional Layer 1 and DeFi-native tokens awaiting SEC review.

US Spot Bitcoin ETFs Post $1 Billion Weekly Outflow, Ending Six-Week Inflow Streak

US spot Bitcoin exchange-traded funds recorded their largest weekly net outflow of 2026 during the week ended 15 May, with approximately $1 billion exiting the eleven approved products on a combined basis. The reversal ends a six-week run of consistent net inflows that had reinforced institutional positioning narratives through April and into early May.
BlackRock’s iShares Bitcoin Trust, trading under the ticker IBIT, continues to dominate both daily flows and total assets under management, but even IBIT recorded net outflows during the final week. On 15 May alone, all eleven spot Bitcoin ETFs collectively posted approximately $290.4 million in net outflows, with not a single product recording positive flows on the session. The synchronised exits across issuers suggest macro-driven repositioning rather than fund-specific allocation shifts.
Despite the recent outflow week, cumulative net inflows since spot Bitcoin ETF approval in January 2024 still stand at approximately $58.34 billion, with combined assets under management reaching $104.29 billion. The total reflects the asset class’s structural integration into traditional brokerage infrastructure even through periods of price volatility and risk-off positioning.
The outflows coincide with a deteriorating macro backdrop characterised by accelerating inflation tied to the ongoing Iran energy shock, rising long-end Treasury yields above 4.5 percent, and increasing market pricing for Federal Reserve rate hikes rather than the previously expected rate cuts. Bitcoin briefly climbed to $81,965 on 14 May following the CLARITY Act Senate Banking Committee vote before retracing as the rate-hike narrative regained dominance. The outflow pattern reflects a broader shift in institutional positioning away from long-duration risk assets in a higher-for-longer rate environment.
The current outflow episode is a stress test for the spot Bitcoin ETF complex, which has not previously experienced sustained macro-driven outflows of this magnitude. Whether the pattern reverses in the coming weeks will depend largely on developments in the Middle East energy situation, May CPI data due in early June, and Federal Reserve guidance under newly confirmed Chair Kevin Warsh, who took office on 15 May.