

Hot Core CPI Hands Bitcoin’s Fate To Spot Flows
The September US Consumer Price Index (CPI), a key measure of inflation that informs Federal Reserve policy making, came in hotter than consensus. Core prices rose 0.3 percent month on month against a 0.2 percent consensus and 2.6 percent year on year. Headline CPI, meanwhile, rose 0.6 percent as expected and 3.7 percent year on year against a 3.6 percent consensus. The 10-year Treasury yield rose 9.3 basis points to 5.31 percent and the two-year yield 13.1 basis points to 4.92 percent. Bitcoin’s initial reaction was contained: a 1.9 percent fall from the pre-release high of $84,029 to $82,401 within an hour of the release, but the selling did not stop there.
BTC closed Wednesday at $81,669, down 1.8 percent on the day, and fell to $80,210 in early Asian trading on Thursday (October 15) as South Korea’s KOSPI dropped eight percent and triggered circuit breakers. That is a new low for the pullback, beneath the 8 October low of $80,347. By 10:00 UTC, price had recovered only to about $81,300, which is the range floor Monday’s Bitfinex Alpha said needed to hold.
The $81,300 resistance level has therefore been tested harder than expected: this is the third test of the floor in eight days and the first to print a lower low.
BTC first broke above the $81,300 high-volume node in late September and has traded within this range for approximately 24 days, with two unsuccessful attempts to break above resistance and three to breach support. In established uptrends, intermediate ranges on lower timeframes typically resolve within 20 to 30 days, and this range is now at the point where it historically is set to resolve one way or the other.
In Monday’s Bitfinex Alpha, we set three conditions for the view to change to the downside: trading below $81,300 for more than a session, renewed ETF outflows and short-term holders selling at a loss. Two of the three have now been met. Spot bitcoin ETFs recorded a $261.4 million net outflow on the day CPI was released (14 October, 2026) and the Short-Term Holder Spent Output Profit Ratio (STH-SOPR) slipped to 0.998 on Thursday’s (15 October, 2026) partial reading, its first print below the equilibrium level of 1, since 8 October. The third condition, a sustained break of $81,300, has not happened. The overnight dip was brought back within hours, and BTC is currently trading above $82,000.
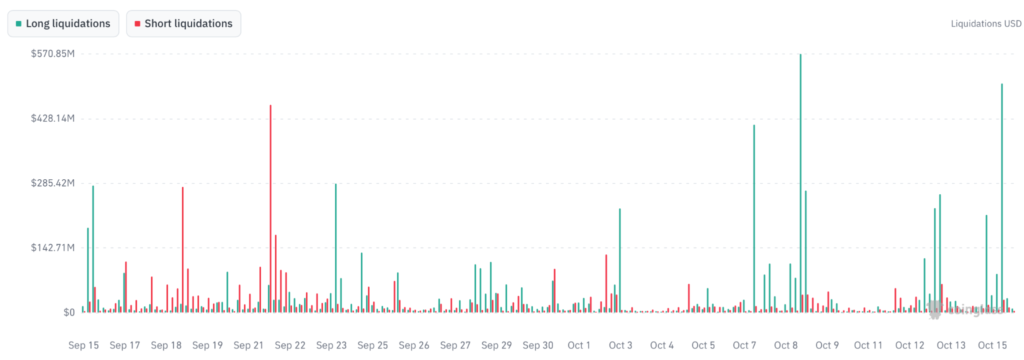
Since the leverage flush on 8 October, positioning on perpetual and futures contracts has not been rebuilt on the long side. What has changed since the CPI report is that aggregate open interest has started rising again as price falls, which is reflective of short positioning being added into the break. This represents a repeat of the pattern that produced the squeeze-or-breakdown fork on 7 October, and led to the leverage flush on the next day. Liquidations on 14 and 15 October reached $1.02 billion across all coins, 90 percent of them long positions. Only $210 million of that, however, was in bitcoin. The damage again landed in altcoins.
Key structural metrics now favour a test of the floor rather than the ceiling.
Overhead supply capping recent advances has fallen by about 20 percent over the past eight days, while the cost-basis support floor beneath price has nearly doubled. That floor is now being traded through rather than above, however: the 909,000 BTC bought between $81,300 and $84,000 sits at a loss at $81,300, and the share of supply in profit has fallen to 67.1 percent, the lowest point of the pullback. With core CPI at 0.3 percent, the macroeconomic window for $84,500 did not open. The question for the rest of the week is no longer whether ETF inflows can clear resistance but whether they stop leaving while the floor is tested.
Positioning: Shorts Added Into The 4.9 Percent Decline
The derivatives market did not amplify the CPI reaction yesterday, and with BTC correcting, it has done so without a liquidation cascade.
Aggregate bitcoin futures open interest (OI) across all tracked exchanges fell to 619,667 BTC on 12 October, the lowest daily reading of 2026 and the lowest since 19 March 2025. That is five percent below 652,546 BTC recorded on 8 October and 12.8 percent below the 22 September peak of 710,885 BTC. Since the CPI release, OI has risen. It stood at 645,682 BTC, or $52.5 billion, at 10:00 UTC on 15 October, up 3.8 percent from 622,098 BTC at 08:30 UTC on 14 October and represented the first sustained increase of the pullback.
OI rising while price falls 2.2 percent and $918 million of longs are liquidated means the positions being opened are shorts, and the funding rate confirms it. The 00:00 UTC print on 15 October was negative, at about minus 4.5 percent annualised, before swinging back to plus 7 percent at 08:00 UTC as the bounce from $80,210 forced some of those shorts to cover. This is the same structure as 7 October, when shorts added into the first loss of $84,000 and were squeezed back through it the next week.
If $81,300 is reclaimed and held, the shorts opened between $80,200 and $81,700 are trapped below the level and a modest spot bid can carry the price back to $83,000. This appears to be happening as we publish this report, with BTC now trading above $82,000. If $81,300 is lost on a sustained basis, those shorts are in profit and the only support is spot demand at the next cost-basis bands.
Funding rates have ranged between negative 4.5 percent and nine percent annualised over the past week and are oscillating around zero session by session, which means neither side is paying to hold a view beyond the next few hours.
The sell-off on 12 and 13 October took bitcoin from $83,777 at Monday’s open to a low of $81,054 early on Tuesday, with most of that clearing taking place outside bitcoin. Liquidations across all coins and exchanges totalled $987.5 million over the two days, of which $773.8 million were long positions. Bitcoin accounted for $217.1 million ($152.3 million in longs) and ether for $217.6 million ($156.9 million in longs). The remaining $552.8 million, or 56 percent of the total, came from other altcoins. The CPI session and the overnight break repeated the pattern: $436.1 million of positions were built up on 14 October and $587.6 million so far on 15 October. Of this $1.02 billion, $918.2 million are longs, with bitcoin accounting for $210.4 million of all positions ($185.4 million in longs) and everything else for the remaining 79 percent.
By comparison, liquidations on 8 October alone totalled $1.19 billion, of which $1.05 billion was in long positions, with bitcoin accounting for $303.9 million. Across the four sessions from 12 to 15 October the market has now liquidated $2 billion, more than the 8 October flush, without bitcoin’s own open interest falling. It is in the altcoin market, as we discuss below, where the leverage problem remains unresolved.
Institutional capital also remains anchored despite recent volatility. Chicago Mercantile Exchange (CME) OI stands at about 110,000 BTC, or 17 percent of the aggregate, reflecting a stable basis-trade book. Recent deleveraging has been concentrated in perpetual contracts on crypto-native venues, clearing out short-term speculation.
On Bitfinex, margin shorts remain negligible at 246 BTC, against approximately 89,600 BTC in margin longs. With little short-side leverage to squeeze on our own venue and a limited long overhang to flush, near-term price action is likely to be driven predominantly by organic spot market flows, with less influence from derivative-led liquidations.
The Hedge That Cushioned CPI Now Pivots on $83,000 into Friday
The upcoming options expiries separate short-term event hedging from longer-term bullish positioning. The 16 October expiry carries $1.45 billion in notional OI with a put/call ratio of 1.85, concentrated in puts at the $78,000, $80,000 and $83,000 strikes. In contrast, the 30 October expiry, which follows the Federal Open Market Committee (FOMC) meeting on 27-28 October, holds $12 billion in notional OI with a put/call ratio of just 0.52. Calls are heavily concentrated between $90,000 and $100,000, pointing to solid institutional positioning for upside after the FOMC.
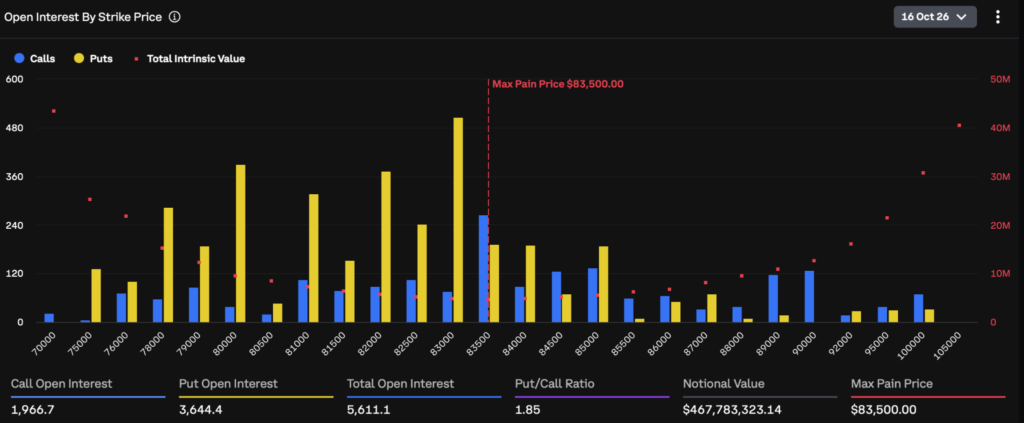
With core CPI printing above consensus, the dealer repurchasing tailwind that an in-line reading would have produced did not materialise, and the overnight break has moved the pivot. The $83,000 puts that were almost at the money on Wednesday are now about $1,700 in the money, and in total roughly 2,300 put contracts in the 16 October expiry carry strikes above spot. The dealers who sold those puts are short futures against them and will keep those hedges on until settlement at 08:00 UTC on Friday, which is a standing source of supply over the next 22 hours. The $78,000 and $80,000 puts, the two largest positions, remain out of the money and will add to that supply only if price trades below $80,000. The at-the-money strike has moved from $83,000 to $81,000, with implied volatility there at 35.8 percent. The 30-day volatility index (DVOL) has risen from 38.1 to 39.7 since Wednesday, so the market is paying more for protection into settlement, not less. Once the 16 October contracts settle, that hedging supply disappears, which is why a reclaim of $81,300 on Friday morning would face less resistance than the same move today.
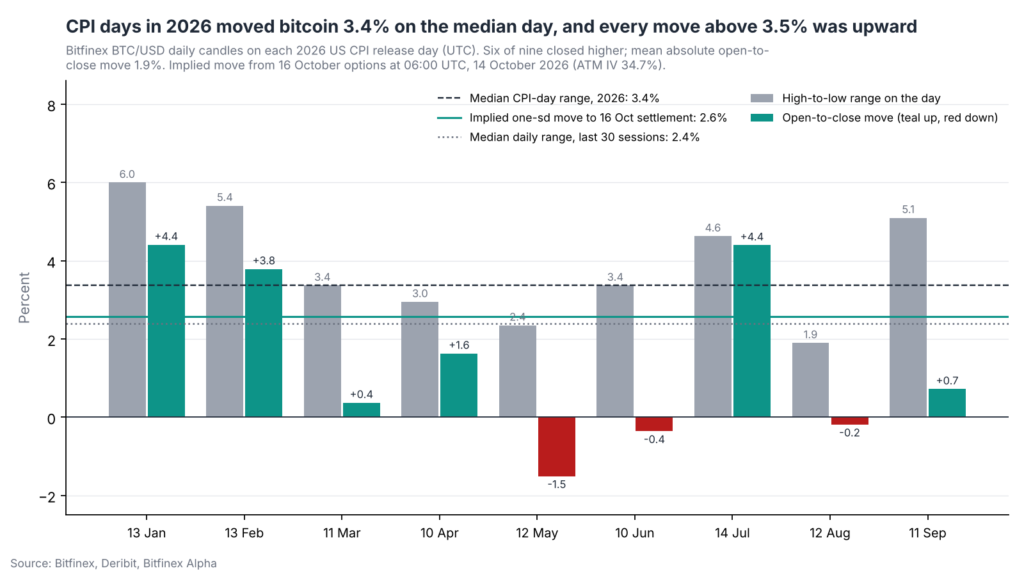
The CPI reaction stayed inside what options had priced, but only just.
Wednesday’s full range was 3.3 percent, from $84,200 to $81,447, against the 2.6 percent one-standard-deviation move implied for the release-to-settlement window, and the day closed 1.8 percent lower. From here the options market implies a one-standard-deviation move of about 1.8 percent, or $1,450, by Friday’s settlement, a range of roughly $79,850 to $82,750 around $81,300. The upper bound sits below the $83,000 strike, so a move back through the in-the-money puts before settlement is a one-standard-deviation event, not the base case.
Across the nine previous CPI releases in 2026, the median intraday range was 3.4 percent. Six of the nine sessions closed higher, and every session with an intraday range exceeding 3.5 percent closed to the upside. Wednesday became the fourth of ten CPI sessions this year to close lower, with a 3.3 percent range that sat right on the median, so the pattern of large upside CPI days is unbroken but it offered no support this time.
On-Chain Structure: The Floor Is Being Traded Through, and the Next Buyers Sit at $80,400 and Below
On-chain distribution data show that the market structure beneath current price has strengthened over the past week, but the band that strengthened is now the one being tested. The volume of bitcoin held in the $81,300 to $84,000 accumulation zone nearly doubled from 500,000 BTC on 6 October to 909,000 BTC on 15 October (Checkonchain), and with price at $81,300 all of it is at or below break-even. Those holders are the break-even sellers on any bounce into $82,000 to $83,000 and the capitulation risk on any further decline, which is why STH-SOPR dipping below 1 on 15 October (today) matters.
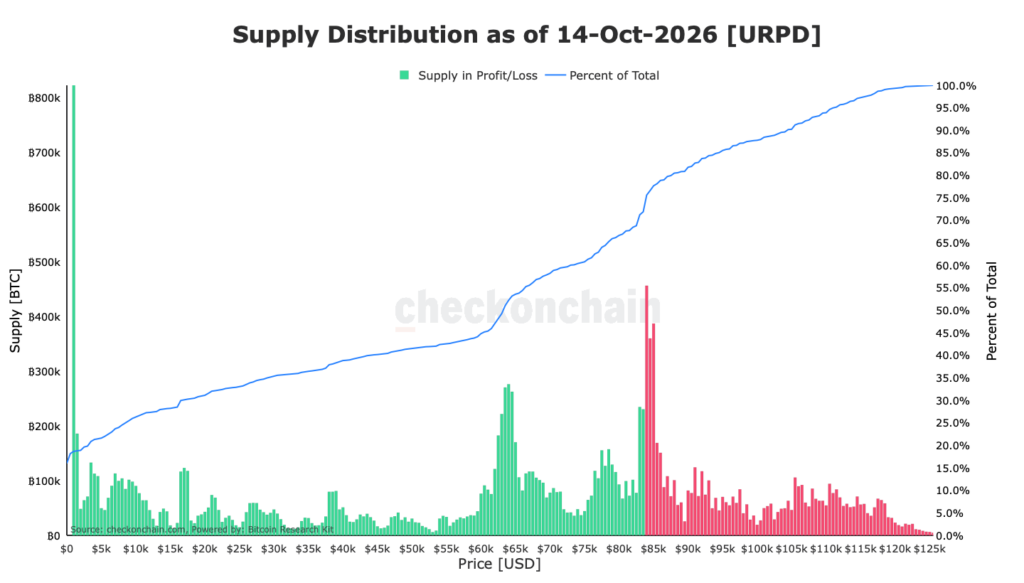
Overhead supply in the $84,000 to $86,500 band has decreased from 1.6 million BTC to 1.26 million BTC, as about one-fifth of that underwater supply was sold at a loss during recent dips, reducing future sell pressure. Wednesday’s pre-release push to $84,029 stopped at the lower edge of that cluster, the fourth rejection there in four sessions.
Despite this clearance, a dense supply cluster of 913,000 BTC remains between $84,140 and $85,114. Reclaiming $84,500 on a daily closing basis will therefore require sustained institutional demand through spot ETFs, and that test has moved out of this week’s range.
Below price, the picture is more constructive. The overnight dip was bought: the $80,353 cost-basis bin, the first beneath the floor, rose by about 47,000 BTC to 227,000 BTC between the 14 and 15 October readings, and the $77,600 to $80,400 band, which held 814,000 BTC on Tuesday, now holds 854,000 BTC. Buyers are stepping in beneath the floor at the same time as recent buyers above it start to sell at a loss, which is the hand-off that decides whether $81,300 is a retest or a breakdown.
Two key on-chain indicators have turned from supportive to borderline:
- Supply in Profit Has Made a New Low: The share of supply in profit fell to 67.4 percent at Wednesday’s close and 67.1 percent on Thursday’s partial reading, below the 67.9 percent printed on 12 October and the lowest point of the pullback. Each new low in this reading means more recently bought coins are underwater and available to sell on a bounce. A move back above $81,300 lifts it only to about 70 percent. The 75 percent bull-market threshold (historical mean: 74.7 percent) now sits above $84,500, out of reach this week.
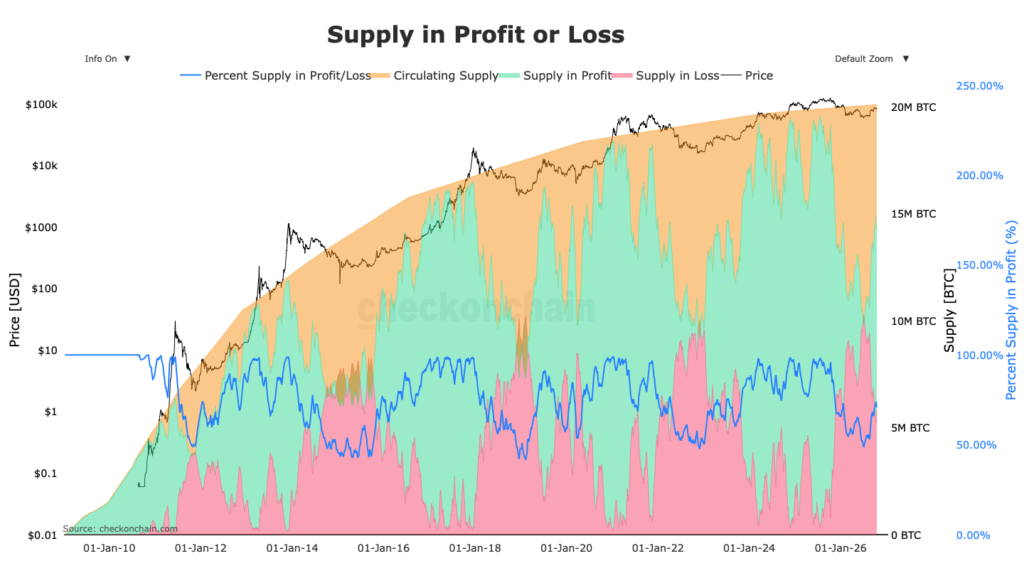
- Short-Term Holder Realised Profit (STH-SOPR): The ratio held above 1 through the CPI session, at 1.0008 on Wednesday, but Thursday’s partial reading is 0.998, the first print below 1 since the 8 October flush. One partial reading is not the “several days below 1” which we believe is necessary to invalidate our view, but it is the signal to watch at the close. A full-day print below 1 would mean recent buyers are now selling at a loss into the range floor rather than holding it. With the STH cost basis sitting at $74,423, recent entrants as a cohort still hold an unrealised profit of about nine percent, which keeps aggregate capitulation risk low even as the late buyers above $81,300 are underwater.
In addition, the average cost basis of US spot bitcoin ETF investors sits at $84,354, so the average ETF holder is currently underwater (ETF MVRV 0.967). A support cluster of 854,000 BTC accumulated between $77,600 and $80,400 provides secondary structural support above the True Market Mean of $77,476.
Institutional Flows: Spot ETF Demand Is the Ultimate Confirmation Metric
While macroeconomic data creates the window of opportunity, spot ETF flows will determine whether the range floor holds. To target the 2026 yearly open at $87,722, spot ETFs need back-to-back days of net inflows approaching the September daily average of $340 million, and that is not this week’s question.
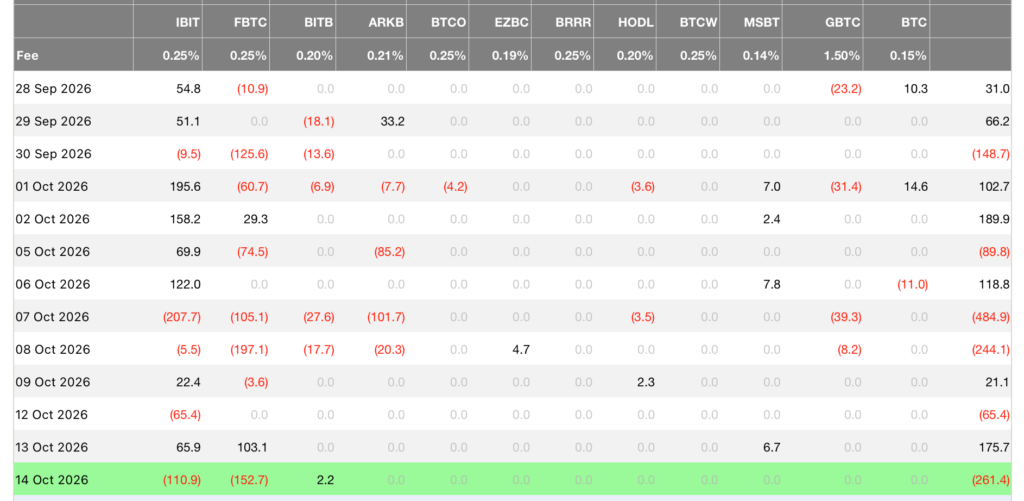
Following a $65.4 million outflow on Monday, 12 October 2026, net inflows of $175.7 million arrived the next day (13 October 2026) led by FBTC. The CPI session reversed that: Wednesday 14 October printed a $261.4 million net outflow, with FBTC (minus $152.7 million) and IBIT (minus $110.9 million) both selling, the largest outflow since the $484.9 million on 7 October and the fourth outflow session in six. October now stands at roughly minus $540 million in flows through 14 October. Today’s print (to be published on 16 October) is the one that separates a single risk-off day from a run. A second consecutive outflow with price below $81,300 completes the weekly’s downside conditions. A flat or positive print while price holds the level keeps the retest reading alive.
Spot ether ETF flows turned positive on 13 October 2026, with net inflows of $24.8 million, ending a 10-day outflow streak, and then reversed on 14 October with a $129.5 million net outflow, $109.8 million of it from ETHA. ETH/BTC has fallen to 0.0292, below the 0.0298 level the weekly set as the confirmation that altcoins could stop underperforming. Both conditions that were met by the narrowest of margins on Tuesday have now failed.
Altcoin Dynamics: Altcoins Are Leading the Decline Again
Altcoins remain vulnerable to macro volatility. They are expected to rise less than bitcoin on positive news and fall further on hawkish surprises, and the 36 hours since the CPI release have delivered the second half of that in full.
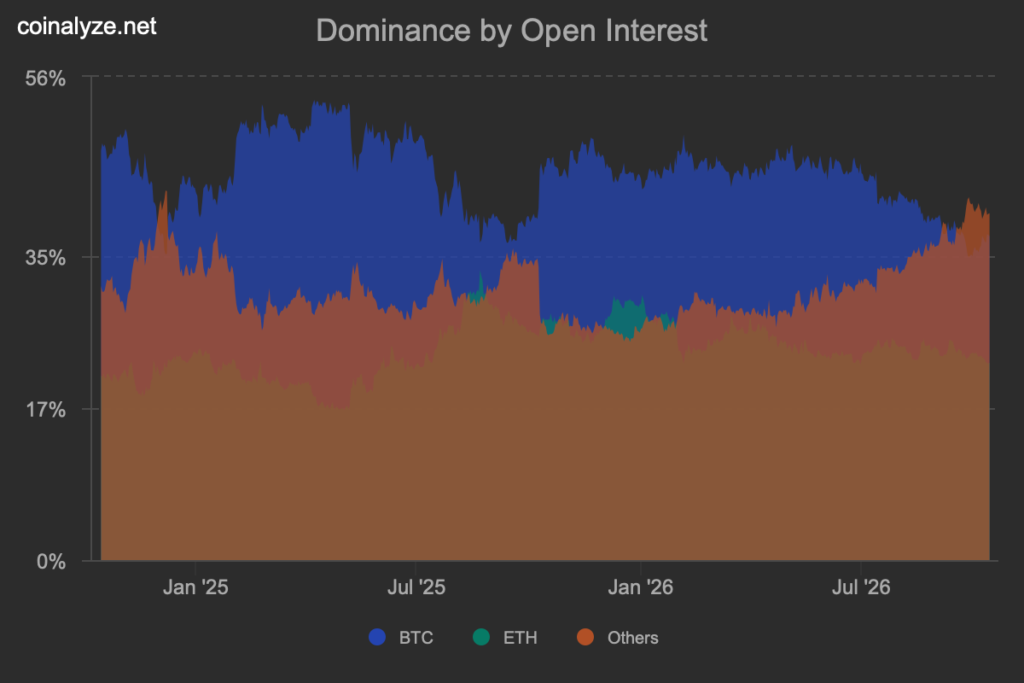
During the 12 to 13 October decline, altcoins exhibited a 3.2x downside beta multiplier relative to bitcoin, with a 10.4 percent median altcoin decline versus 3.3 percent for BTC. This amplified sensitivity stems from derivatives positioning. As of late September 2026, aggregate altcoin open interest (41.4 percent of the $140.7 billion total tracked market) surpassed Bitcoin’s market share (37 percent) for the third time in two years.
Historically, when speculative leverage concentrates within thinner altcoin liquidity pools rather than bitcoin, the market becomes highly susceptible to cascading liquidations and cross-collateral margin calls.
In December 2024, a similar open interest crossover triggered $1.58 billion in liquidations and a 44.3 percent altcoin drawdown over 90 days. A comparable flash-liquidation in October 2025 wiped out $19 billion in leverage within 24 hours, driving a 28.6 percent drop in altcoins while bitcoin declined 11.9 percent. The recent mid-October leverage flush, where altcoins accounted for $552.8 million (56 percent) of total liquidations, highlights the continuing risks of elevated derivative exposure.
The hot core print produced the same pattern on a smaller scale. In the hour after the release the median of nine large altcoins on Bitfinex fell 2.5 percent to its low against 1.4 percent for bitcoin, a 1.8x ratio, with SUI (minus 3.8 percent), AVAX (minus 2.9 percent) and NEAR (minus 2.8 percent) the deepest. By 13:45 UTC on 15 October 2026, the median altcoin was still 1 percent below its 12:00 UTC level against 0.5 percent for bitcoin, so the relative damage persisted through the recovery. Until excess leverage clears, altcoins are expected to lag bitcoin on any rebound, with the 1.3x rebound ratio from the weekly acting as a ceiling. They are expected extend the 2x to 4x downside ratio of the three precedents if $81,300 gives way.
Of the $1.02 billion liquidated on 14 and 15 October, 79 percent were altcoins. Until the altcoin share of open interest falls back below bitcoin’s, altcoins are expected to lag bitcoin on any rebound, with the 1.3x rebound ratio from the weekly acting as a ceiling. On the downside, meanwhile, we see the 2x to 4x ratio holding if $81,300 gives way.
A sustained rotation into altcoin outperformance requires three key confirmation metrics: aggregate altcoin open interest share falling back below bitcoin’s market share, ETH/BTC holding firm above its key 0.0298 support level (it is currently trading at 0.0296 at the time of writing, so this condition could be met), and US spot ether ETF inflows demonstrating consecutive expansion, which Wednesday’s $129.5 million outflow has reset.
Macro Outlook & Key Levels
The key macroeconomic benchmark was a core CPI reading of 0.2 percent month on month or lower, and the print missed it. The 0.3 percent reading put an October hike back in play. CME FedWatch odds of a hike on 28 October jumped from about 22 percent to almost 47 percent in the hour after the release before settling near 26 percent, with fed funds futures still pricing better than 70 percent odds of no change this month, while prediction markets briefly priced the hike above 50 percent. The front end moved first, with the two-year yield up 13.1 basis points against 9.3 basis points for the 10-year, and the equity reaction was larger than bitcoin’s initial move. The Nasdaq fell two percent on Wednesday, its futures a further one percent overnight, and the KOSPI eight percent. The next inputs are Fed Chair Warsh’s remarks at the IMF meetings on Friday, September PCE on 29 October and the FOMC decision on 28 October. Bitcoin’s 30-session correlation with the 10-year yield was minus 0.4 at the 7 October mid-week, and with the 10-year at 5.31 percent and rising, the macro channel is a headwind rather than a tailwind for the rest of the week.
What we expect for the rest of the week: the range floor is being tested and the test is not yet resolved. Our base case is that $81,300 is reclaimed and held into Friday’s 08:00 UTC settlement, because the overnight break was driven by new short positioning rather than bitcoin long liquidations. Buyers added about 40,000 BTC of cost basis beneath the floor overnight, most of it in the $80,353 bin, while the in-the-money put hedging that is supplying the market will disappear at settlement.
That base case fails on a sustained move below $81,300 with a second consecutive ETF outflow and a full-day STH-SOPR print below 1, in which case our view changes and $80,210 becomes the first level to watch. Prices at $77,600 to $80,400 band with 854,000 BTC sitting in supply becomes the second, and the True Market Mean at $77,476 is the reference beneath that. The upside path reopens only after $81,300 is reclaimed: $83,000 is the first resistance, where the in-the-money puts sit, then $84,000 to $84,500, and neither is reached without ETF inflows returning.
| Key Level | Market Significance | Analytical Target / Conditions |
|---|---|---|
| $84,500 | Macro Resistance Upper Bound | Requires daily close + ETF inflows >$340M to reclaim >75% supply in profit and target $87,722; out of reach this week |
| $84,140 – $85,114 | Major Cost-Basis Density Cluster (913k BTC) | Needs spot-led absorption without open interest expansion to clear supply overhang; rejected at $84,029 before the CPI release |
| $83,000 | Largest in-the-money put strike in the 16 October expiry; first resistance | Dealer hedges against these puts supply the market until 08:00 UTC Friday; a reclaim is easier after settlement than before it |
| $81,300 | Structural Range Floor Support, under test | Must be reclaimed and held through Thursday’s session; 909k BTC bought above it since 6 October are now at break-even or below; fails with a second ETF outflow and STH-SOPR below 1 for a full day |
| $80,210 | 15 October low, beneath the 8 October low of $80,347 | A sustained break opens the $77,600 to $80,400 band; the $80,353 bin added 47k BTC overnight |
| $77,500 | True Market Mean Support | Ultimate macro downside target in a persistent risk-off / hot CPI scenario |