

Issue #214:
Optimistic Signals Lead BTC To A Crossroad
A Fragile but Constructive Backdrop For Bitcoin
A widening divide across markets is creating an increasingly favourable but fragile backdrop for bitcoin: inflation is cooling, consumers are still spending, housing is weakening, and monetary policy remains constrained.
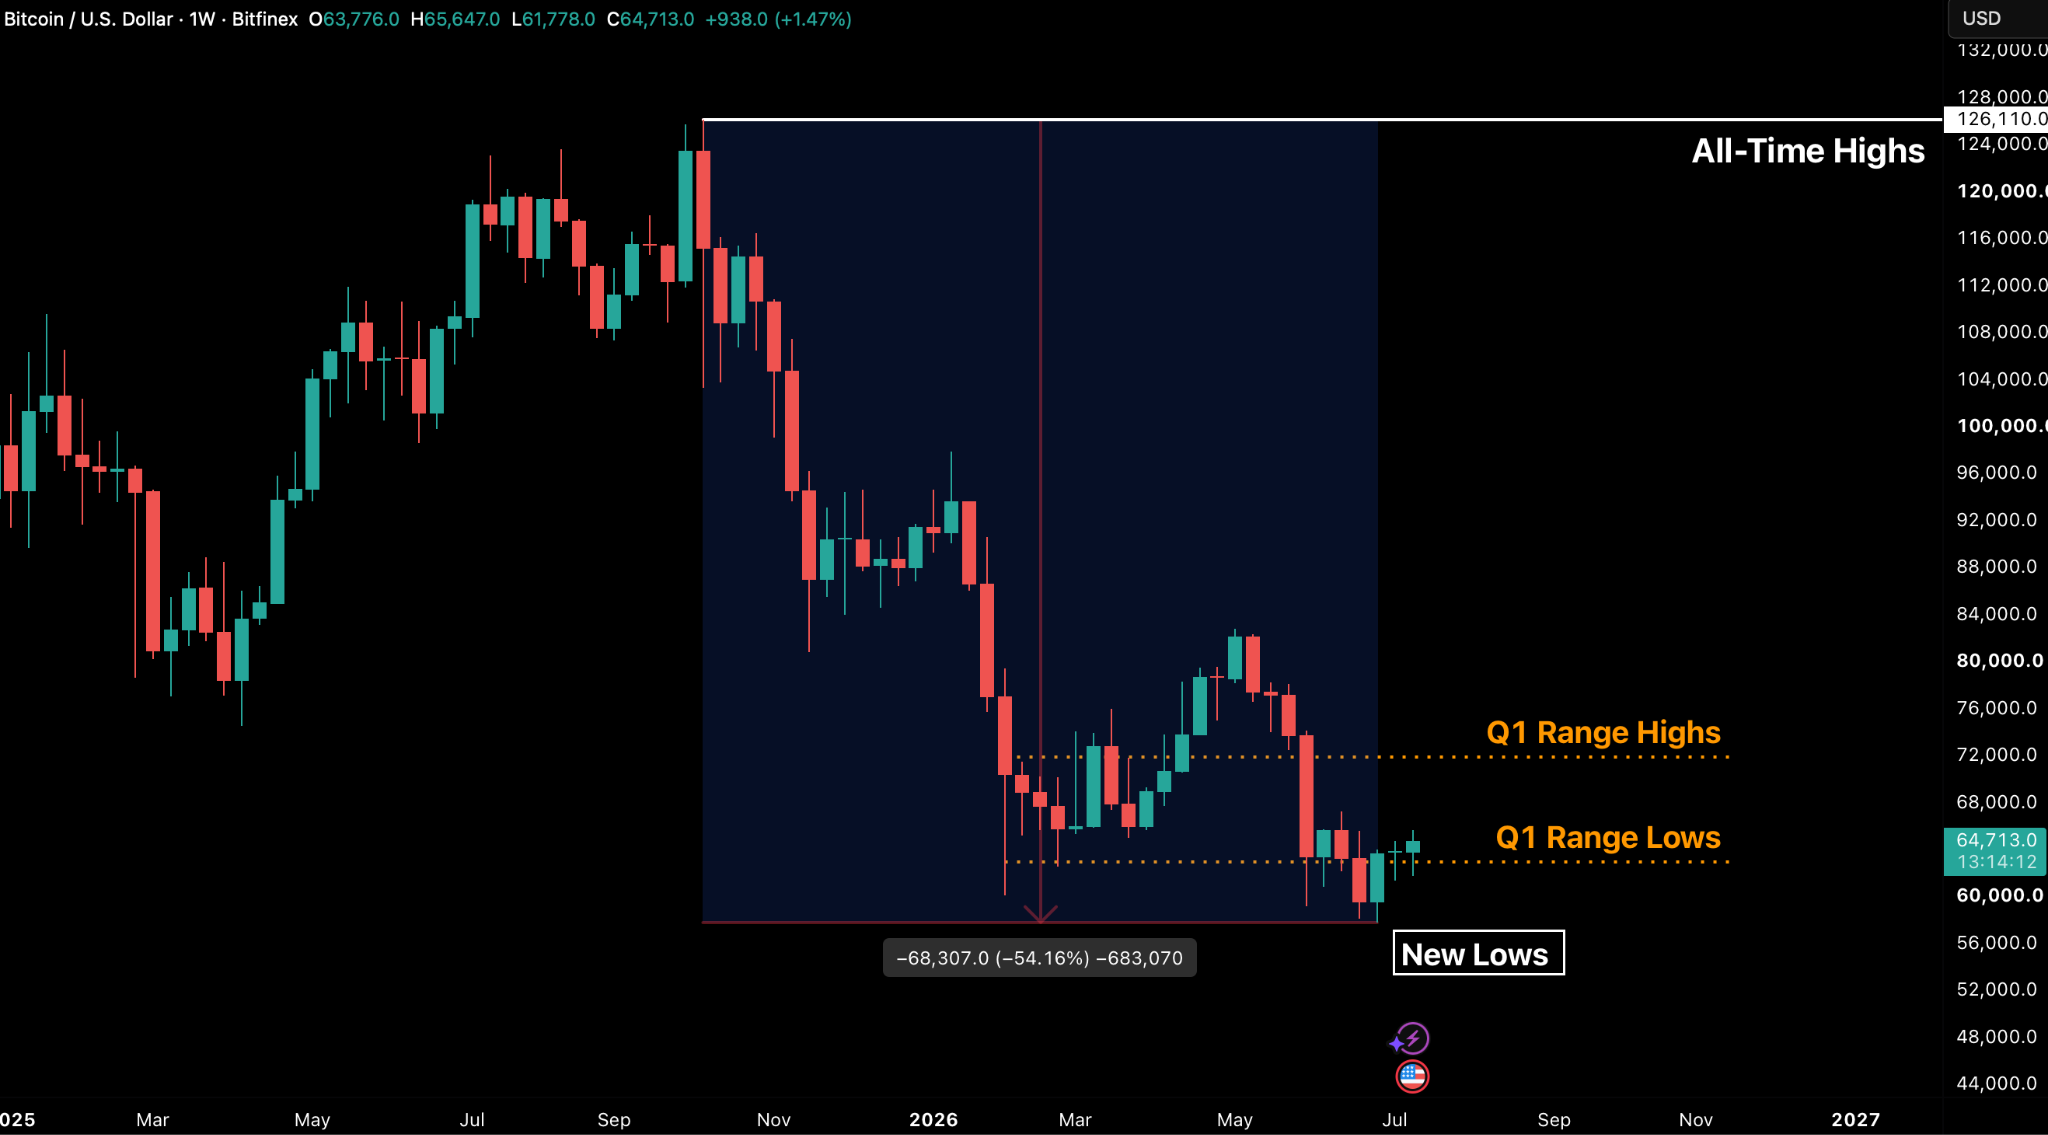
Bitcoin recorded its third consecutive positive weekly close and continued to form a base above the $61,360 demand zone. However, another next test is approaching, as the Short-Term Holder Cost Basis and other key resistance levels have converged near $68,000. A sustained move above this range, supported by strong spot demand, would strengthen the recovery case, while rejection could expose the market to another test of its recent lows. Institutional conditions have improved, with US spot Bitcoin exchange-traded fund (ETF) flows stabilising after a period of persistent redemptions, but demand remains concentrated in BlackRock’s IBIT rather than spread across the broader market. At the same time, Bitcoin’s rising share of trading activity reflects a defensive rotation away from altcoins, not yet a broad return of risk appetite.
The macroeconomic landscape offers BTC some support, although the outlook is not straightforward. US consumer prices fell in June for the first time in six years, largely because of lower energy costs. Underlying inflation also eased, but producer and import-price data showed growing pressure from artificial intelligence infrastructure, defence spending and tariffs, particularly across computing equipment and capital goods.
These competing forces have left the Federal Reserve unable to declare victory on inflation or tighten policy without causing further damage elsewhere. That damage is already visible in housing, where high mortgage rates, weak builder confidence, falling single-family permits and elevated inventories point to a deepening downturn.
Consumers, by contrast, continued to spend, while business investment and manufacturing helped offset the housing drag and kept second-quarter growth estimates near 2.5 percent. This combination of resilient growth, persistent underlying inflation and severe pressure in rate-sensitive sectors reinforces the view that the Fed is trapped in an extended hold. For bitcoin, that policy constraint remains a potential tailwind, although rising real yields and renewed energy inflation are the clearest risks to the outlook.

Market Signals
Bitcoin Consolidation Continues
Bitcoin posted a third straight positive weekly close at $64,872, a 1.7 percent gain that notably simplified the price action roadmap and the levels to watch to gauge the ongoing strength and weakness of the asset. We note that primary resistance levels: the Short-Term Holder realised price (STHRP) and the Q2 open have now converged, compressing the broader bull-bear narrative into a narrow $67,900 to $68,300 corridor, just ~5 percent above the current spot price.
The consecutive positive weekly close for BTC signals a decisive shift in market trend on the lower timeframe. This is the asset’s most impressive positive streak of weekly closes since early May when BTC eclipsed $80,000 during the first bear market rally of this cycle. The price is now up more than 11.5 percent over a three week period since the start of the month. The price gain in the first week of July, closing up 6.84 percent, was the best weekly gain since the week of 20 April. In the last 7 days we have seen a market defined by resilience rather than daily price noise. BTC successfully defended a critical $61,360 demand band early in the week, neutralising downside attempts and yet again holding the $3,400 trading range that we highlighted in last week’s edition of Bitfinex Alpha.
By mid-week, the asset responded emphatically to the June CPI print, the first negative inflation print in six years, a catalyst that propelled prices to a weekly high of $65,647.
Perhaps the most compelling evidence of crypto’s resilience across risk assets appeared on Friday: while broader equities succumbed to a sharp, AI-led selloff, bitcoin decoupled. It absorbed the volatility, holding firm above the demand floor and near the weekly highs despite the headwind of a $1.2 billion mid-month options expiry, the largest mid-month expiry since February 2026.
The market is clearly consolidating ahead of a test of higher range resistance. This was also the highest observed put/call ratio on an options expiry date since November 2025 with the ratio at 0.9.
The Cost Basis Roadmap is Defining the Health of BTC
The short-term holder cost basis slipped below the $68,266 Q2 open on 13 July for the first time, closing the week at $67,970. This is significant because our two most important resistance levels (the STHRP and Q2 open) are now converging into a single decisive band for mid-timeframe regime identification. Historical data suggests that BTC bear market regimes typically endure three consecutive negative quarters before reaching a final low (and Q2 was the third). In the subsequent bull cycle, the final quarterly open of this sequence acts as a relevant support-resistance pivot for identifying market regime shifts.
This is why the Q2 open remains a key level for traders to keep in mind.
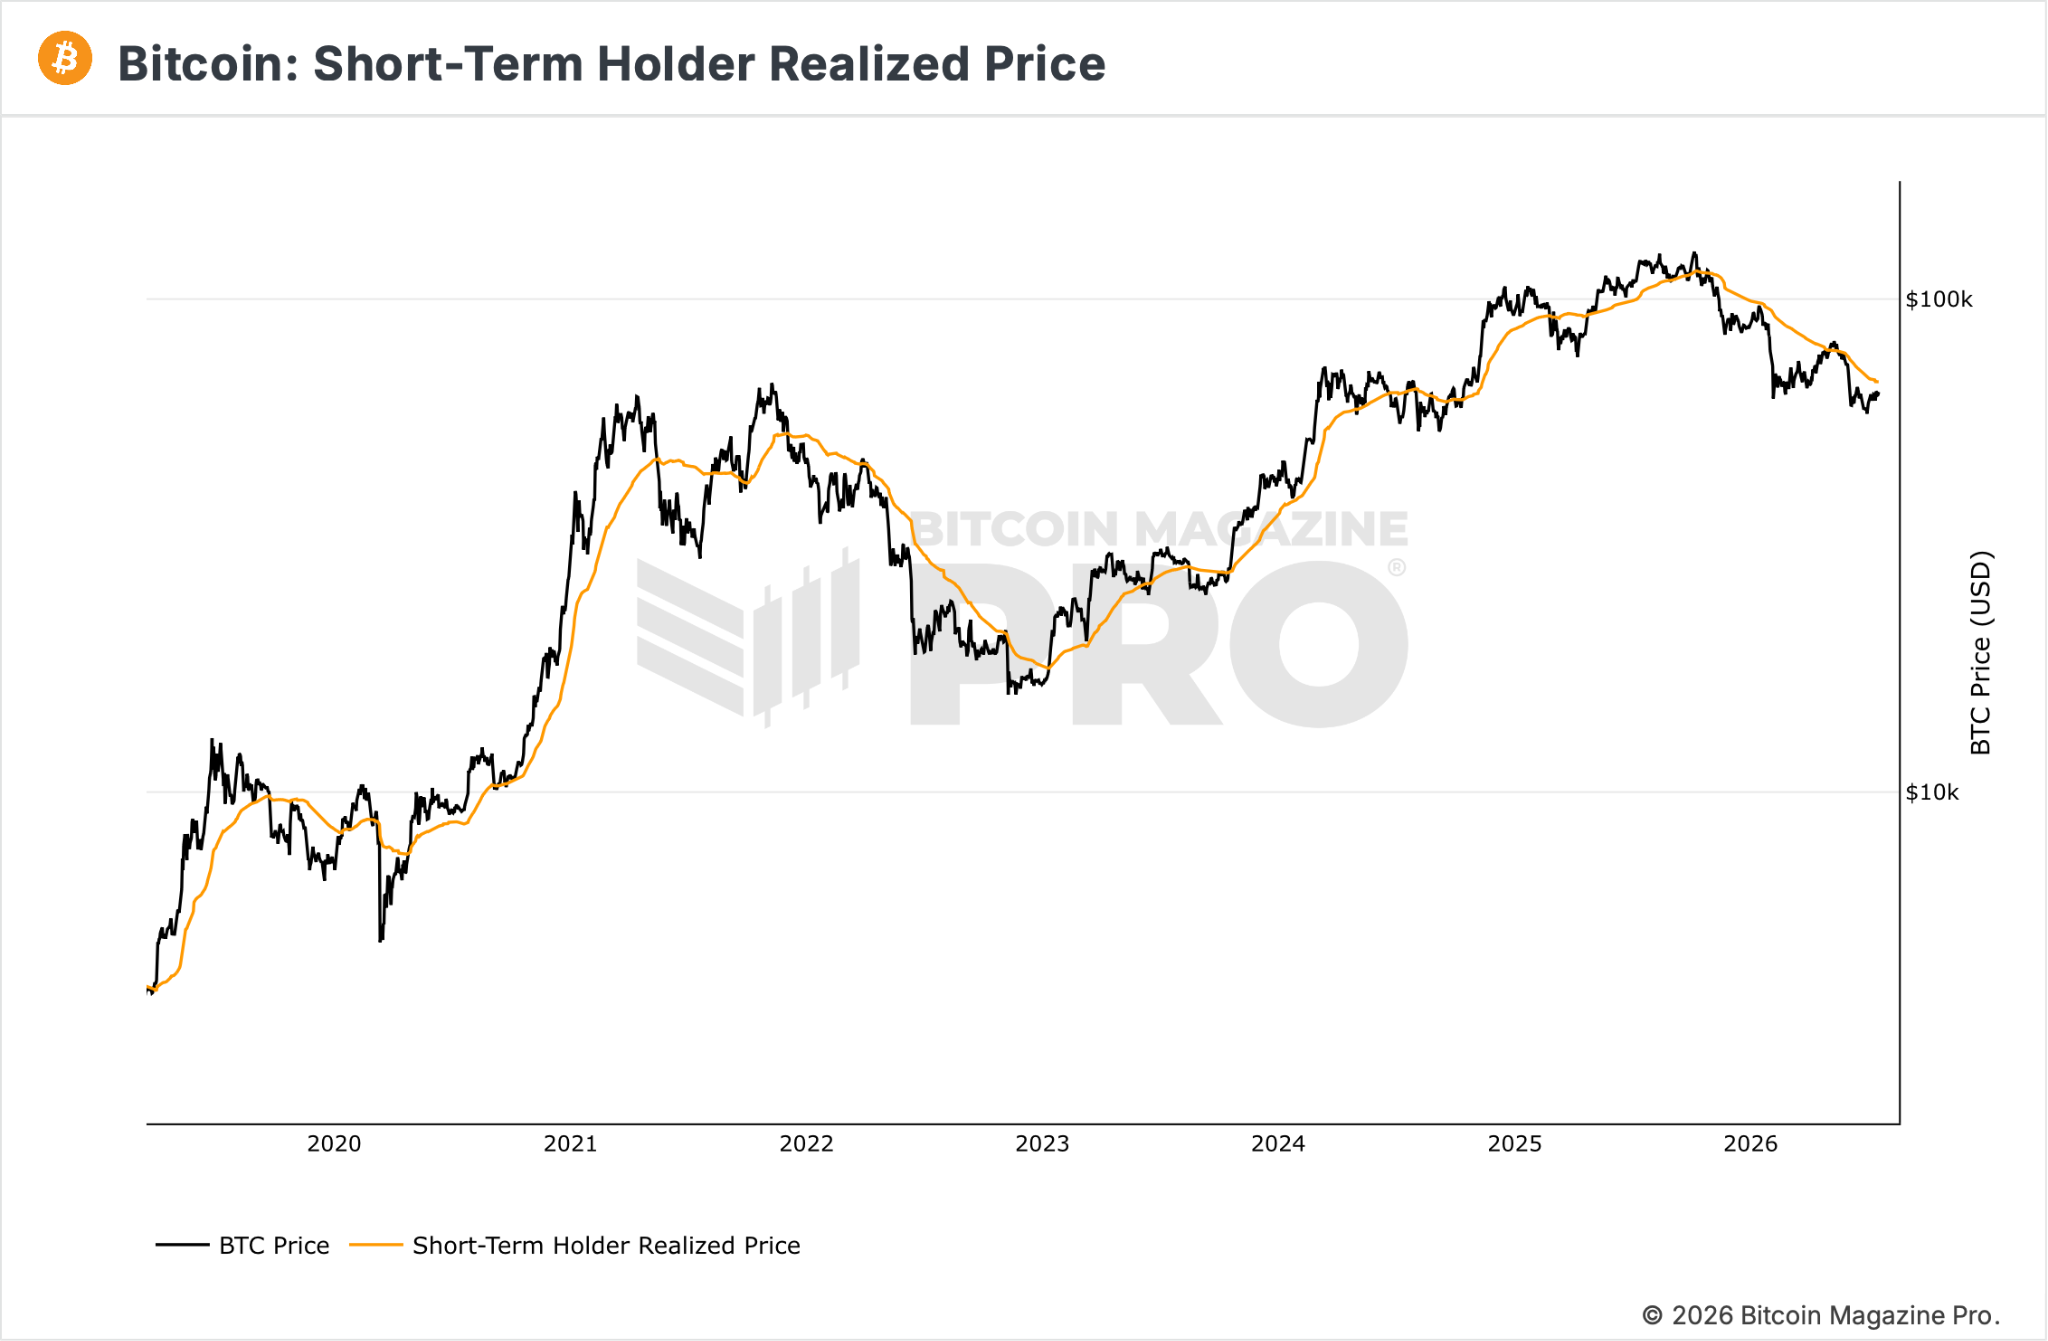
A reclaim of the Short-Term Holder Realised price with strong spot volume driving the move would signal a potential for further price expansion. A rejection would signal a potential retest of the current bear market lows at $57,803.
The prevailing cost-basis roadmap still remains the most precise level for judging the current market regime. At present, BTC is holding its ground above the Realised Price (see Figure 3), which serves as the aggregate network entry and the ultimate floor for this cycle.
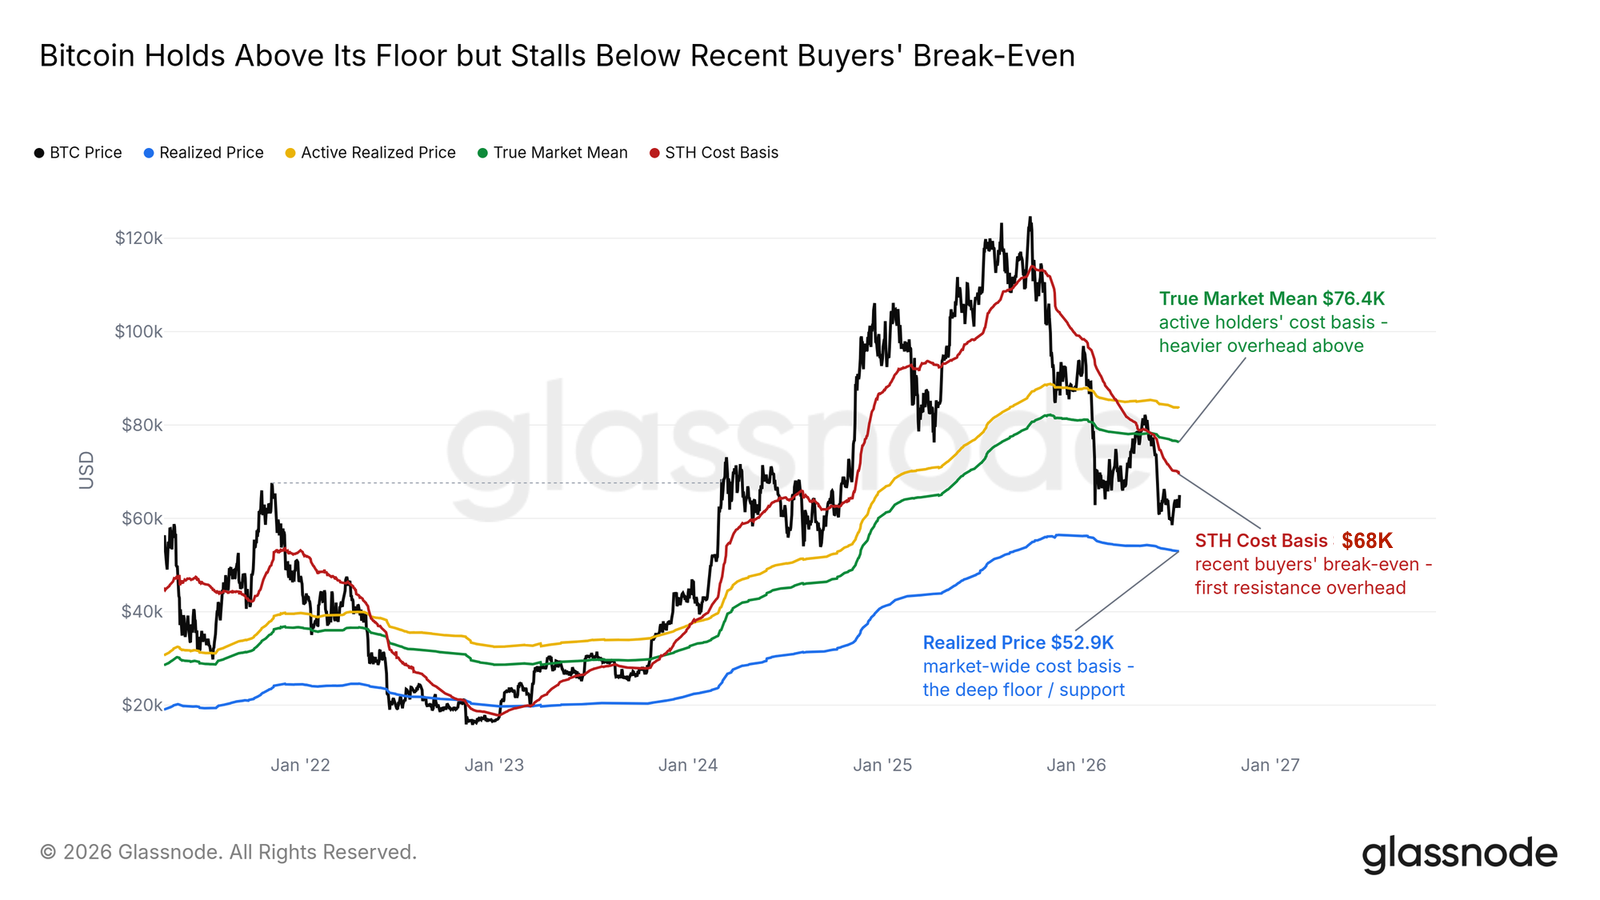
However, the asset remains capped by the Short-Term Holder Cost Basis near $68,000, which is the average cost basis for market participants over the last five months. The current “green July” recovery phase, which has historical precedent is now moving toward that break-even threshold, a zone of immediate overhead resistance where significant clusters of underwater buyers are likely stationed.
A first retest of this resistance zone is expected to catalyse a sharp response, as holders returning to their entry prices are historically the most prone to exiting at breakeven.

Spot Demand Starts to Recover
For a market-wide recovery to sustain, it is imperative that the spot market is the driver of the move. Over the months of May and June 2026, spot trading volumes had dropped significantly and speculative positioning had returned to certain altcoins, with BTC lagging in both volume and percentage of total crypto trading volume. This was mainly due to the waning flows from Bitcoin’s primary demand channels: the Bitcoin ETFs and the Digital Asset Treasury companies, both of which failed to make material bids for the asset.
In the last week, the US spot ETF complex has begun to stabilise, moving from persistent outflows to what is now a fragile equilibrium. BTC ETF market conditions have improved, but they are not yet “healed.”
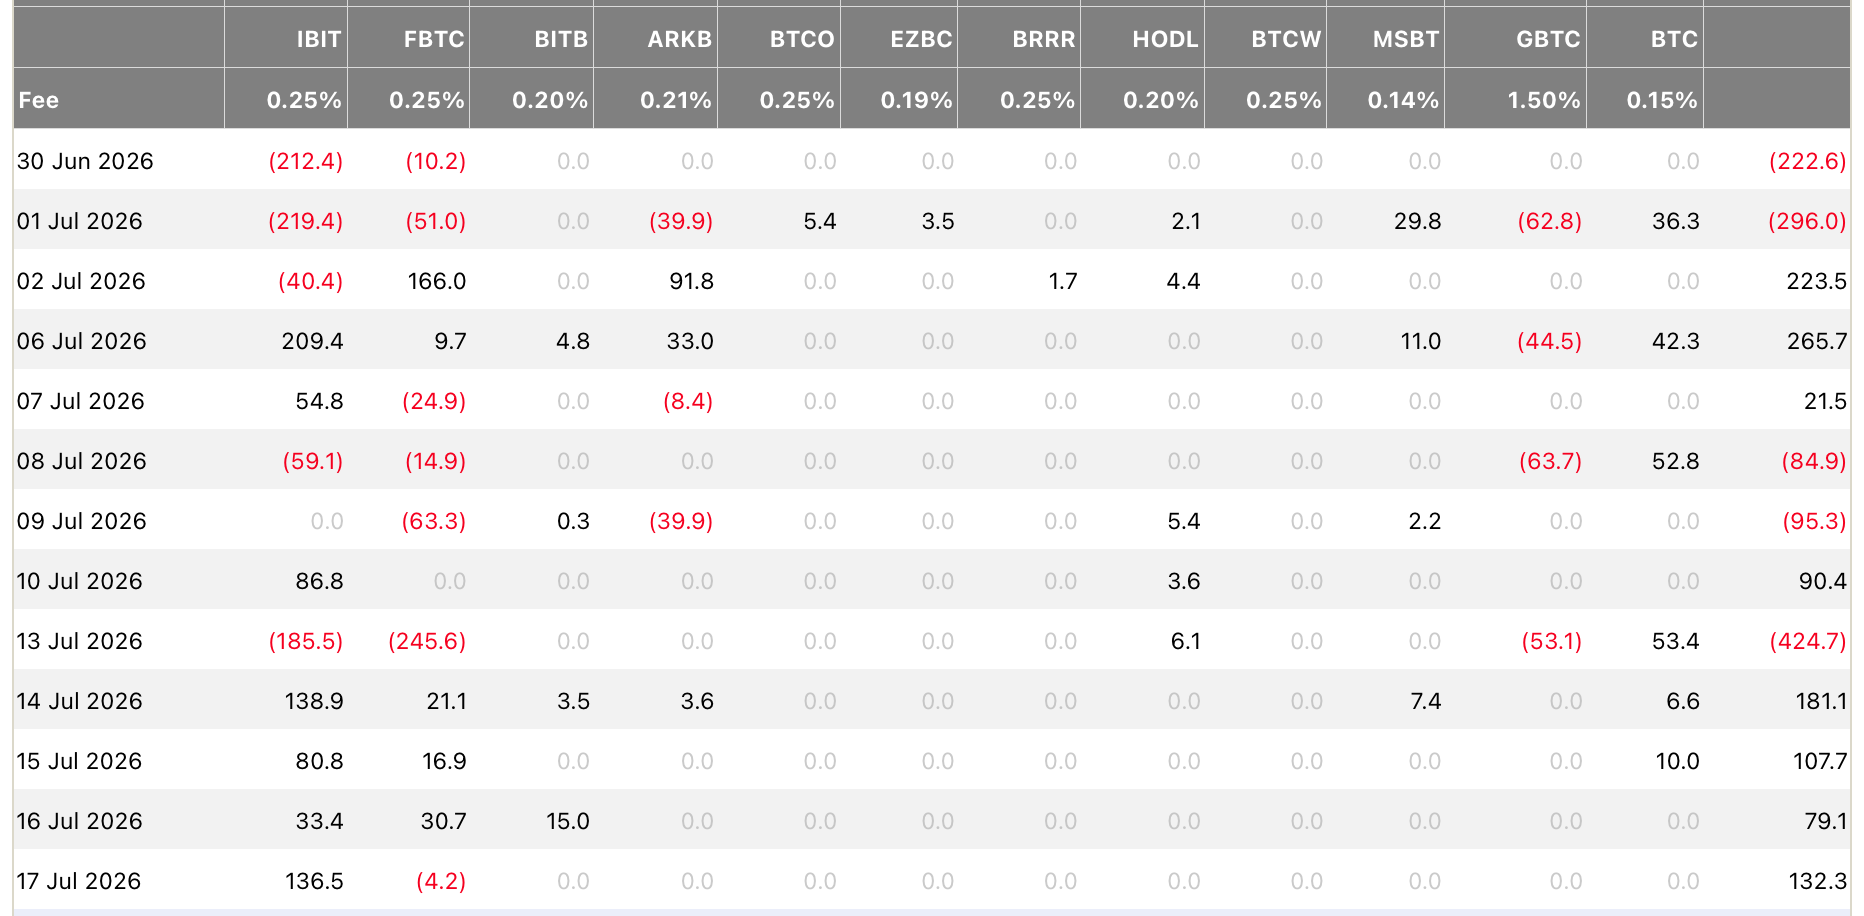
The institutional picture remains nuanced. While the market absorbed recent volatility with four days of inflows totalling $500.2 million, this followed the first session of the week experiencing $424.7 million in outflows, even before the soft inflation print catalysed a market recovery. However, this recovery is heavily concentrated. BlackRock’s IBIT dominated with $204.1 million in intake, while Fidelity’s FBTC faced $181.1 million in outflows.
Excluding IBIT, the broader complex actually shed $128.6 million, underscoring that institutional participation is currently driven by a single dominant issuer rather than a broad-based surge. Until we see diversified inflows, this remains a market where institutional buyers seem to have stopped redeeming, but have yet to fully commit to re-investing.
Bitcoin Dominance Becomes an Important Indicator to Watch
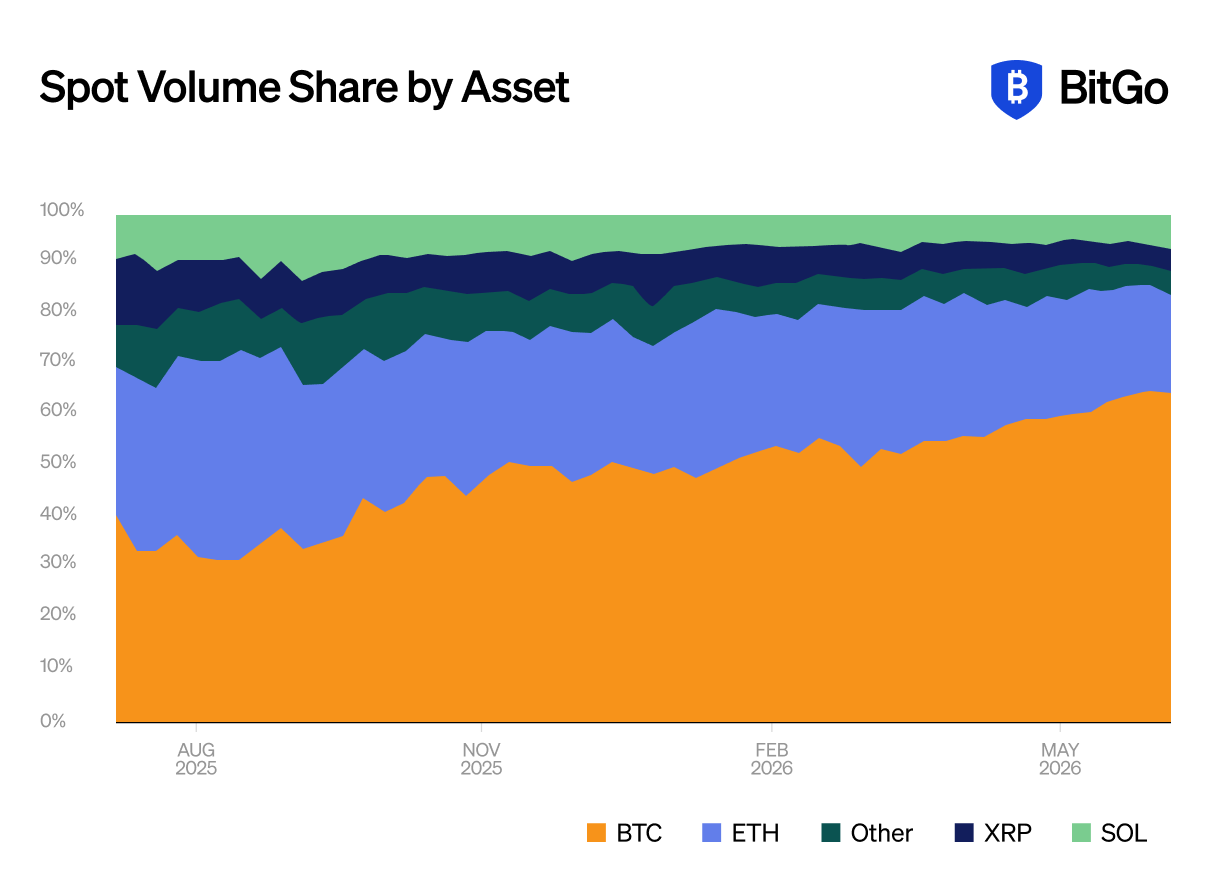
Bitcoin dominance across market cap and volume are both important in assessing the stage of the cycle we are currently in. Typically, BTC trading volumes dominate during late-stage bear markets, with BTC dominance by market cap rising to multi-month or yearly highs during the first uptrend of a new bull cycle.
Presently, BTC dominance in terms of spot market volume has surged from approximately 50 percent in June 2025 to nearly 67 percent, as Ether sheds significant territory, and SOL and XRP retain only marginal market share. This rotation underscores a definitive de-risking phase across the digital asset landscape, with capital flows gravitating toward Bitcoin’s relative safety rather than signalling a broad expansion in risk appetite for altcoins.

General Macro Update
Inflation Cools, But the AI Channel Grows
The first monthly decline in US consumer prices in six years has been reported for June, and on the surface it is the best inflation news of this cycle. Our view is less celebratory, as nearly all the improvement is due to previous declines in energy prices, which have now begun to rise again. The delicate US-brokered ceasefire in the Middle East collapsed in the second week of July, when commercial tankers came under fire in the Strait of Hormuz, triggering the US to resumes strikes on 13 July, and sending oil back above its one-month high.
The two-track framework we set out on 6 July describes US inflation as a contest between two opposing forces. On the first track, falling energy prices are pulling headline inflation down, though that relief lasts only as long as oil keeps flowing through the Strait of Hormuz. On the second, demand from government defence spending, the artificial intelligence (AI) data-centre build-out, and newly proposed tariffs continues to push underlying prices higher, because all three compete for the same inputs: metals, electronics, and machinery. June’s data reflects both tracks with the clearest evidence yet that in the second track, spending on AI infrastructure is now directly lifting the producer prices of computing hardware, and imported computer parts.
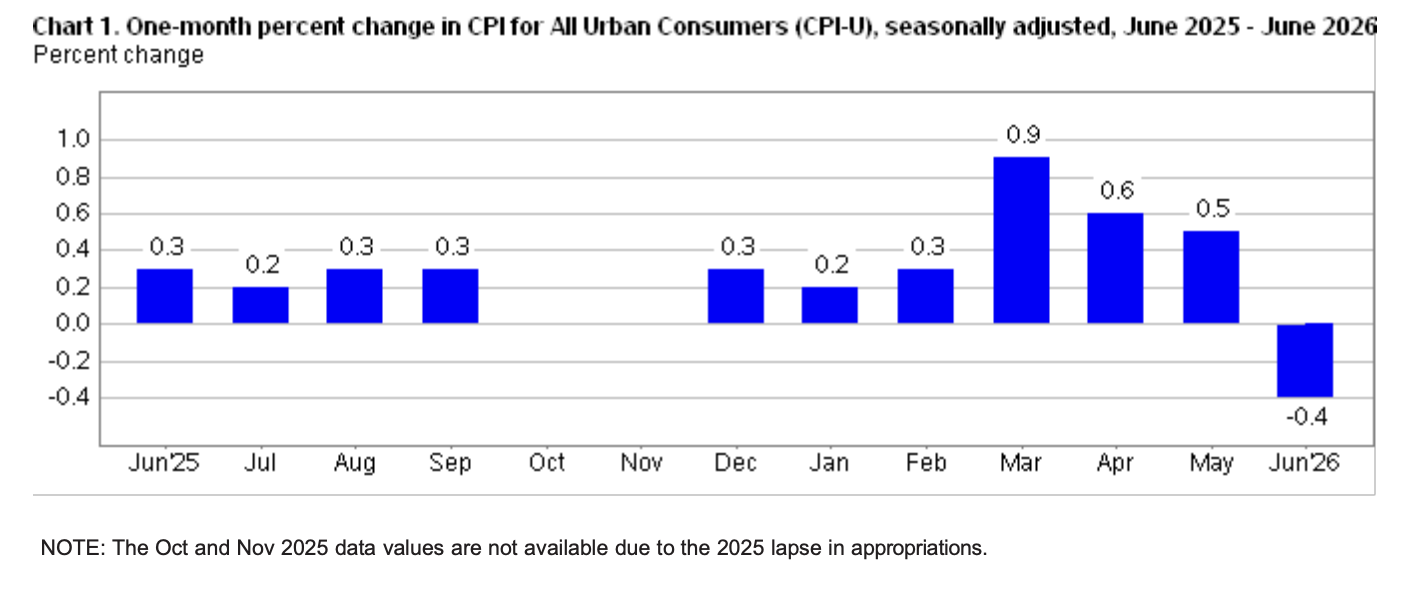
The Consumer Price Index (CPI) fell 0.4 percent in June, the first monthly decline since May 2020 and twice the drop consensus expected. The gasoline index fell 9.7 percent and the broader energy index 5.7 percent, which accounts for most of the headline move.
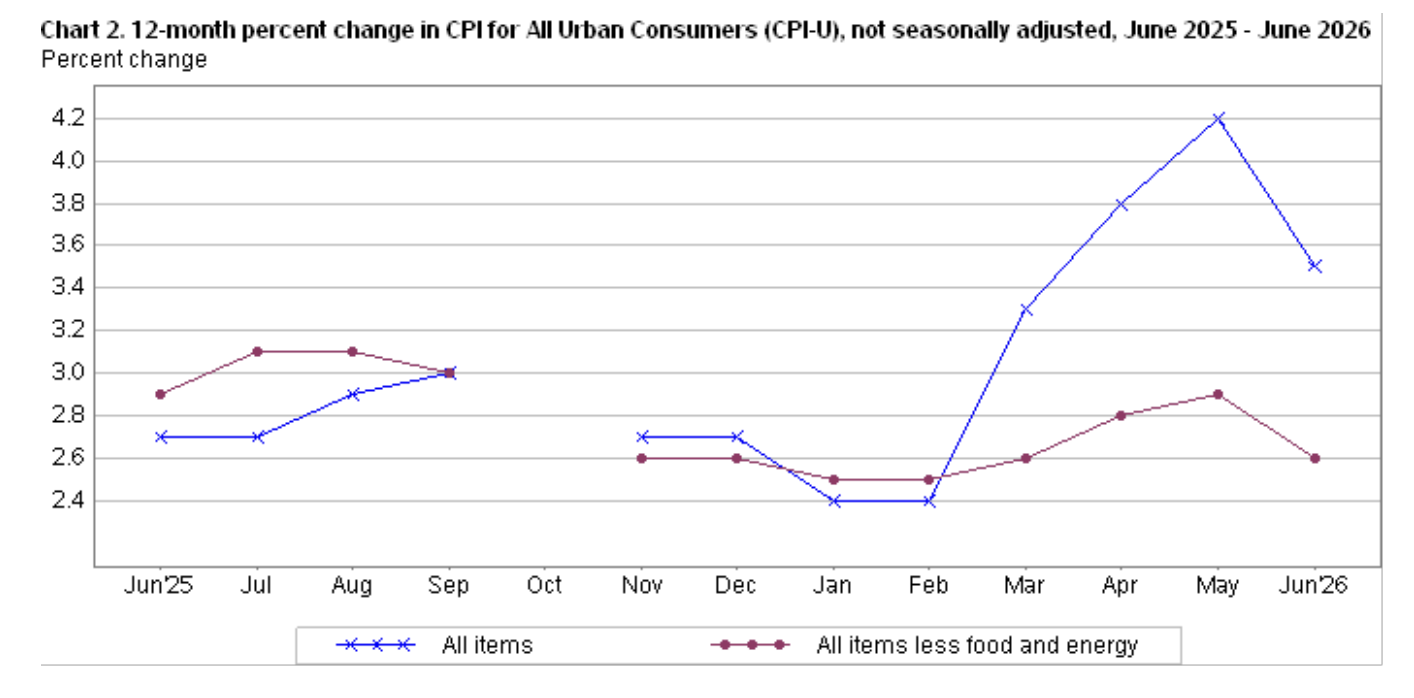
Annual inflation slowed to 3.5 percent from May’s three-year high of 4.2 percent. The detail beneath the headline was more encouraging than the energy arithmetic alone implies. Core prices were flat on the month, core goods fell for a second consecutive month, and services less energy, the series that has carried US inflation for the past two years, was unchanged, its most restrained monthly reading in five and a half years. The annual core rate eased to 2.6 percent from 2.9 percent.
June is the first month this year in which direction, breadth and composition all improved together. The exception is food, which has now risen for three consecutive months and is up 3 percent over the year, roughly one-third above its pre-pandemic trend, a reminder that the categories households see most often stand outside the relief.
The Pipeline Complicates the Same Story
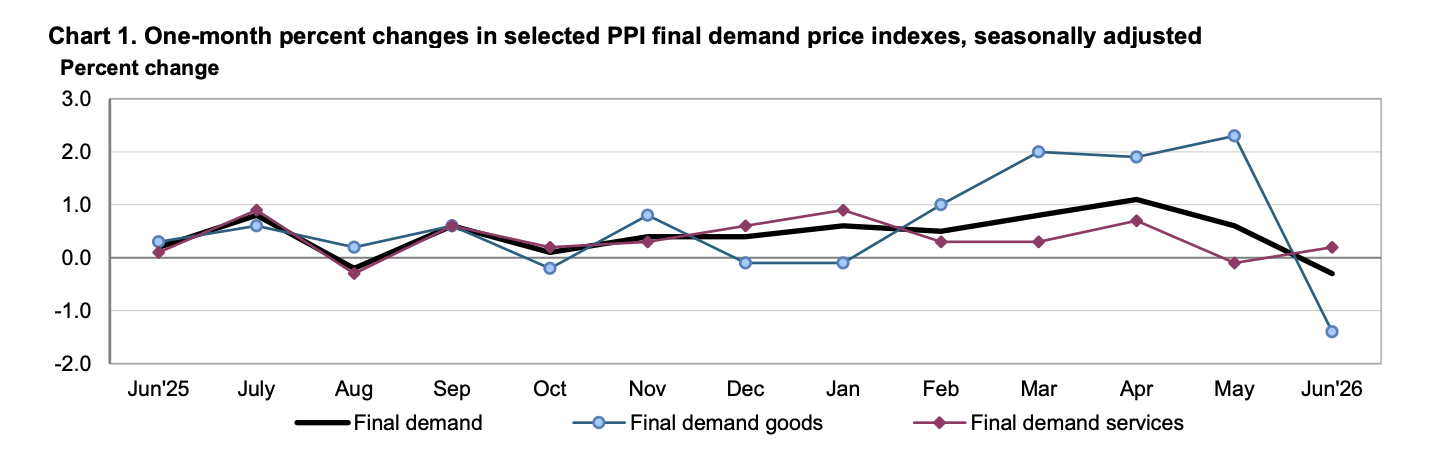
Producer prices confirmed the consumer-level picture. The Producer Price Index for final demand fell 0.3 percent in June, its largest decline in 14 months, where consensus had looked for no change, and May’s initially reported 1.1 percent surge was revised down to 0.6 percent. As with the CPI, cheaper energy did nearly all of the work. The energy pressure that remains is slowly easing.
The complication sits inside core goods. Prices for electronic computers and computing equipment rose 2.5 percent in June alone, a data-centre demand signal that has now appeared in the producer price detail for several months running. When the two-track thesis was advanced on 6 July, the second track was defence and AI capital spending competing for the same scarce inputs. June’s PPI is the cleanest print yet showing that competition landing in measured prices.
Import Prices Confirm the AI Channel
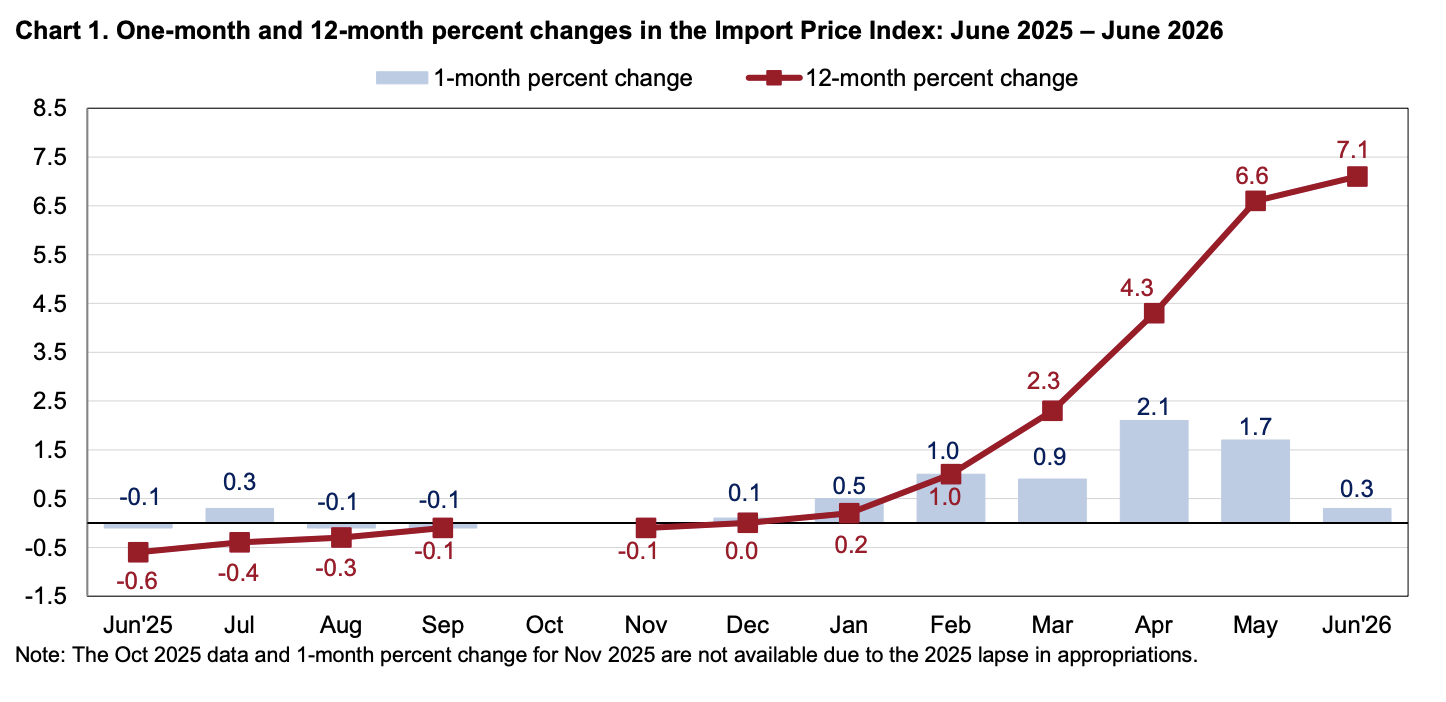
Consensus expected import prices to fall 0.7 percent in June on cheaper energy. They rose 0.3 percent instead, taking the 12-month increase to 7.1 percent, the largest since August 2022. Excluding food and fuels, prices rose 0.4 percent on the month and core imported inflation is running at 4.6 percent year-on-year, led by capital goods. Prices for computer peripherals and parts rose 2.3 percent in June and are up 41 percent over the year. These figures exclude tariff payments themselves, so tariff pass-through arrives on top of them.
The three reports together describe one economy: energy dragging the headline down, while AI investment demand and tariffs push the core the other way. With CPI and PPI in hand, economists estimate core Personal Consumption Expenditures (PCE) inflation rose 0.2 percent in June, easing the annual rate to 3.3 percent from 3.4 percent, progress measured in tenths.
June’s data ruled out a July hike, and markets expect the Fed to hold the funds rate at 3.5-3.75 percent at the 28-29 July meeting. September is another matter. Chairman Kevin Warsh, delivering the Fed’s semiannual Monetary Policy Report to Congress on 15 July, told lawmakers the Committee has “no tolerance for persistently elevated inflation” and “a resolute commitment to restoring price stability,” while giving no signal on how or when he would act.
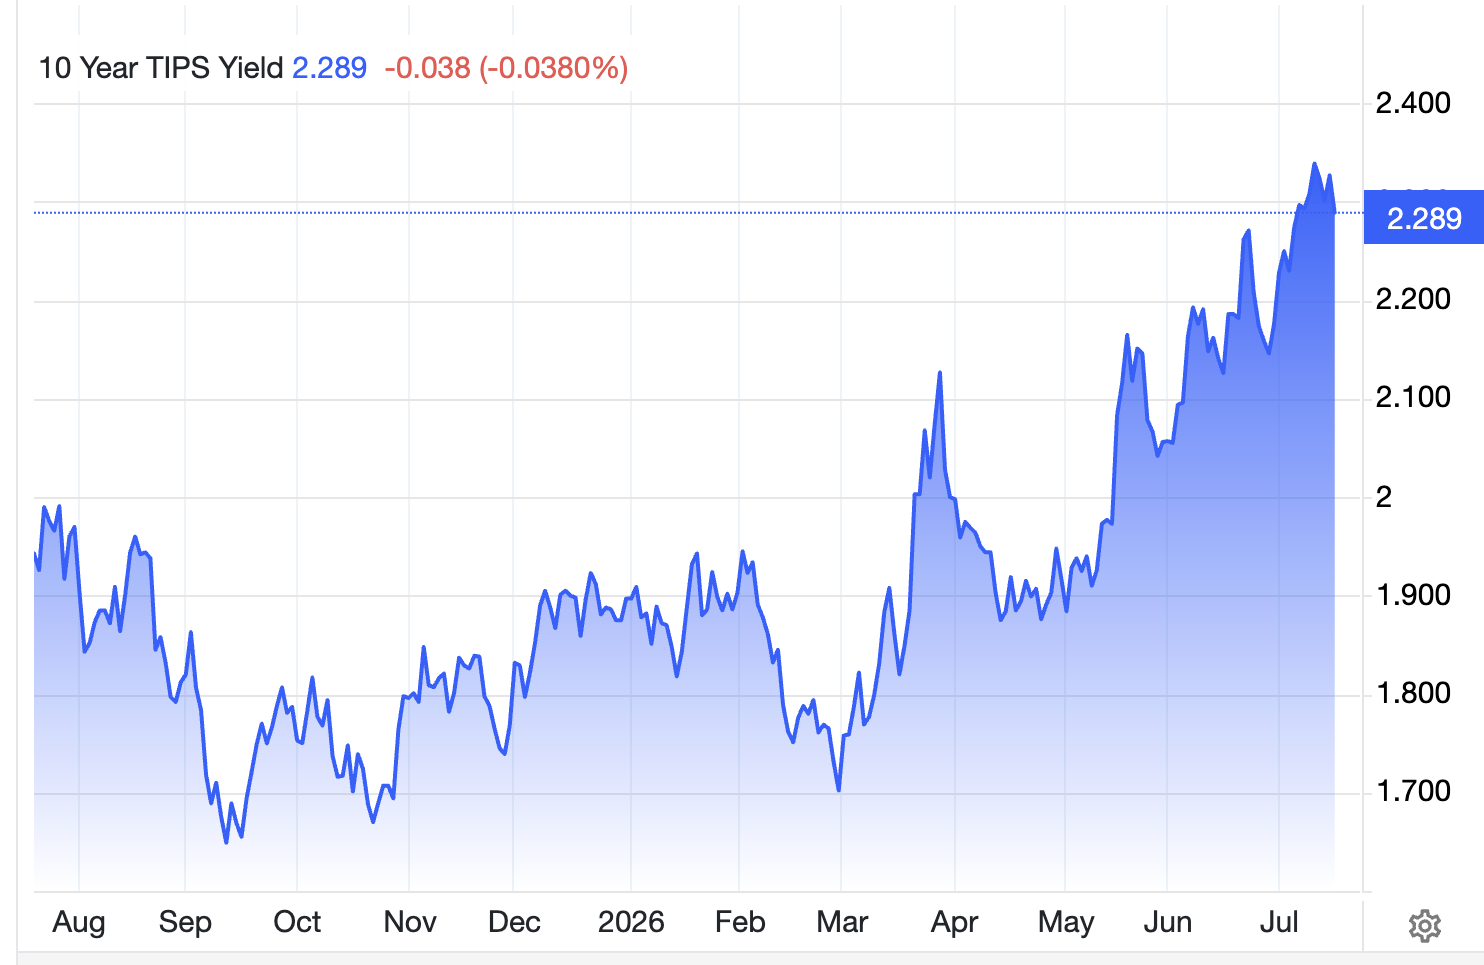
The trapped-hold stance we discussed on 6 July therefore stands. The next move is still more likely a cut than a hike, but it is delayed, and the hike scenario stays credible for as long as the Strait of Hormuz keeps the energy tape hostage. In our last issue of Bitfinex Alpha we committed to checking real yields. The 10-year Treasury Inflation-Protected Securities (TIPS) real yield, the inflation-adjusted interest rate that matters most for our bitcoin call, stood at 2.28 percent on 17 July. Our line in the sand is 2.5 percent: a sustained move above that level would break the bitcoin tailwind call. We are not there yet, but the yield has risen for three issues in a row. The trend is moving against us even if the level is not.

Consumers Bend, Housing Breaks
The same week that brought relief on inflation also showed an economy moving at two different speeds. Households continued to spend despite the US-Iran war and the swings in oil prices it has driven. After adjusting for inflation, consumer spending was even stronger than the headline figures suggested. Housing, by contrast, is deteriorating on every margin builders can report. The gap between the two is not an anomaly to be averaged away. It is the mechanism through which the current rate regime is working, and it defines the asymmetry the Fed faces into September.
The Consumer Is Stronger Than the Headline Shows
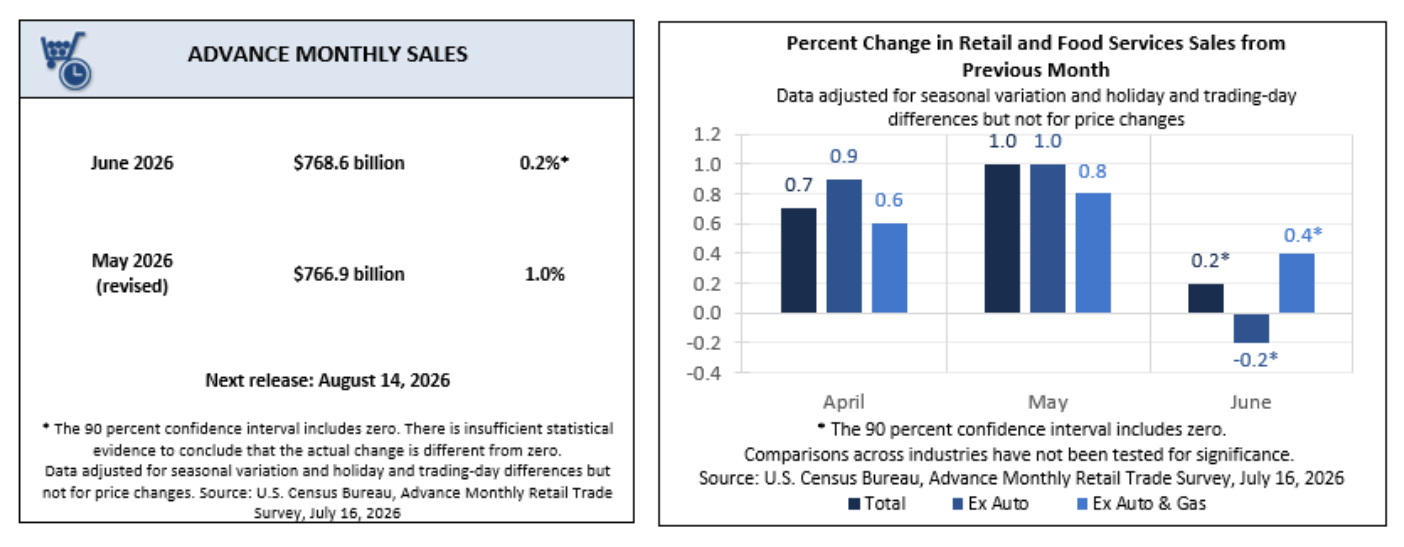
Headline retail sales rose 0.2 percent in June, but this figure understated the strength of consumer spending in two ways. Lower pump prices caused spending at gasoline stations to fall 5.3 percent, which dragged down the nominal total. Meanwhile, the control group rose 0.5 percent. This measure excludes gasoline, autos and building materials and feeds directly into gross domestic product (GDP). Set against a month in which consumer prices fell 0.4 percent, real underlying spending was firmer still. The strength was narrow, concentrated in autos, where cheaper fuel supported demand, and online sales flattered by Amazon’s July promotional event falling in June, and both drivers carry seasonal fingerprints.
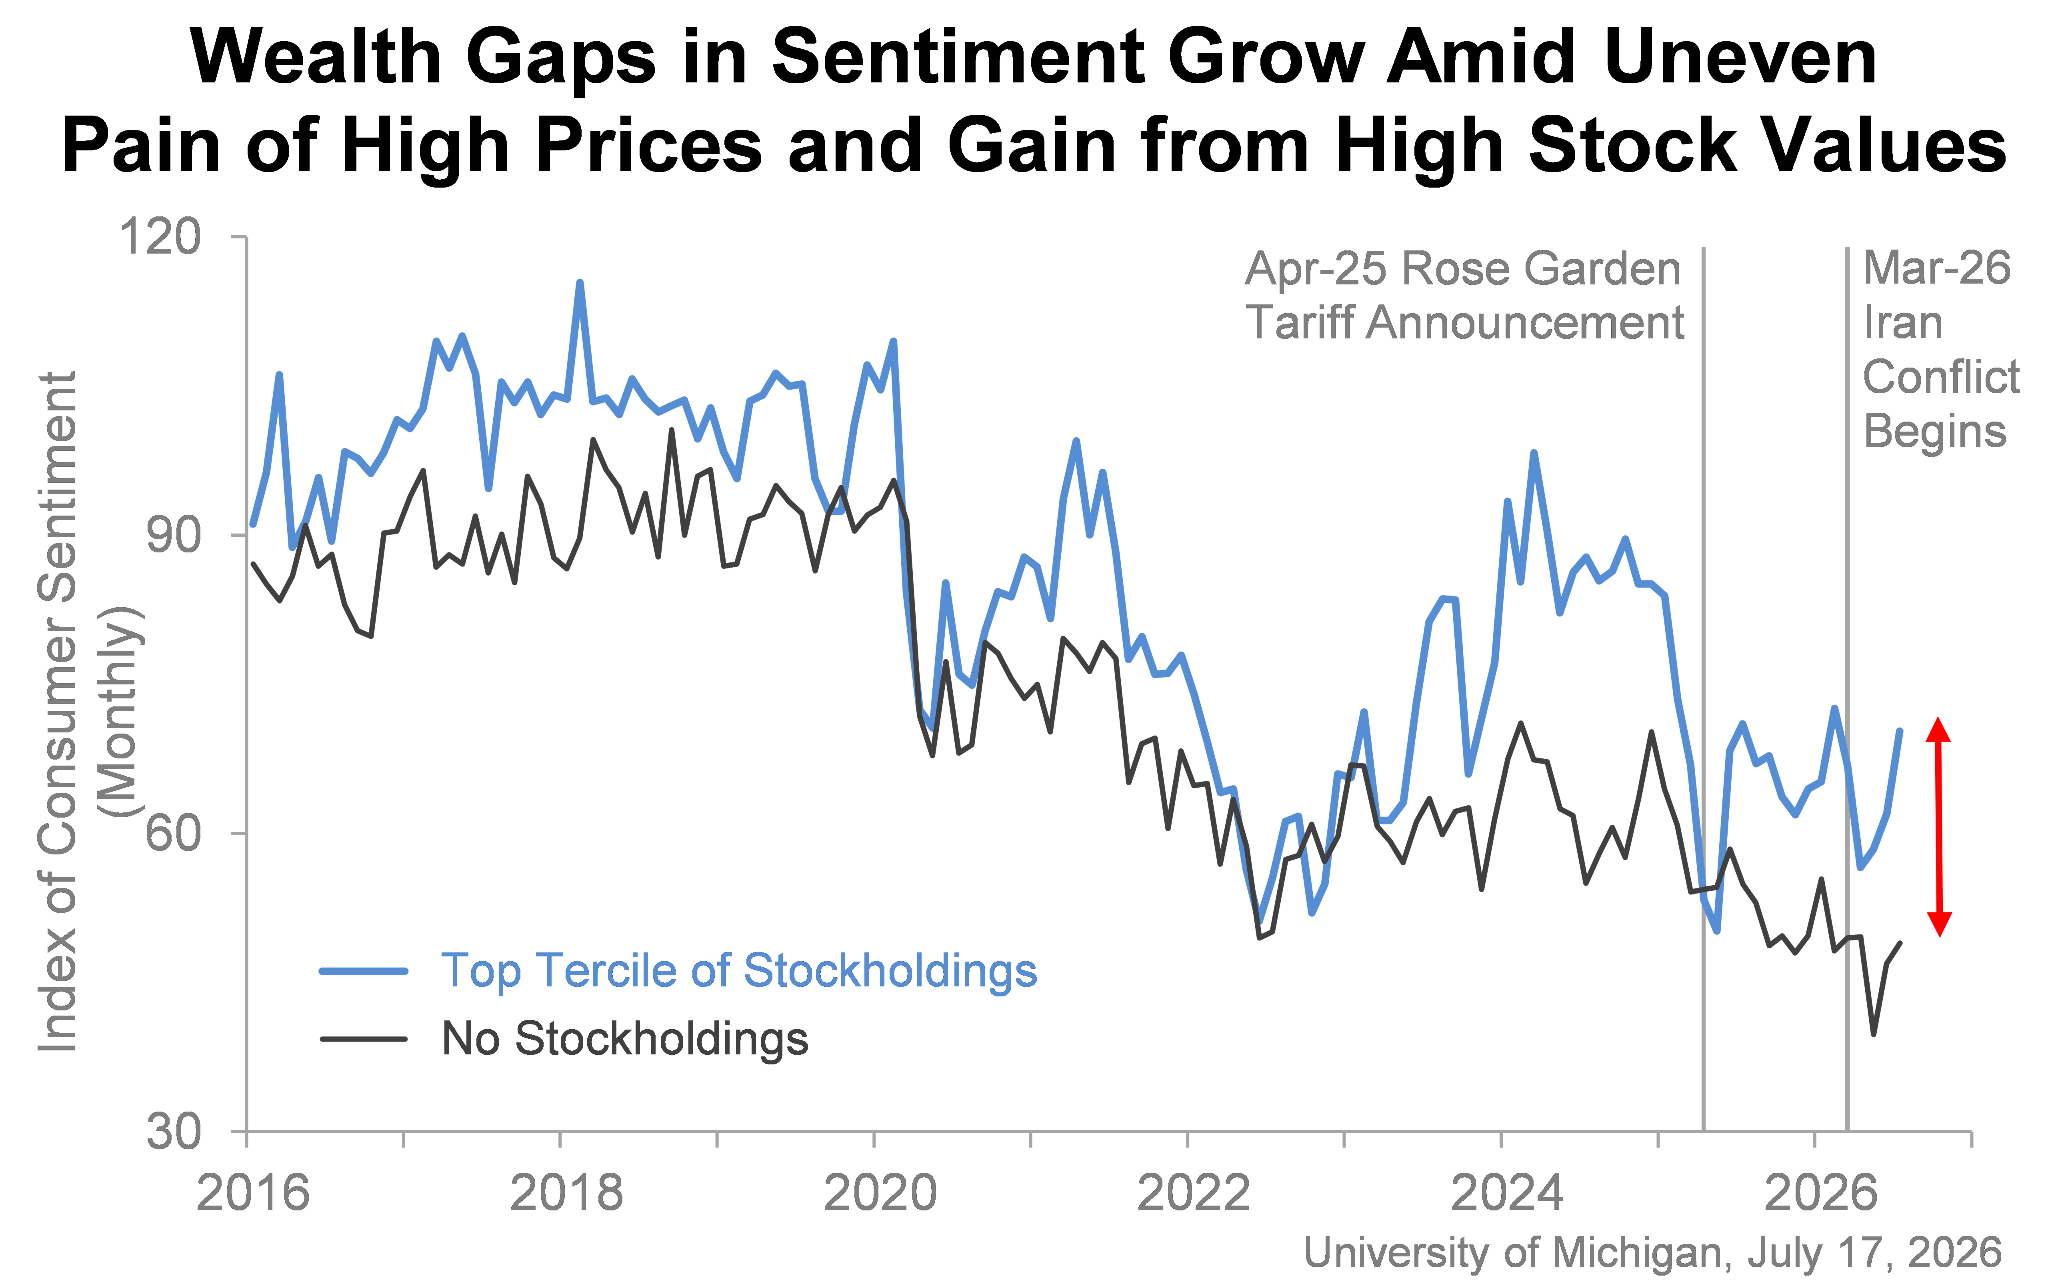
Even so, a consumer who keeps spending through an oil shock and a war-dominated news cycle is a consumer with income behind them. Consumer sentiment improved in early July across all age, income and party cohorts, though more than 70 percent of the University of Michigan’s interviews predated the collapse of the ceasefire, so it is fair to say that the early optimism came from a world that now no longer exists. The two-track consumer framework we have discussed holds: aggregate resilience is being financed disproportionately by households insulated from the pump price and the mortgage rate.


Builder confidence tells the demand side. The NAHB/Wells Fargo Housing Market Index fell two points to 34 in July and has now spent 15 consecutive months below 40, the longest such stretch since 2012. Thirty-seven percent of builders cut prices in July, up from 35 percent in June and 32 percent in May, and 63 percent offered sales incentives, the 16th straight month at or above 60 percent. The supply side confirms it. Single-family starts fell for a third consecutive month to an 895,000 annual rate, and single-family permits, the forward-looking series, dropped 2.4 percent to 871,000, a 10-month low. The headline jump in total starts to 1.427 million units is a 76.3 percent surge in the volatile multi-family segment and should be discounted accordingly.
Behind all of it sits the financing channel: the 30-year fixed mortgage rate averaged 6.55 percent this week, an 11-month high, up nearly 60 basis points since the February strikes on Iran repriced the long end. With unsold new-home inventory back near levels last seen in late 2007, builders have no pricing power and buyers have no urgency. The newly enacted housing legislation may eventually ease the supply constraints we flagged in May, but it’s zoning and review reforms work on a multi-year clock, not a monthly one.
The Offsets Keeping Growth Near Two Percent
The reason the housing downturn is not a growth downturn is that the investment cycle is being carried elsewhere. Manufacturing output was flat in June but grew at a 4.7 percent annualised rate across the second quarter, the fastest in five years, supported by the AI build-out and by firms restocking inventories ahead of conflict-related supply risk. Goldman Sachs nudged its second-quarter GDP tracking estimate up to 2.5 percent on the week’s data. This is the resilient-growth, sticky-inflation frame that replaced our stagflation-lite thesis last issue, and the week’s releases fit it cleanly: consumption firm, business equipment investment strong, residential investment a persistent modest drag.
The Divergence Is the Fed’s Problem Now
Housing is the most rate-sensitive sector in the economy, and it is already two years into a downturn. The sectors generating what inflation pressure remains, AI capital spending above all, are less exposed to interest rates, because the largest hyperscalers still fund the bulk of their build-out from operating cash flow. That insensitivity is eroding at the margin, as a fast-growing share of the wider build-out leans on corporate bonds, private credit and off-balance-sheet data-centre vehicles. Even so, a hike in September would land far harder on housing than on a capex cycle still anchored by cash-rich balance sheets. That asymmetry is why we describe the Fed’s hold, at the July meeting and the ones that follow, as trapped rather than comfortable. It is also why our base case remains that when the Fed finally moves, the next change will be a cut rather than a hike, even as Warsh’s rhetoric points the other way.
For bitcoin, we keep the tailwind view we adopted on 6 July. The Fed is boxed in on three sides: it cannot control the energy shock, it cannot offset the government’s spending, and it cannot afford to put more pressure on an already weak housing market. A central bank with that little room to move tends to be good for hard assets such as bitcoin and less kind to bonds. The one warning sign is the rise in real yields flagged above, and we are watching it closely.
What Would Prove This Wrong
Our falsifiers are the same as last issue, with tighter thresholds:
Bitcoin tailwind: fails if the 10-year TIPS real yield holds above 2.5 percent on a sustained basis. It has risen for three issues in a row, making this the falsifier under most pressure.
Inflation reprieve: fails if services less energy, which was flat in June, re-accelerates to 0.3 percent or more for two consecutive months, or if core goods start rising again as the AI and tariff channels overwhelm the energy relief.
Resilient consumer: fails if the retail control group turns negative for two consecutive months, which would tell us June’s strength was Prime Day and cheap gasoline rather than income.
Trapped hold: fails if the Fed hikes in September and housing indicators do not deteriorate further in response, which would mean housing is less rate-bound than we believe.
Energy leg: re-opens if Brent sustains above $90 per barrel as the Strait of Hormuz disruption extends, in which case June’s relief becomes ancient history.