

Issue #213:
BTC Holds Its Range Under Pressure
Bitcoin Holds Firm as Macro Risks Persist
Bitcoin Holds Firm as Macro Risks Persist
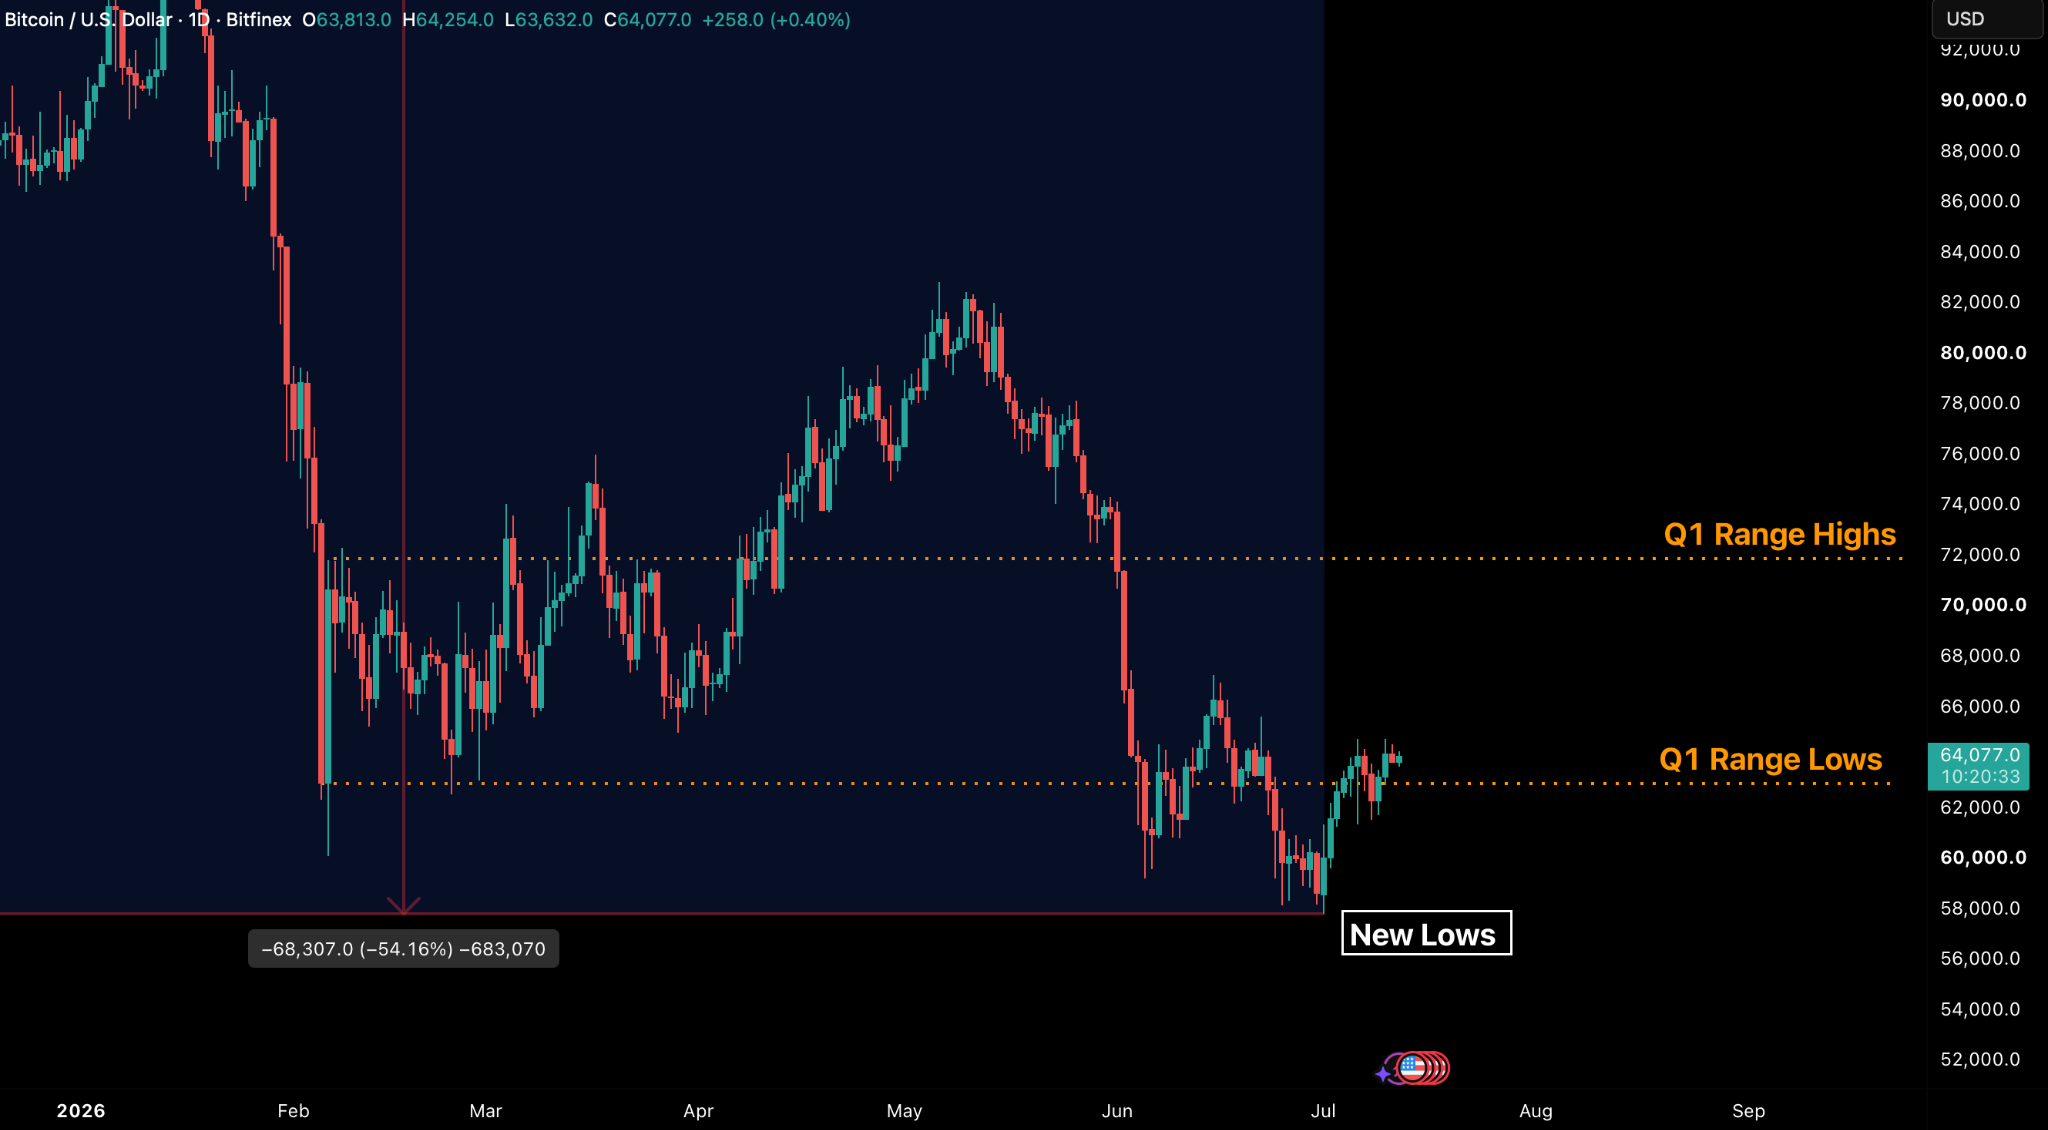
Bitcoin was tested from every direction last week, with the largest sale in Strategy’s history, renewed conflict in the Middle East and continued divisions within the Federal Reserve. However, the asset still managed to maintain its range within a $3,400 corridor between $61,300 and $64,700. US spot Bitcoin ETFs recorded $197.4 million of net inflows, the first positive week in ten, led by IBIT, although the 30-day trend still shows a market in contraction and institutional demand has yet to find its floor.
On a cost basis, the aggregate Realised Price near $54,000 acts as a structural floor, while the Short-Term Holder Realised Price near $72,200 acts as the immediate resistance level. With June CPI due on 14 July and Hormuz shipping negotiations unresolved, Bitcoin remains a macro-dependent market in which July’s seasonal strength stays secondary to the data.
The US economy enters the second half of 2026 with growth intact but constrained by persistent inflation, restrictive interest rates and geopolitical uncertainty. Falling oil prices are easing the immediate energy shock, supporting household purchasing power and giving the Federal Reserve room to keep rates unchanged rather than tighten further. At the same time, artificial intelligence investment, resilient consumer spending and a broadly stable labour market continue to support economic activity, with full-year US growth expected to remain near 2 percent.
Globally, central banks are increasingly shifting their focus from the temporary oil shock back towards domestic inflation, growth and currency risks. Markets are also looking through the decline in energy prices, but structurally higher borrowing costs and persistent fiscal pressures suggest that the previous low-rate regime is unlikely to return soon.
For risk assets, the combination of gradual disinflation, a Federal Reserve on hold and elevated fiscal uncertainty remains supportive of Bitcoin and other hard assets, provided renewed energy disruption or persistent core inflation does not force policymakers back towards tighter monetary policy.

Market Signals
Bitcoin Maintains Its Macro-Dependent Status Quo
Bitcoin was tested from every direction at once last week, and still managed to maintain its trading range. The largest Bitcoin sale in Strategy’s history, reopened conflict in the Middle East, and continued divisions within the Federal Reserve were all absorbed inside a $3,400 corridor of between $61,300 and $64,700. Crude oil, in contrast, climbed more than 10 percent between 7 and 9 July before retracing.
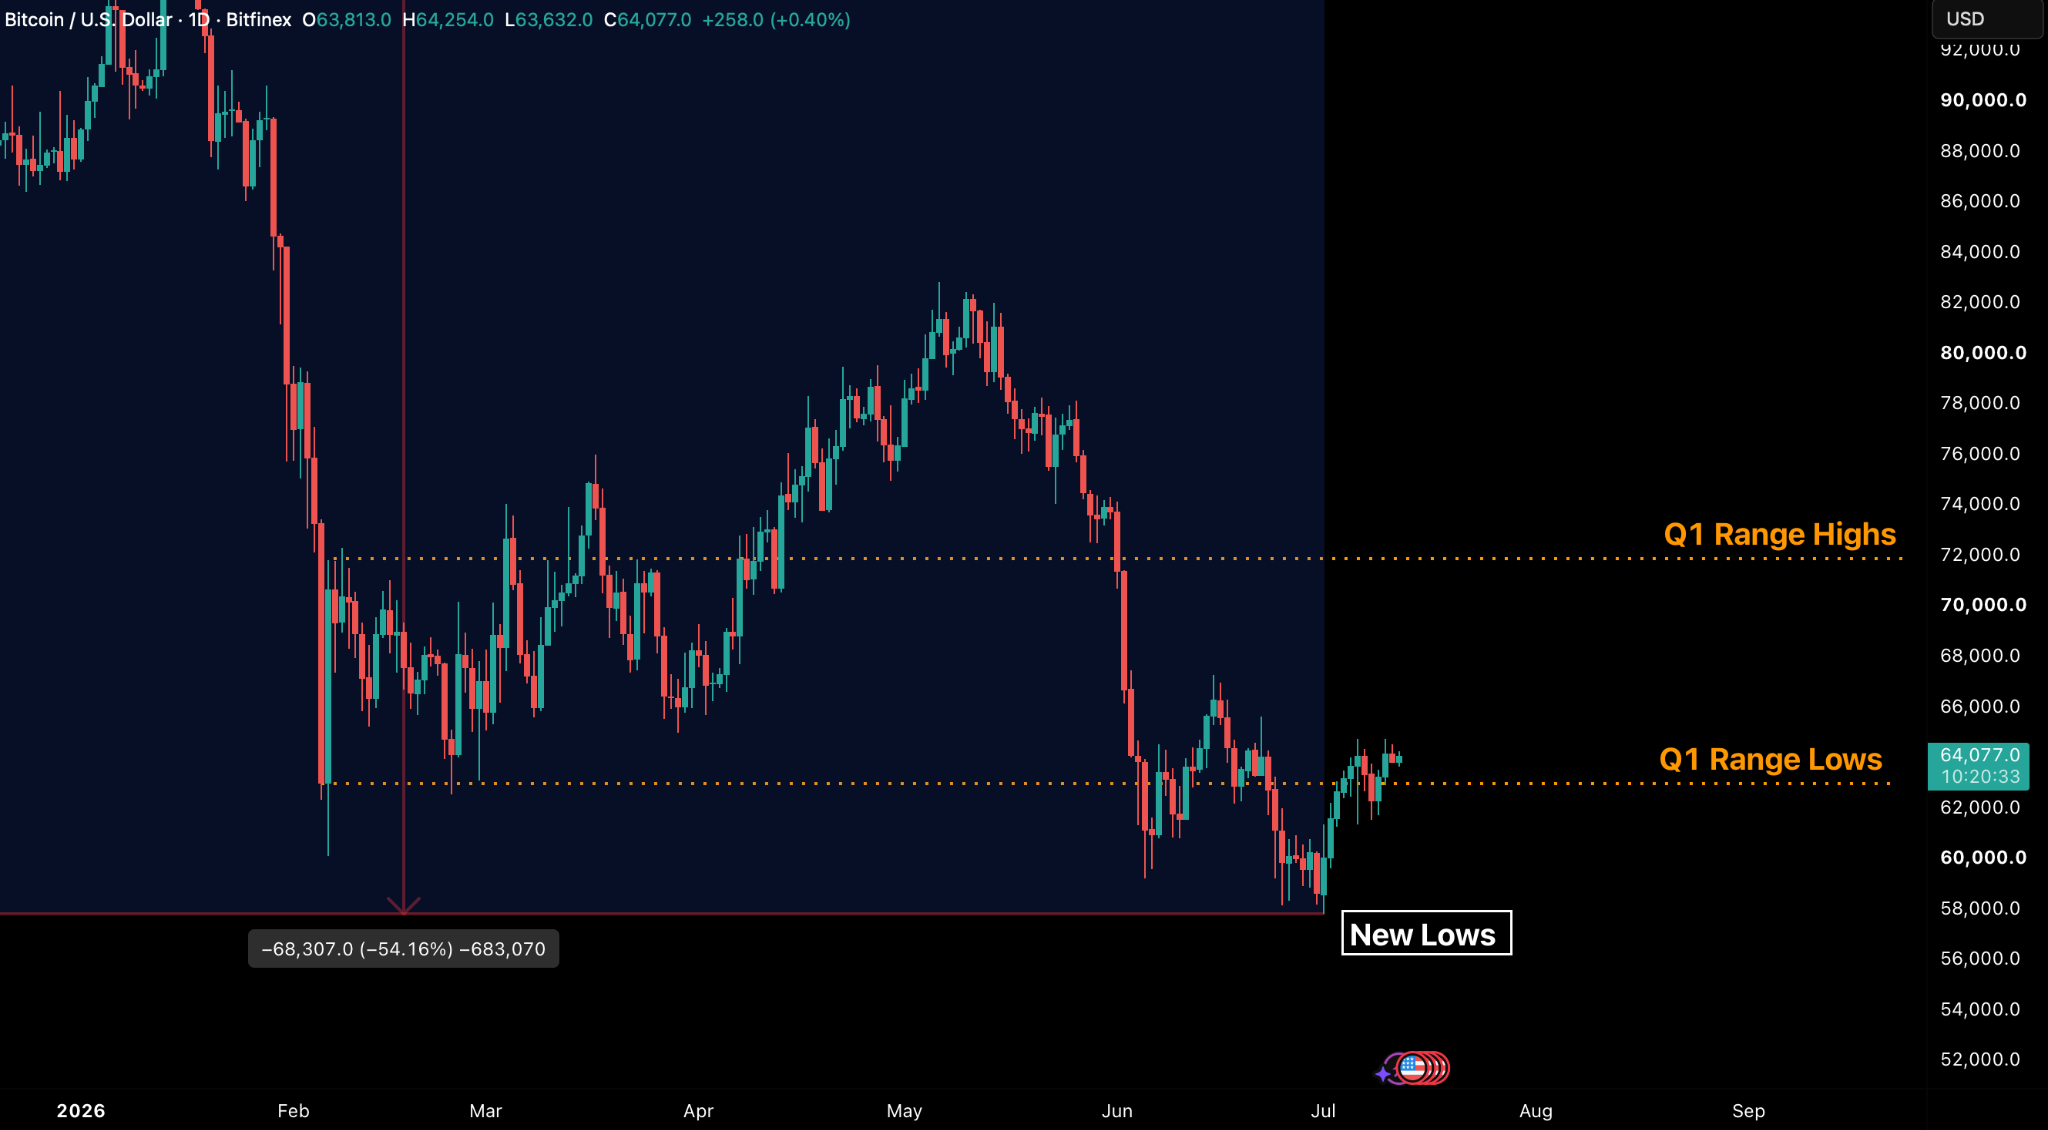
There was a week of pressure across the cross-asset tape last week. Bitcoin, which had gained as much as 6.84 percent on the week prior, retraced over 5 percent on 8-9 July to a post Middle East re-escalation low of $61,529.
The drop came alongside similar falls in the S&P 500 and Euro Stoxx indices, suggesting that BTC continues to trade in close alignment with broader risk assets, but with more volatility.
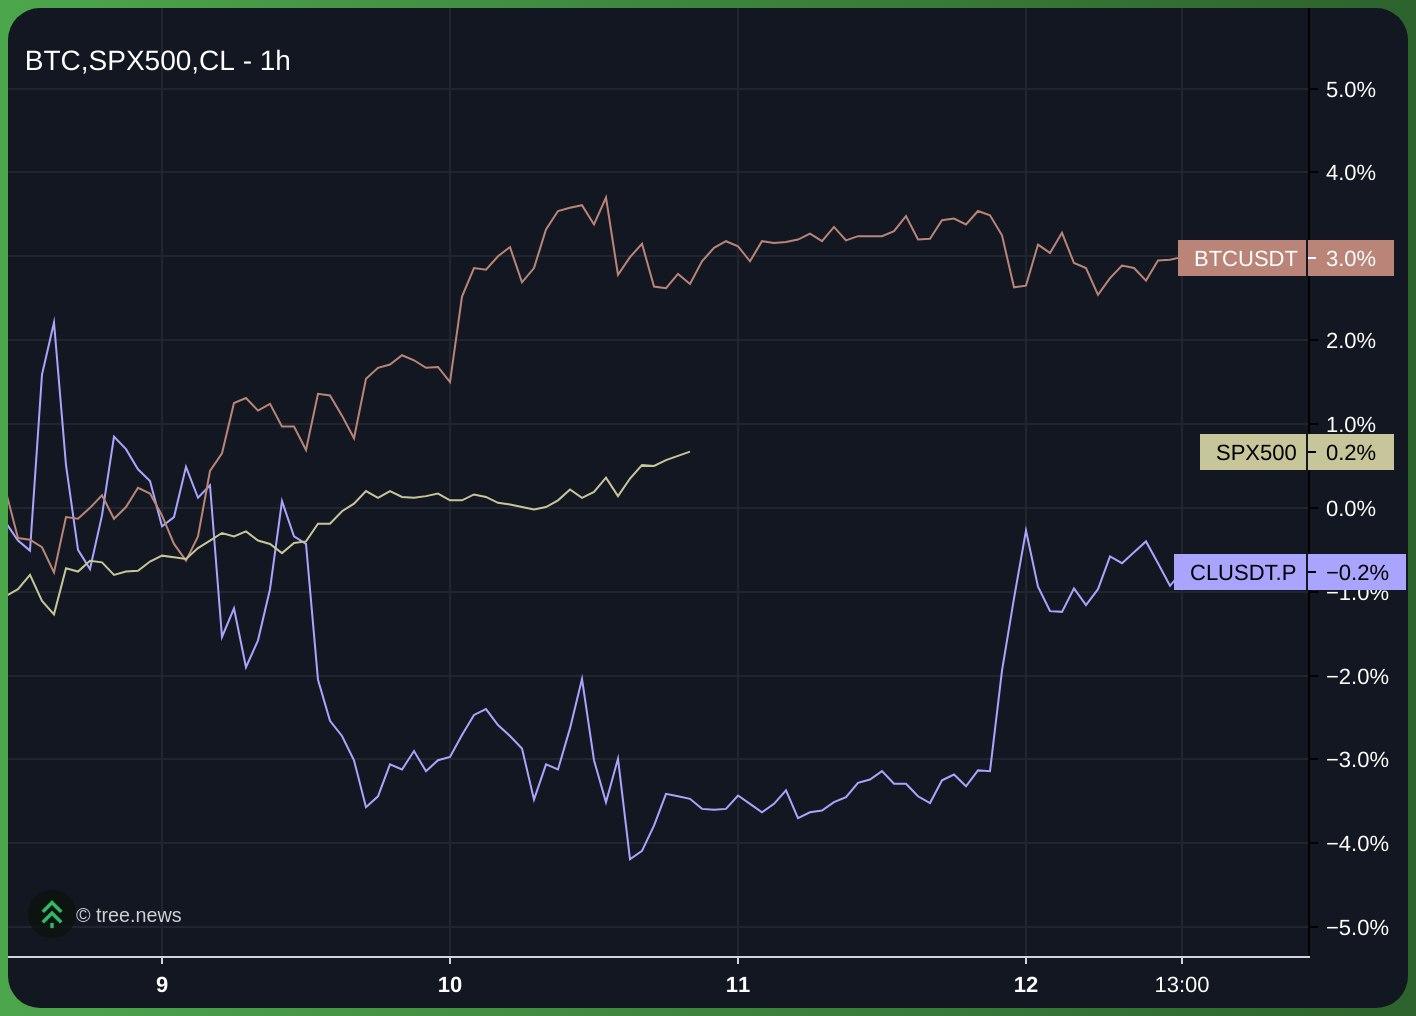
The primary risk-off driver of the week came as markets had to absorb resumed US strikes on Iran and divided FOMC minutes, causing BTC to close 1.7 percent lower on 8 July with a $61,529 daily low, but then managed to erase its decline in the following 48 hours. Equity markets were more stable, with the S&P 500 edging up 0.4 percent on 10 July, but while Bitcoin displayed higher sensitivity to this news, it also demonstrated resilience as it rapidly recovered.
ETF Flows Turn Positive
The ETF complex in fact recorded its first positive week in ten, and inflows arrived in the same week the market absorbed the largest Bitcoin sale ever made by Strategy.
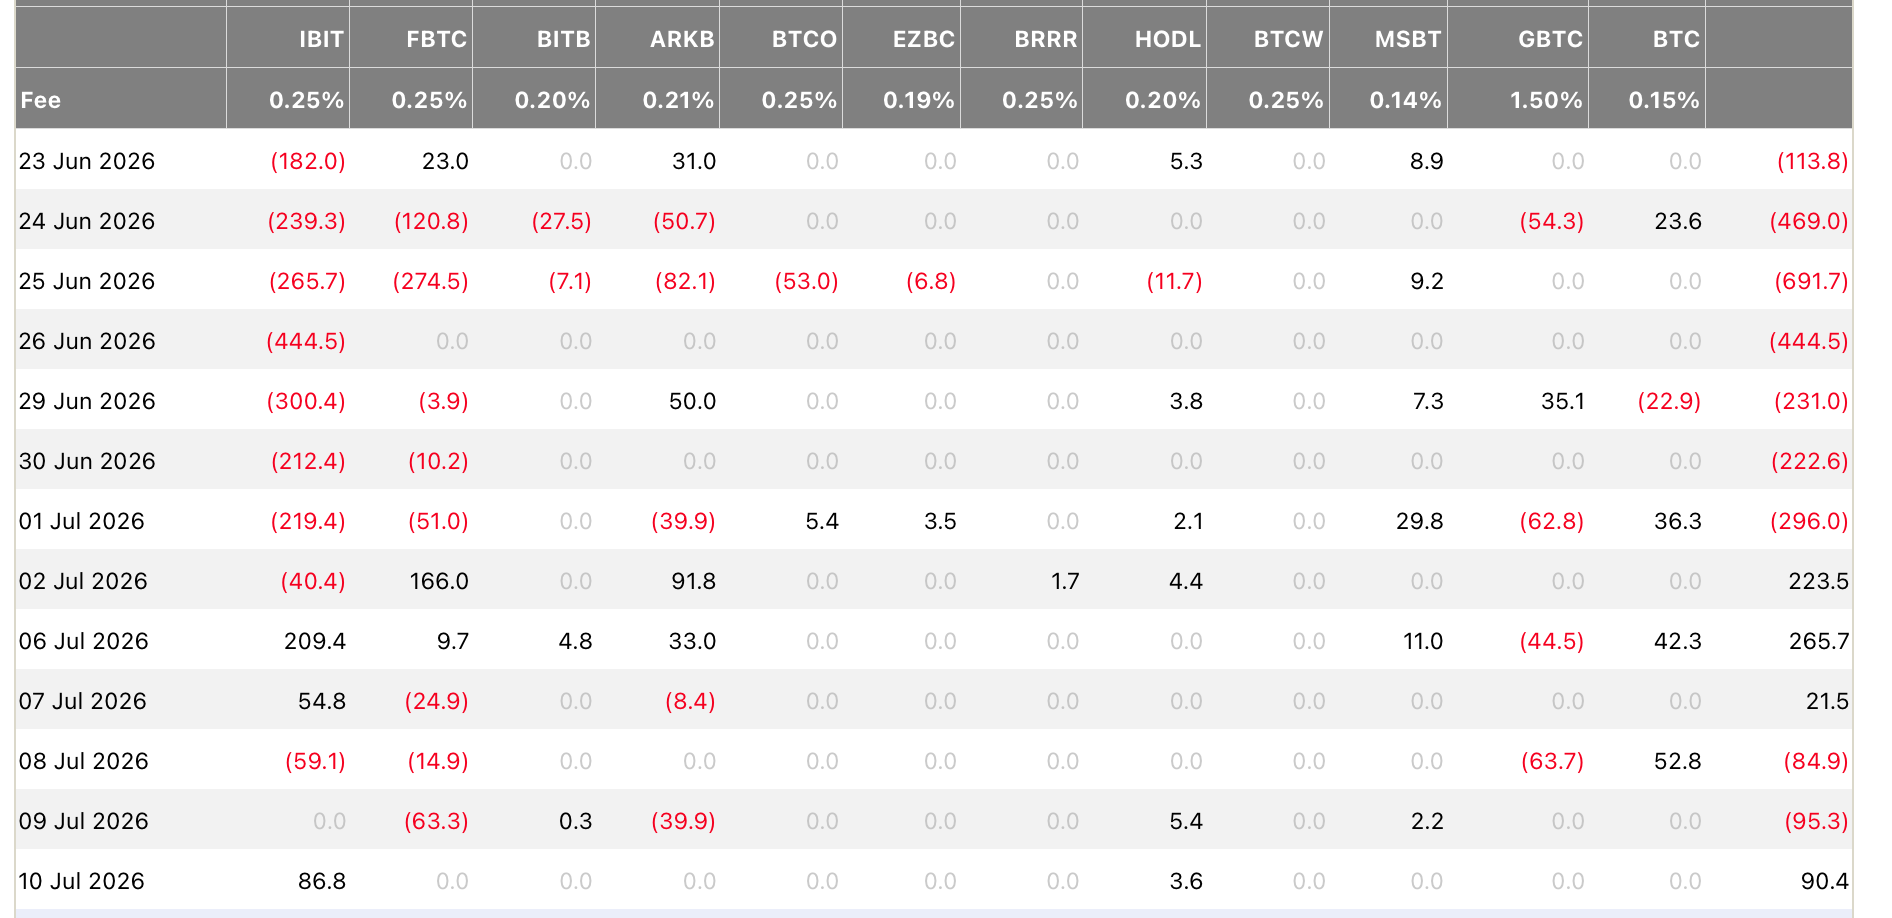
The flow detail matters more than the total. On 6 July there were $265.7 million of net inflows, the largest single day of the recovery, with IBIT supplying roughly 79 percent of it, or $209.4 million. The week prior, ETF flows were led by FBTC, even as IBIT still bled. But with a flipping of sentiment to IBIT, it confirms our first confirmation trigger, that an ETF inflow could mark the first sign of a sustained recovery. On 7 July, a further $21.5 million of flows were added, with IBIT contributing $54.8 million against redemptions elsewhere. While the following two days were dominated by macro as the US and Iran resumed military operations, and reversed flow, the week ended with a further small inflow on 10 July. The net for the week is $197.4 million, the first positive week since mid-May after nine consecutive weeks of redemptions that removed more than $8.2 billion. The pattern worth focusing on for now is that the bid shows up on quiet days and withdraws on loud ones, implying that we do not have price or sentiment agnostic bid via ETFs yet, and it is still a macro-dependent instrument.
ETF Indicators to Watch
The 30-day simple moving average (SMA) of ETF net inflows tracks the primary direction of institutional positioning and the persistent trend in market demand.
This indicator entered a sustained outflow regime in mid-May 2026, with daily net redemptions reaching $193 million in early June before moderating to a loss of $88.9 million per day, which is where it currently stands. Although the slowing pace of these withdrawals provides a constructive signal, the monthly trend remains in a state of net contraction. Institutional demand has yet to find its floor; a move back toward neutral levels remains the essential requirement before the data can support a thesis of renewed expansion in the spot market.
In terms of on-chain metrics, the cost-basis framework of evaluating market strength remains the primary bellwether for the current regime.
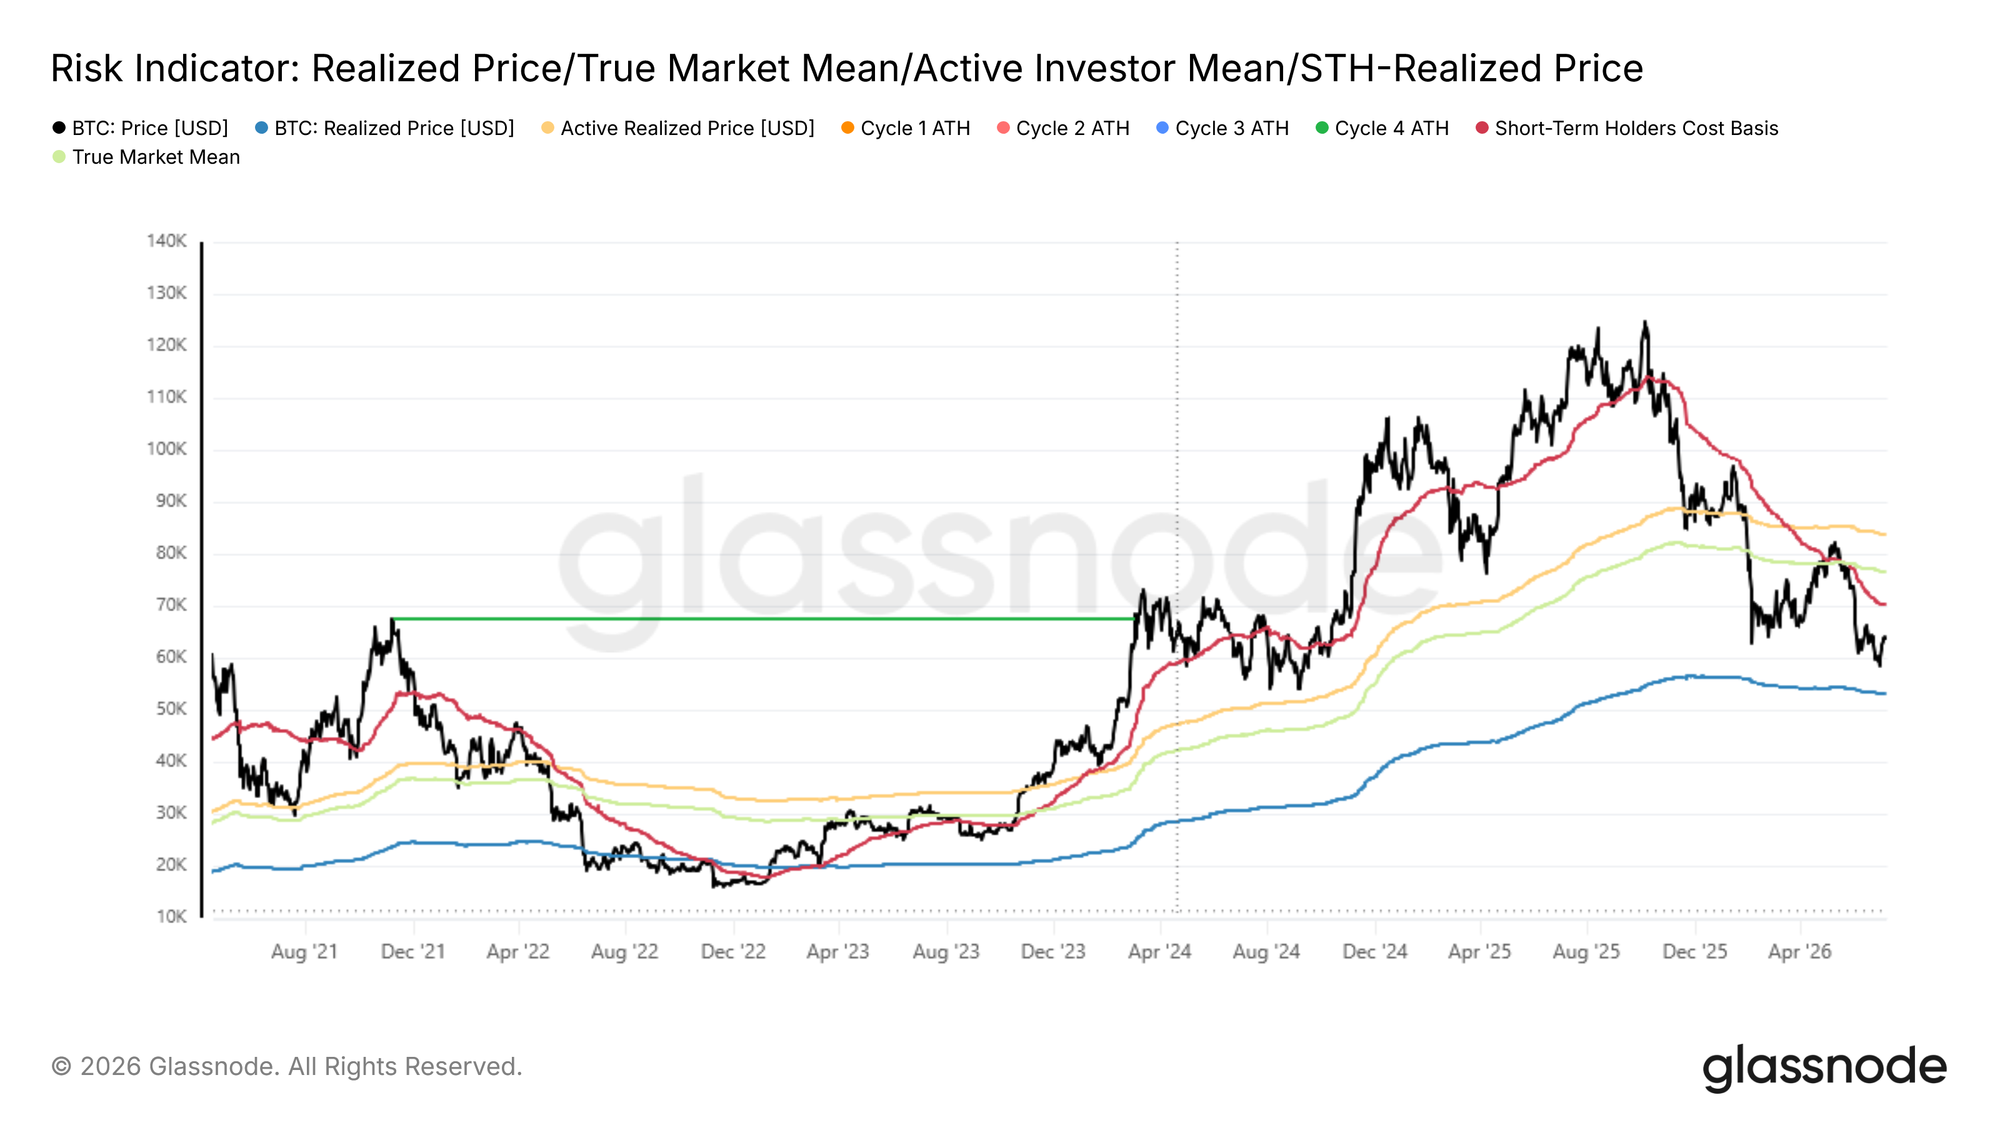
In bear markets, BTC trades below the Short-Term Holder Realised Price (STH-RP) for at least a period of 5-6 months (See Figure 4 above). July is the 5th month that this is true post the lows seen in February. The aggregate Realised Price at $54,000 serves as the definitive structural floor, while the STH-RP near $72,200 acts as the immediate overhead resistance. Beyond that, the True Market Mean near $76,600 represents the secondary barrier, with April’s quarterly open of $68,266 being a key reference point to define bear verses bull strength defining the level of market acceptance required for a move higher.
Key Events For The Week Ahead
As covered in last week’s Bitfinex Alpha, July historically provides a constructive backdrop for Bitcoin, with an average gain of 7.3 percent that typically exceeds 10 percent during US midterm years. We believe our cautiously optimistic stance for this month is already playing out despite BTC remaining macro dependent. Bitcoin has already advanced 9.3 percent from the $58,570 quarterly open. While this seasonal strength is noteworthy in context, it remains secondary to macro signals detailed below:
Tuesday 14 July, June CPI: Market expectations suggest the headline rate will moderate to 3.9 percent annually, while core inflation is projected at 2.9 percent. This represents the primary binary catalyst for the week; in our analytical framework, macro-driven signals will dominate price action within this 48-hour window.
Oman Track and Hormuz Risk: Negotiations regarding shipping security remained unresolved as of Saturday; any news of renewed supply disruption would immediately reprice crude oil and the broader cross-asset tape.
Monday, ETF Weekly Reset: A second straight week of net positive inflows serves as the primary confirmation trigger for the current trend.

General Macro Update
Growth Holds As Inflation Defines The Second Half
The US economy enters the second half of 2026 with growth intact, a stable labour market and firm investment, but inflation remains the main constraint on a faster expansion.
We expect economic growth to remain near 2 percent for the year, supported by lower oil prices, artificial intelligence investment and a Federal Reserve that keeps interest rates unchanged. Renewed geopolitical disruption or higher tariffs could weaken that balance quickly.
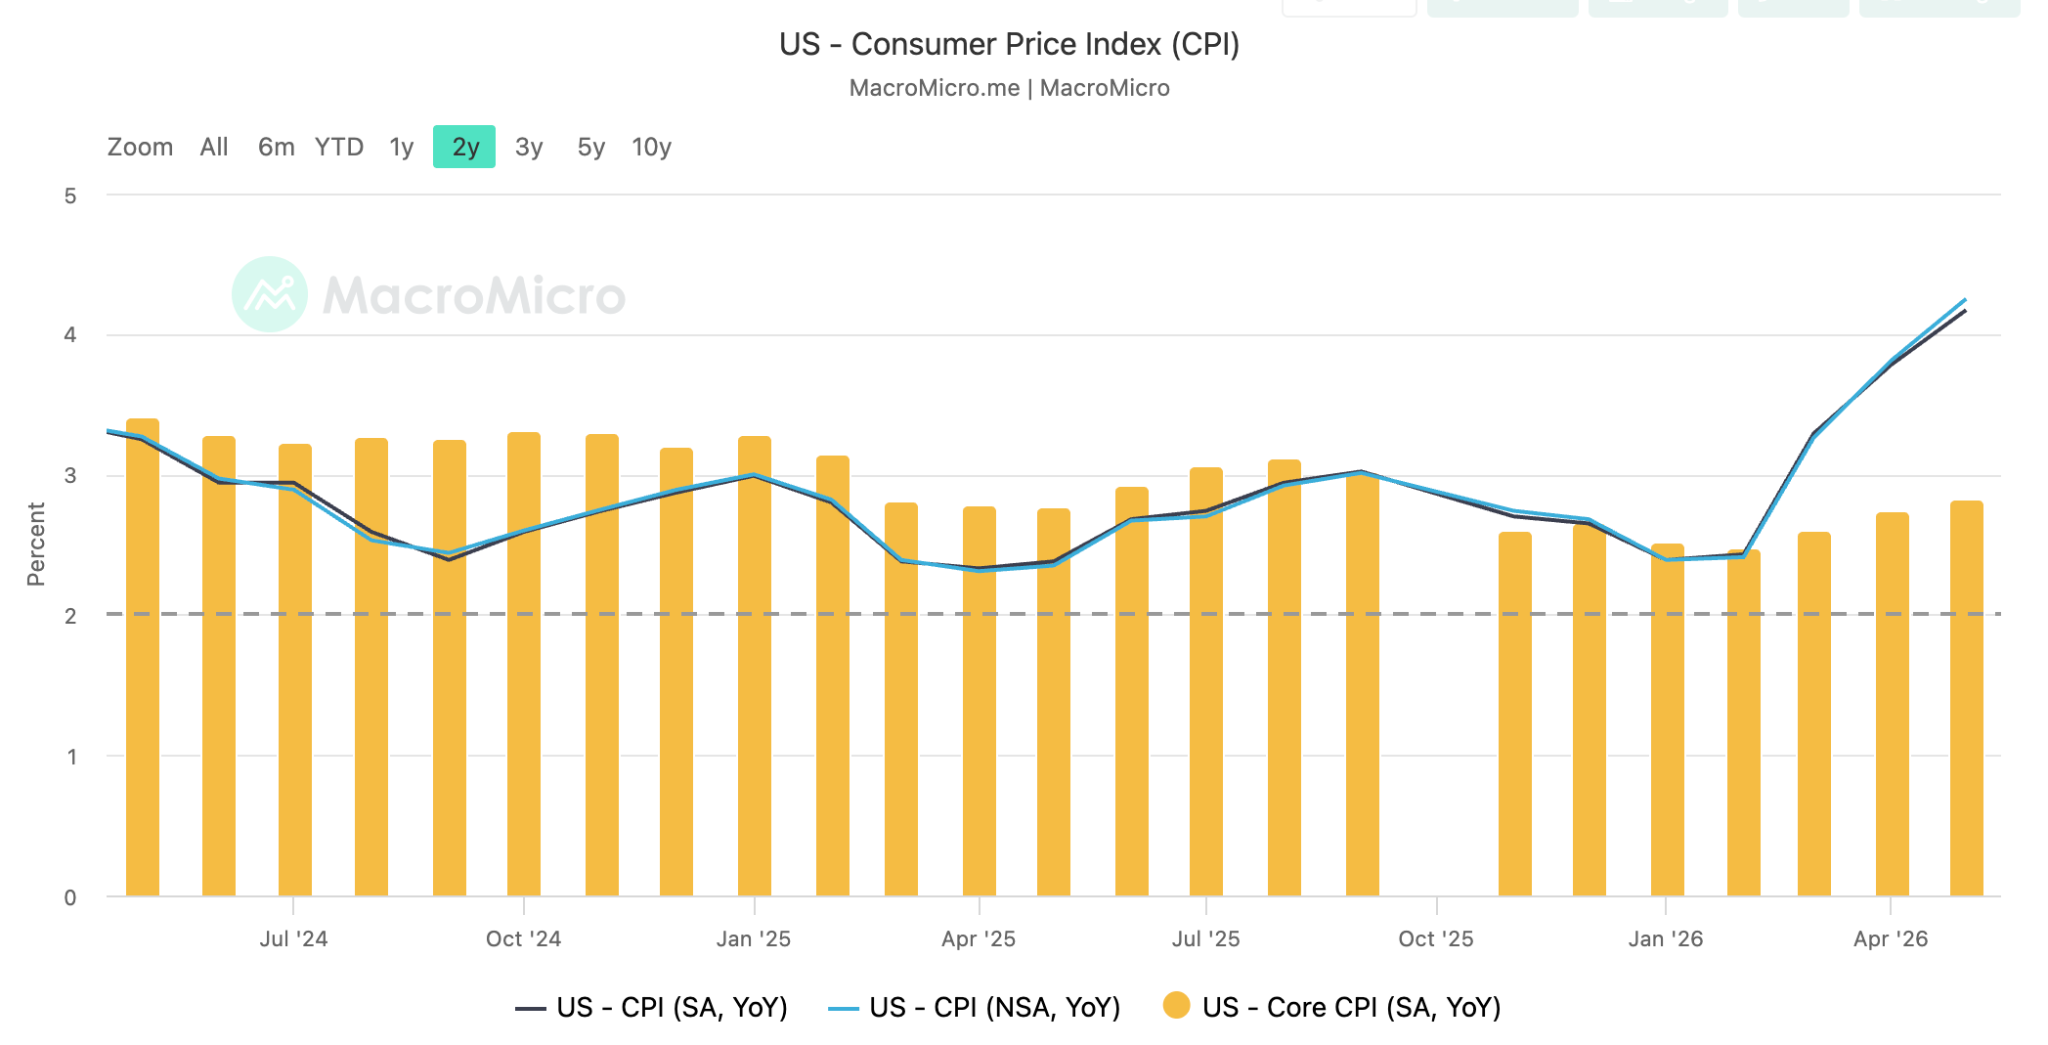
The Consumer Price Index (CPI), released by the US Bureau of Labor Statistics on 10 June, rose 4.2 percent over the 12 months to May, up from 3.8 percent in April. Core CPI, which excludes volatile food and energy prices, rose 2.9 percent over the same period. The data shows why the economic outlook remains complicated: the underlying economy has remained resilient, while the earlier energy shock has pushed headline inflation further above the Federal Reserve’s 2 percent target.
A similar picture appears in the Personal Consumption Expenditures (PCE) price index, which is the Fed’s preferred measure of inflation. The US Bureau of Economic Analysis reported on 25 June that headline PCE inflation reached 4.1 percent in May, while core PCE inflation stood at 3.4 percent. Inflation therefore remains too high for the Fed to declare victory, even as the most severe pressure from energy fades.
The Economy Has Absorbed The Energy Shock Better Than Expected
The Middle East conflict and disruption to oil flows through the Strait of Hormuz created one of the largest economic risks of the first half of 2026. Oil prices climbed sharply as markets confronted the possibility of a prolonged supply disruption, raising transport, production and household energy costs.
The US economy proved more resilient than it might have been several decades ago. The country is less dependent on imported oil, and improvements in energy efficiency mean that each unit of economic output requires less oil than in the past. This does not eliminate the impact of an energy shock, though it reduces the damage higher crude prices can inflict to the broader economy. GDP Remains Steady
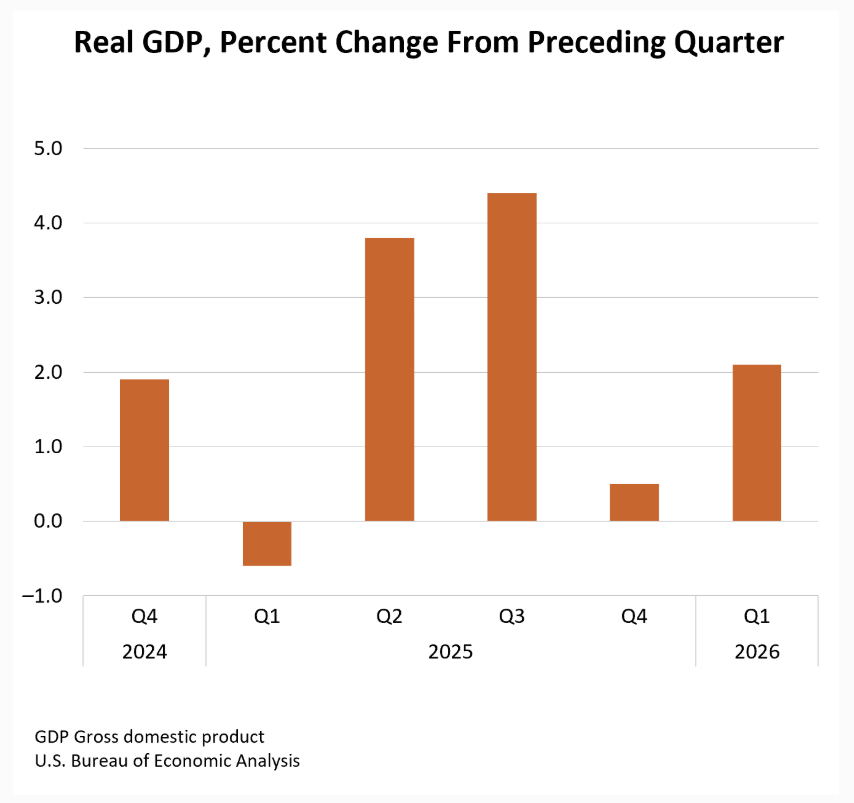
The third estimate from the US Bureau of Economic Analysis showed that real gross domestic product (GDP) increased at an annual rate of 2.1 percent in the first quarter of 2026. Investment, exports, and government and consumer spending all contributed to the expansion.
That is a firmer growth profile than the analysis we discussed in May and June, when first quarter GDP was still estimated at 1.6 percent and the data fitted a mild stagflation frame. The latest upward revision softens that framing.
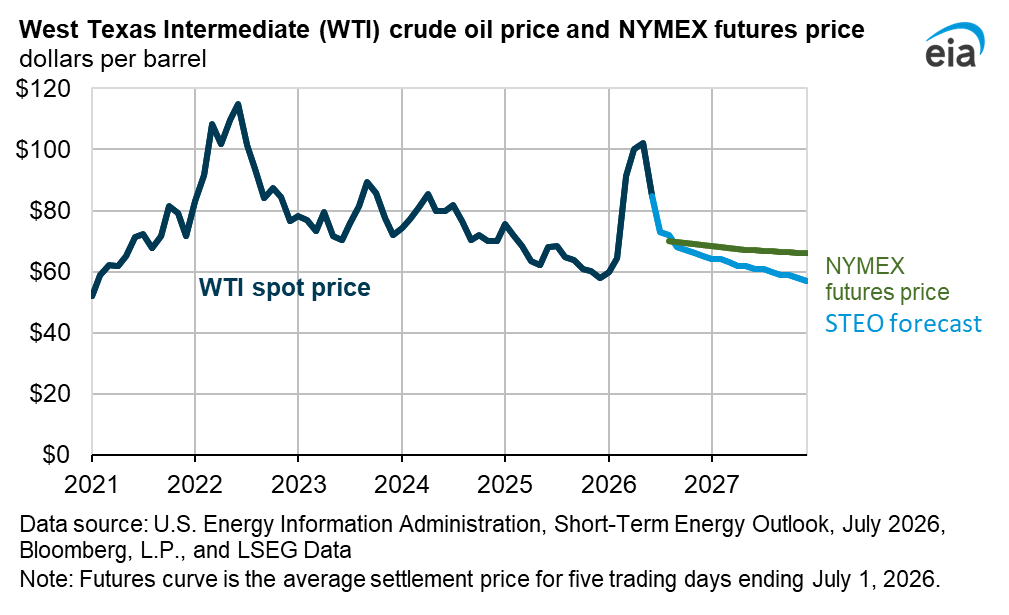
The second half of the year has begun with resilient growth alongside sticky inflation, and its progress depends heavily on whether the energy shock continues to unwind. The US Energy Information Administration reported that Brent crude averaged $85 per barrel in June, down $32 from its April peak, and forecast an average of $74 in the third quarter as global supply improves. Lower oil prices can support growth in two ways: they reduce direct household spending on fuel and they lower costs for businesses that depend on transport, energy and petroleum-based inputs.
This anchors the central thesis for the second half of the year. The decline in energy prices should provide relief, though it will not immediately erase the inflation created during the first half of the year. Oil moves through the economy with a delay. Transport, fertiliser, food production and industrial costs can remain elevated well after crude prices decline.
Consumer Spending Remains Resilient, But The Strength Is Uneven
The US consumer has remained an important source of economic stability. Real personal consumption expenditures increased 0.3 percent in May, while current-dollar spending rose 0.7 percent. Households have continued to spend despite higher prices and several months of elevated energy costs.
Lower oil and gasoline prices should give households more room to spend during the second half of the year. This effect matters most for lower- and middle-income households, because necessities consume a larger share of their budgets. A reduction in fuel costs therefore leaves more income available for food, services and discretionary purchases.
Consumer resilience is unevenly distributed, though. Recent data points to a growing divide between households that benefit from rising financial markets and those that depend mainly on wages. Higher-income households hold a larger share of financial assets and receive a greater direct benefit when equity prices rise. That creates a wealth effect which supports spending even before assets are sold.
This dynamic supports overall consumption while creating a vulnerability. An economy that leans heavily on wealthier households can appear stronger at the headline level than conditions experienced by lower-income groups would suggest. The durability of consumer spending will therefore depend on the equity markets and also on whether lower inflation allows real wages to recover.
A continued decline in energy inflation would help real wages recover. So far they have lagged prices since the energy shock was triggered by the escalation of tensions in the Middle East.
The Labour Market Is Cooling Without Breaking
In the meantime, the labour market has slowed, but not seen any sharp deterioration. The US Bureau of Labor Statistics reported that nonfarm payroll employment increased by 57,000 in June, while the unemployment rate edged down to 4.2 percent from 4.3 percent in May. The decline was driven by labour force participation, which fell 0.3 percentage points to 61.5 percent, its lowest since March 2021, rather than by stronger hiring. Payroll gains for April and May were revised down by a combined 74,000. Employment continued to increase in professional and business services, social assistance and health care.
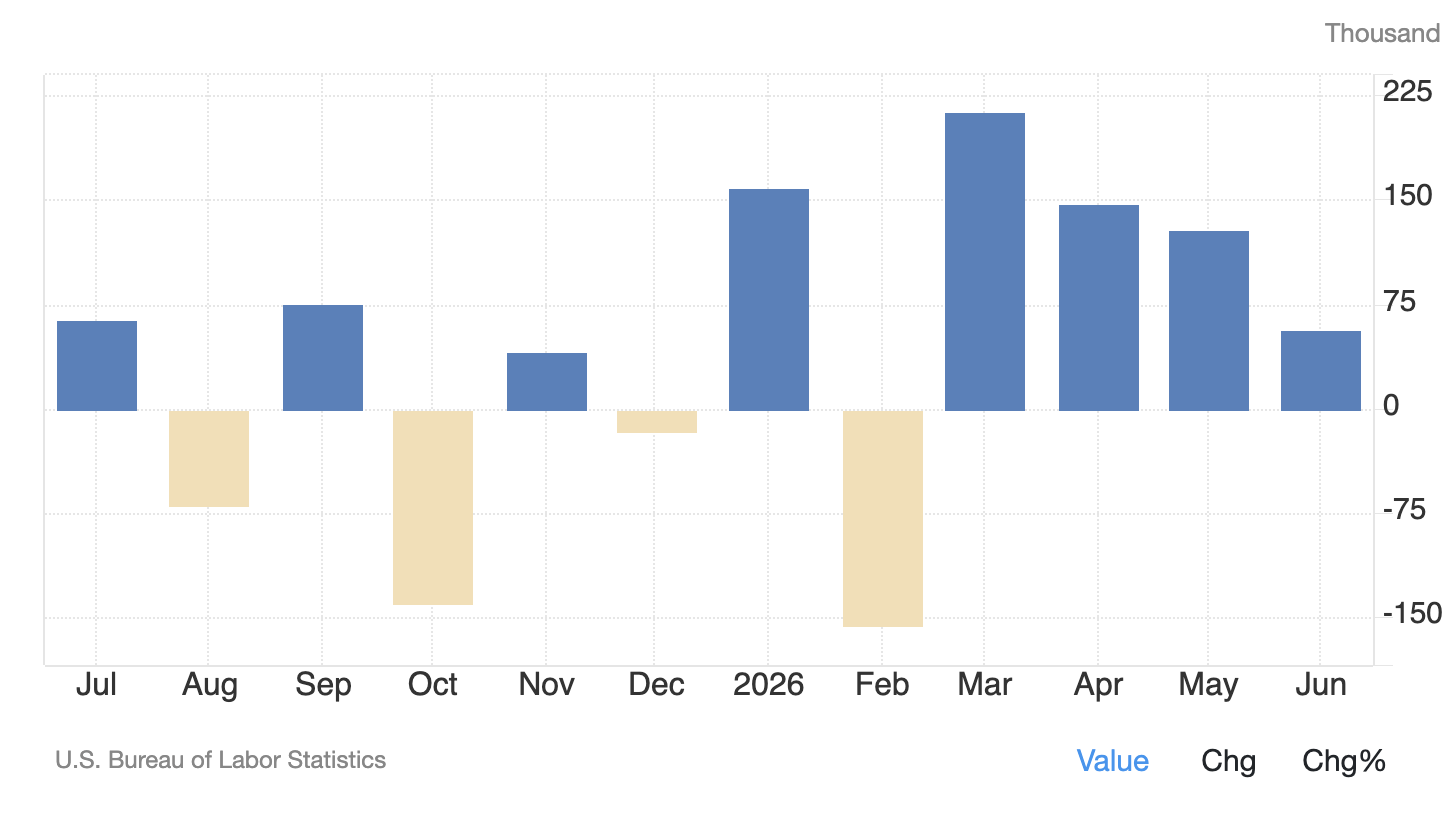
The June figures suggest that hiring has become more restrained after stronger gains earlier in the year. That distinction matters. Slower job creation can also reflect slower growth in the available workforce, demographic change and tighter immigration policy.
The outlook is therefore for unemployment to remain within the low-4 percent range through the end of the year. The challenge is whether hiring can stay strong enough to support household income while inflation gradually falls. A sudden rise in joblessness looks unlikely on current data.
Artificial intelligence investment could provide some support. Data centres, semiconductor infrastructure, electricity systems and related construction require capital and labour. These investments will not necessarily create job growth on the same scale as previous industrial expansions, because much of the technology is highly automated and capital-intensive.
AI Investment Is Large, Its Growth Effect Smaller
Artificial intelligence (AI) has become one of the clearest sources of private investment growth in the US economy. The four largest hyperscale technology companies, Microsoft, Amazon, Alphabet and Meta, have guided to combined capital expenditure of about $725 billion in 2026, nearly 80 percent above 2025 levels, with further growth expected in 2027. That spending supports data centres, advanced chips, energy infrastructure and other parts of the technology supply chain.
However, large investment figures do not translate directly into an equal increase in US GDP. A significant share of the servers, chips and other equipment used in artificial intelligence infrastructure may be imported. Imports are subtracted when GDP is calculated because GDP measures production within the US, rather than total spending by US companies.
The AI investment cycle can therefore be economically important without creating an equivalent increase in headline GDP. The strongest long-term benefit could instead come through higher productivity, meaning more output from the same amount of labour and capital.
The immediate contribution is positive but more measured than the headline investment figures might suggest. AI should remain an important support for business activity, construction and equipment spending, but it cannot by itself remove the risks created by inflation, high borrowing costs and geopolitical uncertainty.
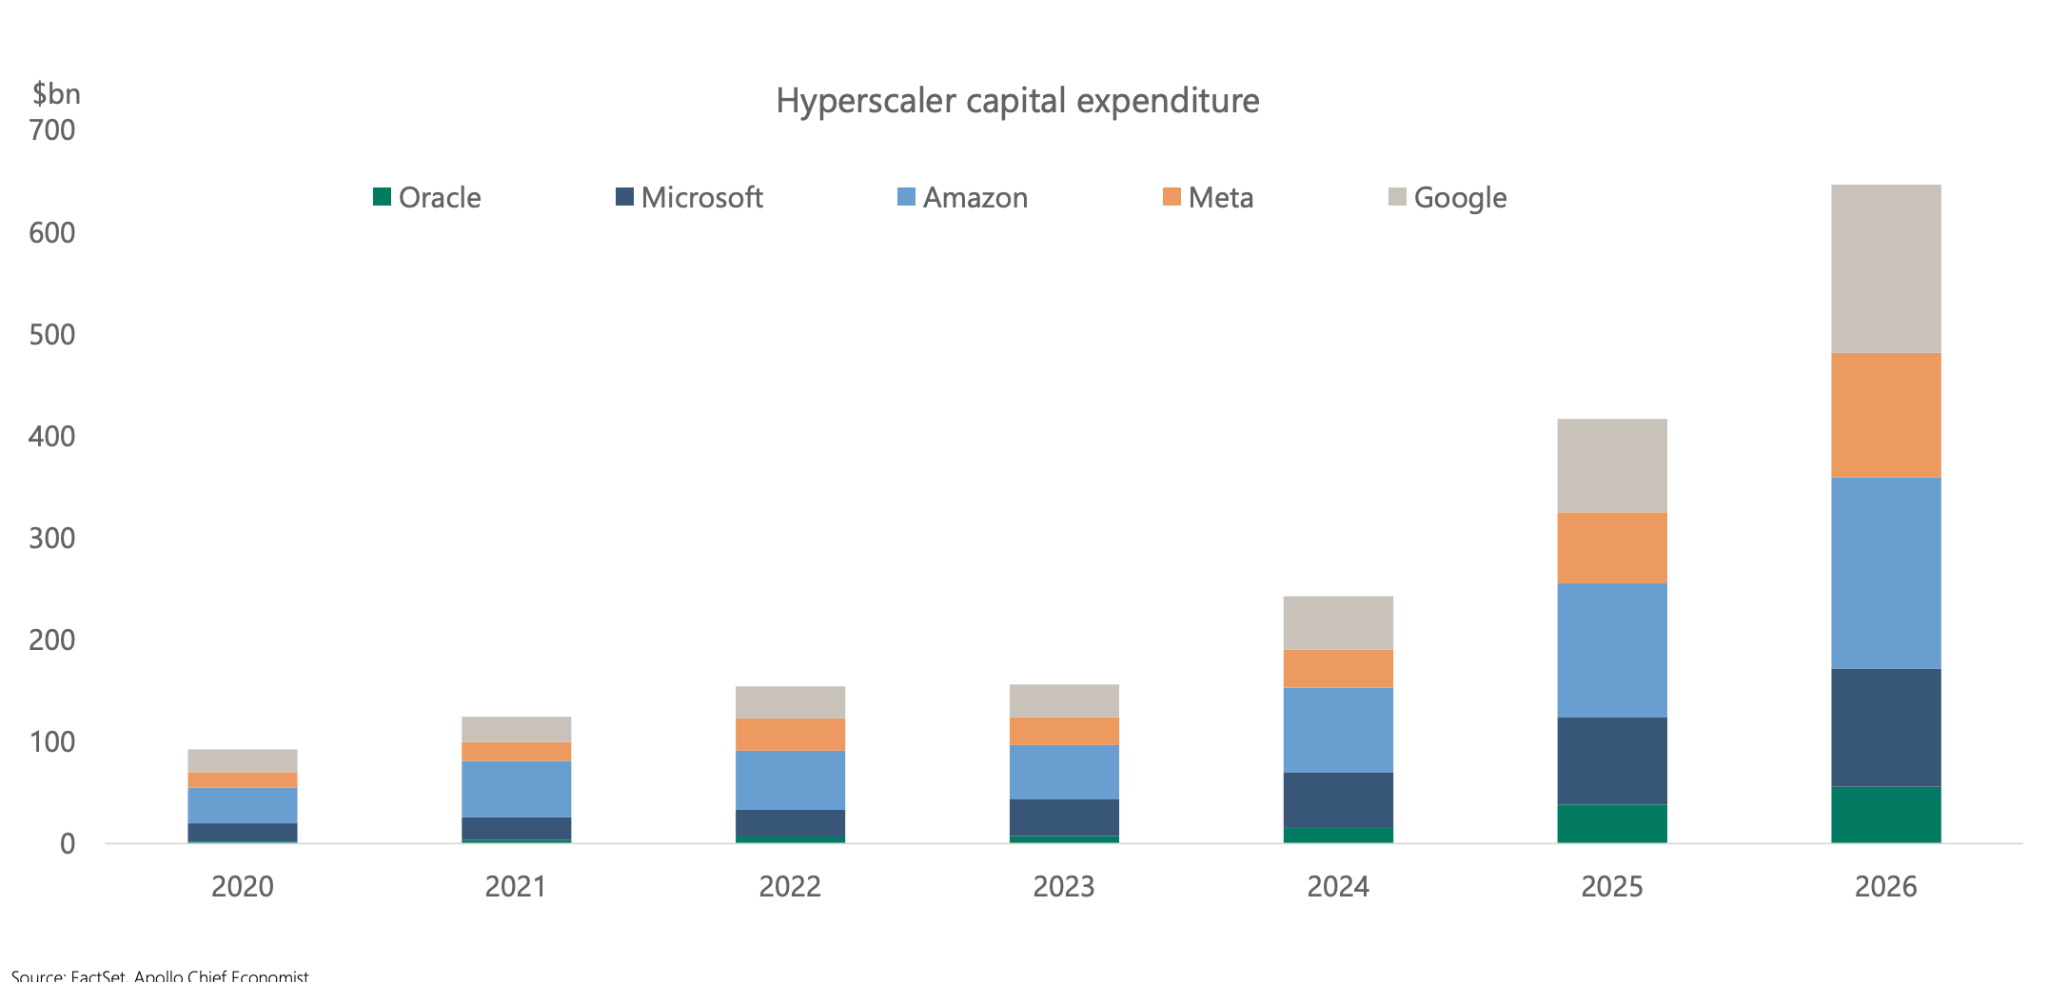
The AI build-out is one of two legs of the fiscal and industrial expansion. Defence orders are the other. Capital goods orders for defence reached almost $23 billion in April, while the fiscal year 2026 defence request of $961 billion stands among the largest in five decades, in inflation-adjusted terms. Both build-outs compete for the same scarce industrial inputs: metals, electronics and machinery. That is why last week’s two-track framing still applies, with energy disinflating slowly while fiscal and technology demand press on the same cost base. Tariffs now add a third channel of price risk on top of that.
Housing Remains Constrained By The Higher-Rate Environment
Despite this constructive backdrop, housing remains one of the clearest areas of weakness. The 30-year fixed mortgage averaged 6.49 percent in the week of 9 July, according to Freddie Mac, and rates above 6 percent continue to limit affordability and discourage activity among buyers and sellers.
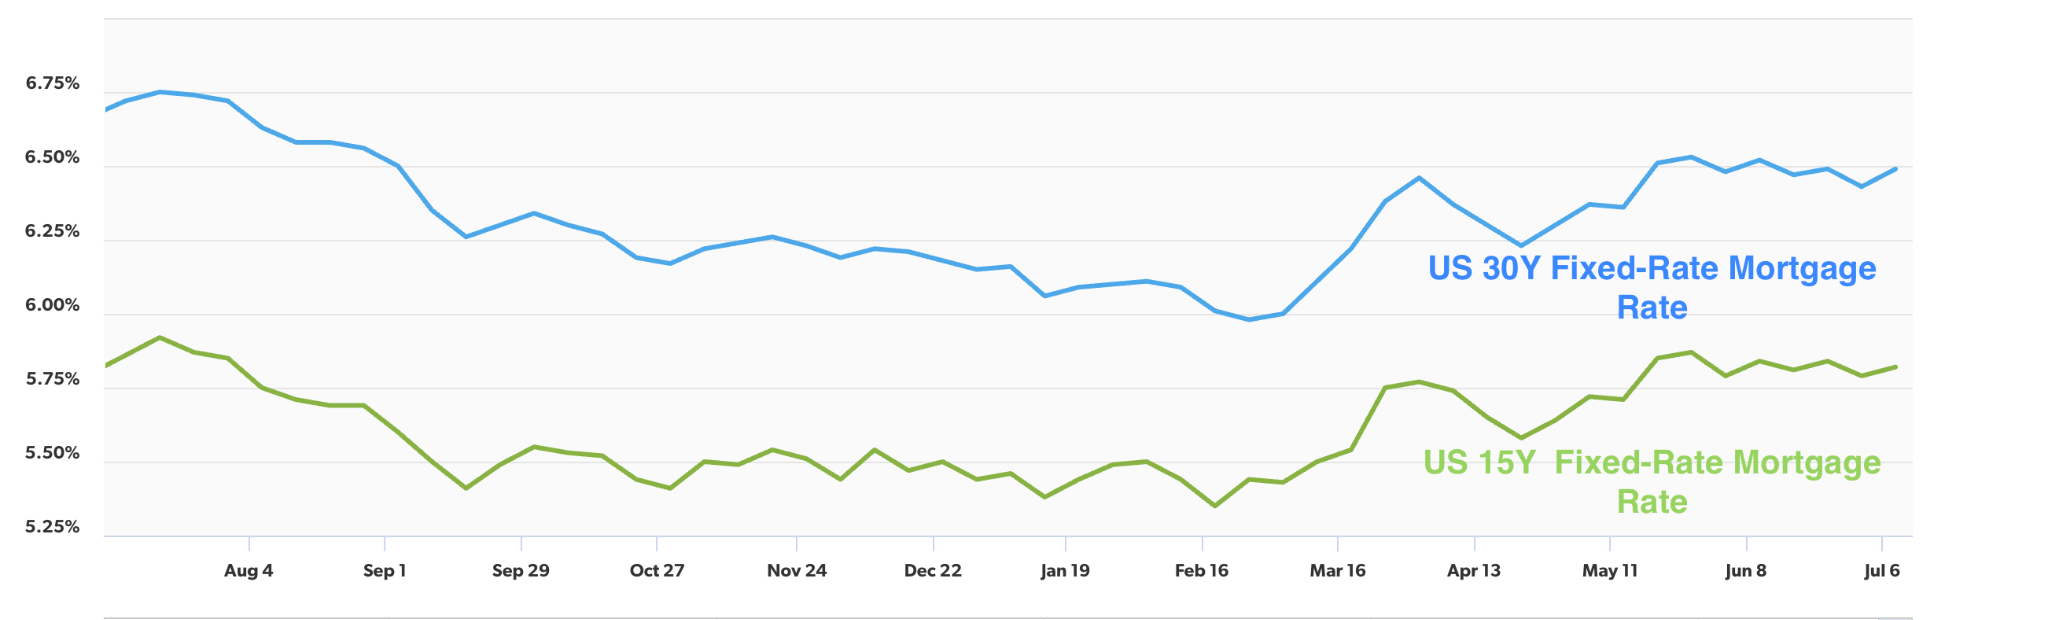
The market also faces what economists call the mortgage lock-in effect. Many existing homeowners secured much lower mortgage rates before borrowing costs rose. Moving home would require them to replace that cheap mortgage with a more expensive one, which discourages them from selling.
There are early signs that some buyers and sellers are becoming more willing to accept higher mortgage rates as a lasting reality. The outlook does not assume a strong housing recovery in the second half of the year. Interest rates are likely to remain restrictive, while limited housing supply should prevent a large decline in property values.
The result is likely to be continued stagnation rather than a severe downturn. Transaction volumes can remain weak even as home prices stay elevated.
Trade Policy Adds A Separate Inflation Risk
Trade policy is the second source of inflation uncertainty, and it could also raise the cost of imported goods during the second half of the year.
The Office of the United States Trade Representative has continued its Section 301 investigations. These cover forced-labour enforcement failures, where duties of 10 to 12.5 percent have been proposed across 60 investigations, and structural excess capacity in manufacturing. Higher tariffs can protect some domestic industries, but they can also raise costs for businesses and consumers when importers pass the additional expense through to final prices.
The timing matters. If energy inflation falls while tariffs rise, the two forces could partly offset one another. Consumers may save money at the fuel pump while facing higher prices for imported goods or products that depend on foreign components.
This makes the inflation outlook harder to read than a simple forecast based on oil prices alone. The base case assumes that the initial tariff impact does not create a new broad acceleration in inflation. A more aggressive rise in trade barriers would present a clear upside risk to prices and could force the Federal Reserve to remain restrictive for longer.
The Federal Reserve Has Little Reason To Move Quickly
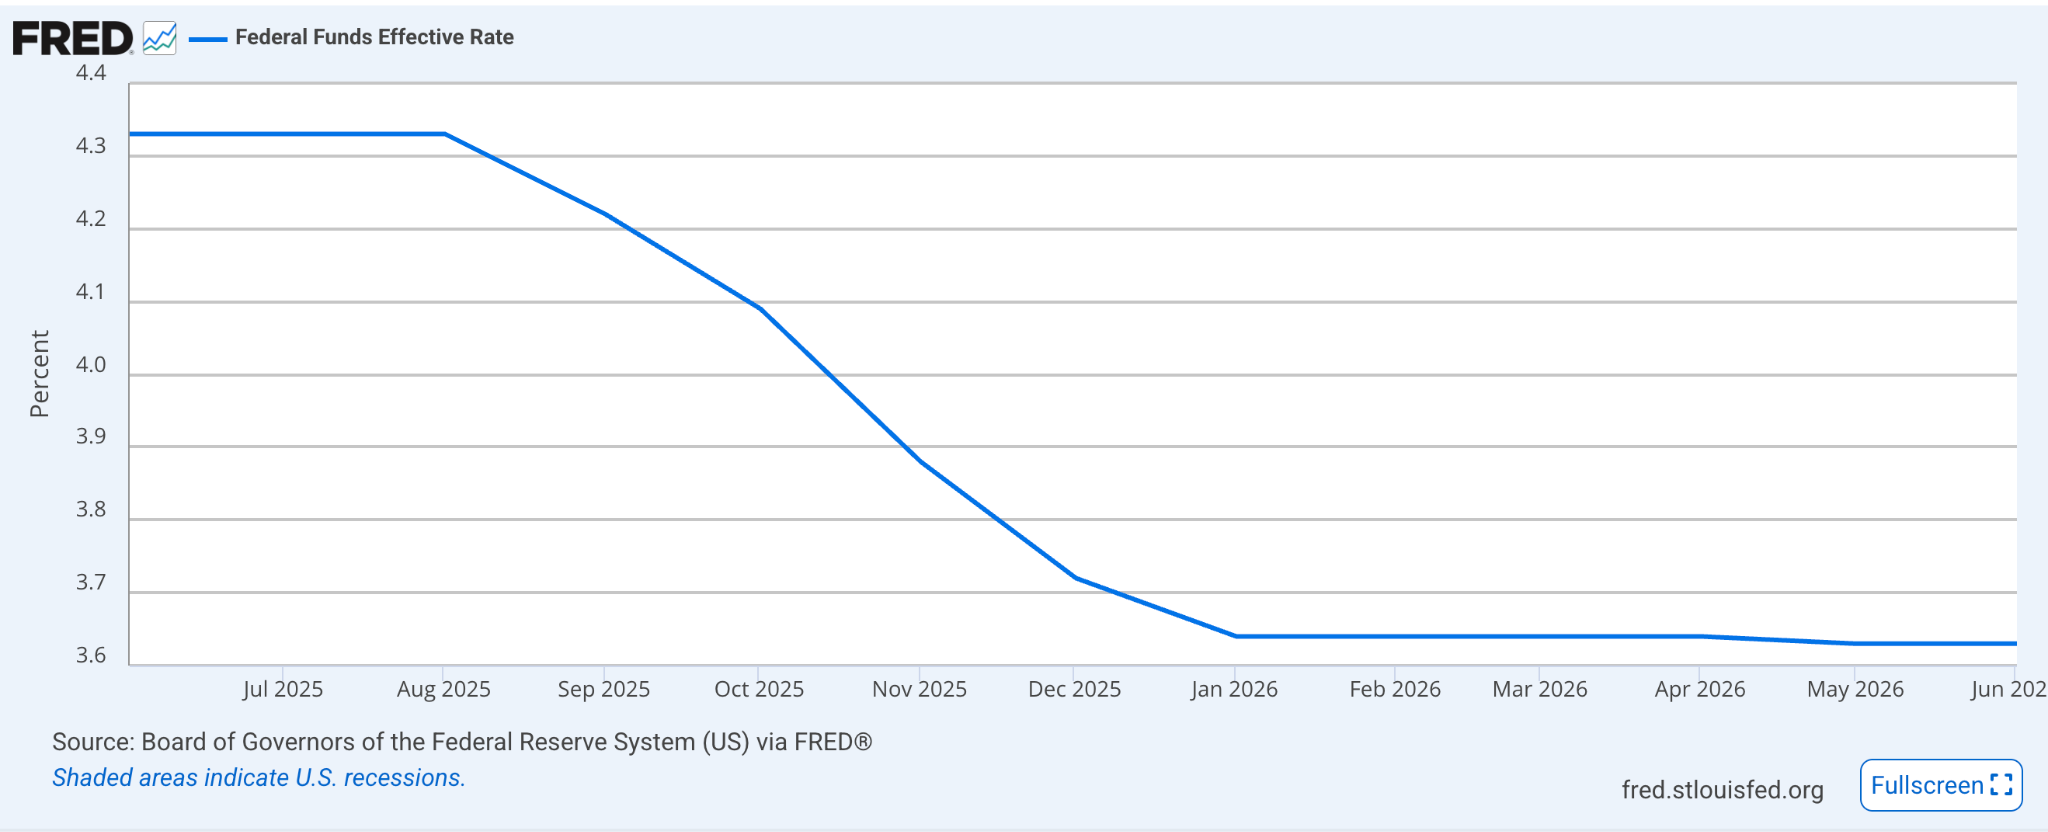
The Fed maintained its federal funds target range at 3.5-3.75 percent in June. The decision reflects the central bank’s difficult position: inflation remains above target, but the labour market is stable and the Fed must determine how much of the recent price increase came from temporary supply shocks rather than sustained domestic demand.
Central banks often avoid reacting immediately to a supply shock, because raising interest rates cannot produce more oil or reopen a shipping route. Policymakers may still need to tighten if the initial shock spreads into wages, services and wider inflation expectations.
The base case is that the Fed will keep rates unchanged through the rest of 2026. That view rests on three conditions: oil prices continue to ease, core inflation stops accelerating and the labour market remains broadly stable. It is the trapped-hold framing carried over from last week’s issue: the Fed cannot ease into a fiscal expansion, and employment is not forcing its hand, so the next move remains a cut, delayed rather than derailed.
The balance is narrow. The latest inflation data does not support an urgent rate cut, while softer energy prices reduce the immediate case for another increase. The most likely outcome is an extended pause.
Growth Near 2 Percent, Inflation Easing Slowly
The combined view points to a US economy that should continue expanding during the second half of 2026, without returning to the rapid growth or low inflation of earlier years.
The strongest supports are clear. Falling oil prices should improve household purchasing power. Artificial intelligence investment should sustain capital spending. A stable labour market should support income, while rising financial wealth can continue to strengthen spending among higher-income households.
The constraints are equally clear. Inflation remains well above the Fed’s 2 percent target. Housing continues to struggle under high borrowing costs. Consumer strength is uneven, and trade policy could create new price pressure.
The baseline is therefore for full-year economic growth near 2 percent, unemployment to remain in the low-4 percent range, and inflation moderating during the second half while ending the year above the Fed’s target. The federal funds rate should remain at 3.5-3.75 percent through year-end, absent a major change in inflation or economic activity.
The latest official data supports a cautiously constructive view. The Fed’s own June projections placed median 2026 real GDP growth at 2.2 percent. Taken with the growth and labour data above, that suggests the expansion remains intact even as inflation limits the central bank’s room to ease policy.
The main downside risk remains another disruption to energy supplies. A renewed closure or restriction of the Strait of Hormuz could push oil prices higher, increase transport and food costs, weaken real household income and force the Fed to reconsider its policy stance.
The strongest upside would come from a more durable improvement in energy supply. A sustained decline in oil and gasoline prices could pull headline inflation lower, restore real wage growth and strengthen household consumption without requiring immediate monetary stimulus.
The most likely path lies between those extremes. The first half of 2026 showed that the US economy can withstand a major energy shock better than it once could, but resilience should not be confused with immunity. The economy enters the second half of the year with enough momentum to keep growing, and its success will depend on whether falling energy prices reduce inflation faster than trade tensions, geopolitical risks and structural cost pressures can replace it.
What Does This Mean for Risk Assets?
For risk assets, the cross-asset read follows directly from the macro path set out above. A Fed on an extended hold removes the policy-rate risk that weighed on bitcoin through previous tightening cycles. Headline disinflation arriving through energy supports real household income without requiring rate cuts. Long-end yields are propped up by term premium rather than policy-rate fear which implies duration is absorbing the fiscal risk that bitcoin does not carry. That combination keeps the environment a tailwind for bitcoin and hard assets over duration and it is the backdrop against which the flows and on-chain structure covered in Market Signals above are playing out.

Central Banks Shift Back To Domestic Risks
Investors are increasingly treating the Middle East energy shock as temporary. Oil prices have significantly retreated since the April peak, and US Treasury markets pricing only limited further tightening from the Federal Reserve. Central banks are responding with greater caution: some raised rates during the energy shock, and falling oil prices are now giving most policymakers room to pause and refocus on domestic inflation, growth and currency risks.
The June CPI report will not be released until 14 July, which means investors are still assessing whether lower energy prices will translate into a sustained decline in headline inflation.
Financial markets have already moved ahead of that evidence. Investors appear to have priced in a lasting reduction in geopolitical risk before a durable peace has been secured. The clearest signal has come from oil, where Brent crude retreated sharply after reaching elevated levels during the conflict. The US Energy Information Administration has also lowered its 2026 Brent forecast, as global supply conditions improve and the immediate disruption to oil flows fades.
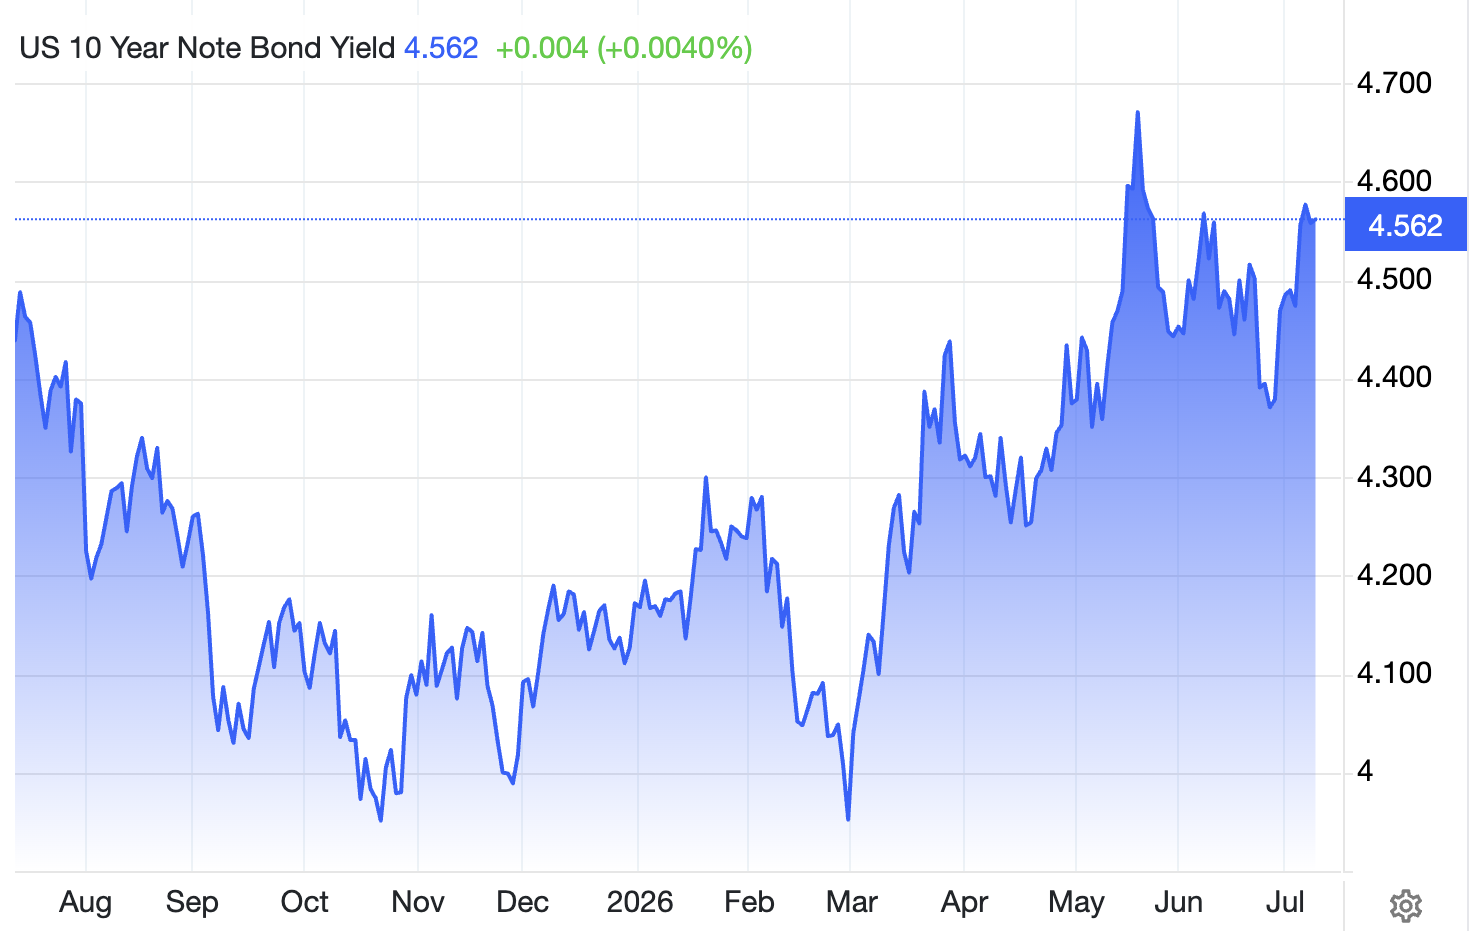
The US Treasury market is telling the same story from a different angle. The benchmark 10-year Treasury yield held within a broad 4 to 4.5 percent range through much of the conflict, though it briefly moved above that range when investors expected the war to continue, and again when inflation raised the risk of a stronger Fed response. The yield has pushed back above the top of that range in early July, closing at 4.54 percent on 10 July.
Rising yields alongside falling oil looks like a contradiction, but the two are consistent once the yield is broken into its parts. A long-term Treasury yield reflects the average short-term interest rates investors expect over the life of the bond, plus a term premium, which is the extra return investors demand for accepting the uncertainty of holding a long-dated bond.
The expectations part is anchored. The Federal Reserve maintains a target range of 3.5 to 3.75 percent for the federal funds rate, and the market is not pricing a sustained series of increases in response to the energy shock. The push higher in the 10-year yield is therefore coming from the term premium: investors believe the immediate inflation shock will fade, but they want more compensation for longer-term fiscal and inflation uncertainty.
That is what makes the Treasury market’s response similar to oil’s. Both markets are looking through the first impact of the energy shock, and many central banks are now doing the same. Falling oil prices reduce pressure on headline inflation, because energy feeds directly into transport, electricity and production costs. Policymakers must still determine whether the earlier price shock has spread into wages, services and broader inflation expectations.
The Federal Reserve Has Room To Wait
The shift under Federal Reserve Chairman Kevin Warsh also adds another dimension. Warsh took office as chairman on 22 May 2026, and the Fed has started reviewing its policy framework and communication methods. Reduced reliance on detailed forward guidance, the practice of telling markets how policymakers expect rates to evolve, could lead investors to place greater weight on incoming data and market prices when estimating the Fed’s next move.
That approach may increase market volatility because investors receive fewer explicit signals about future policy. It also marks a move towards a system in which financial conditions respond more directly to economic evidence than to detailed central bank promises.
European And Japanese Policymakers Moved Earlier
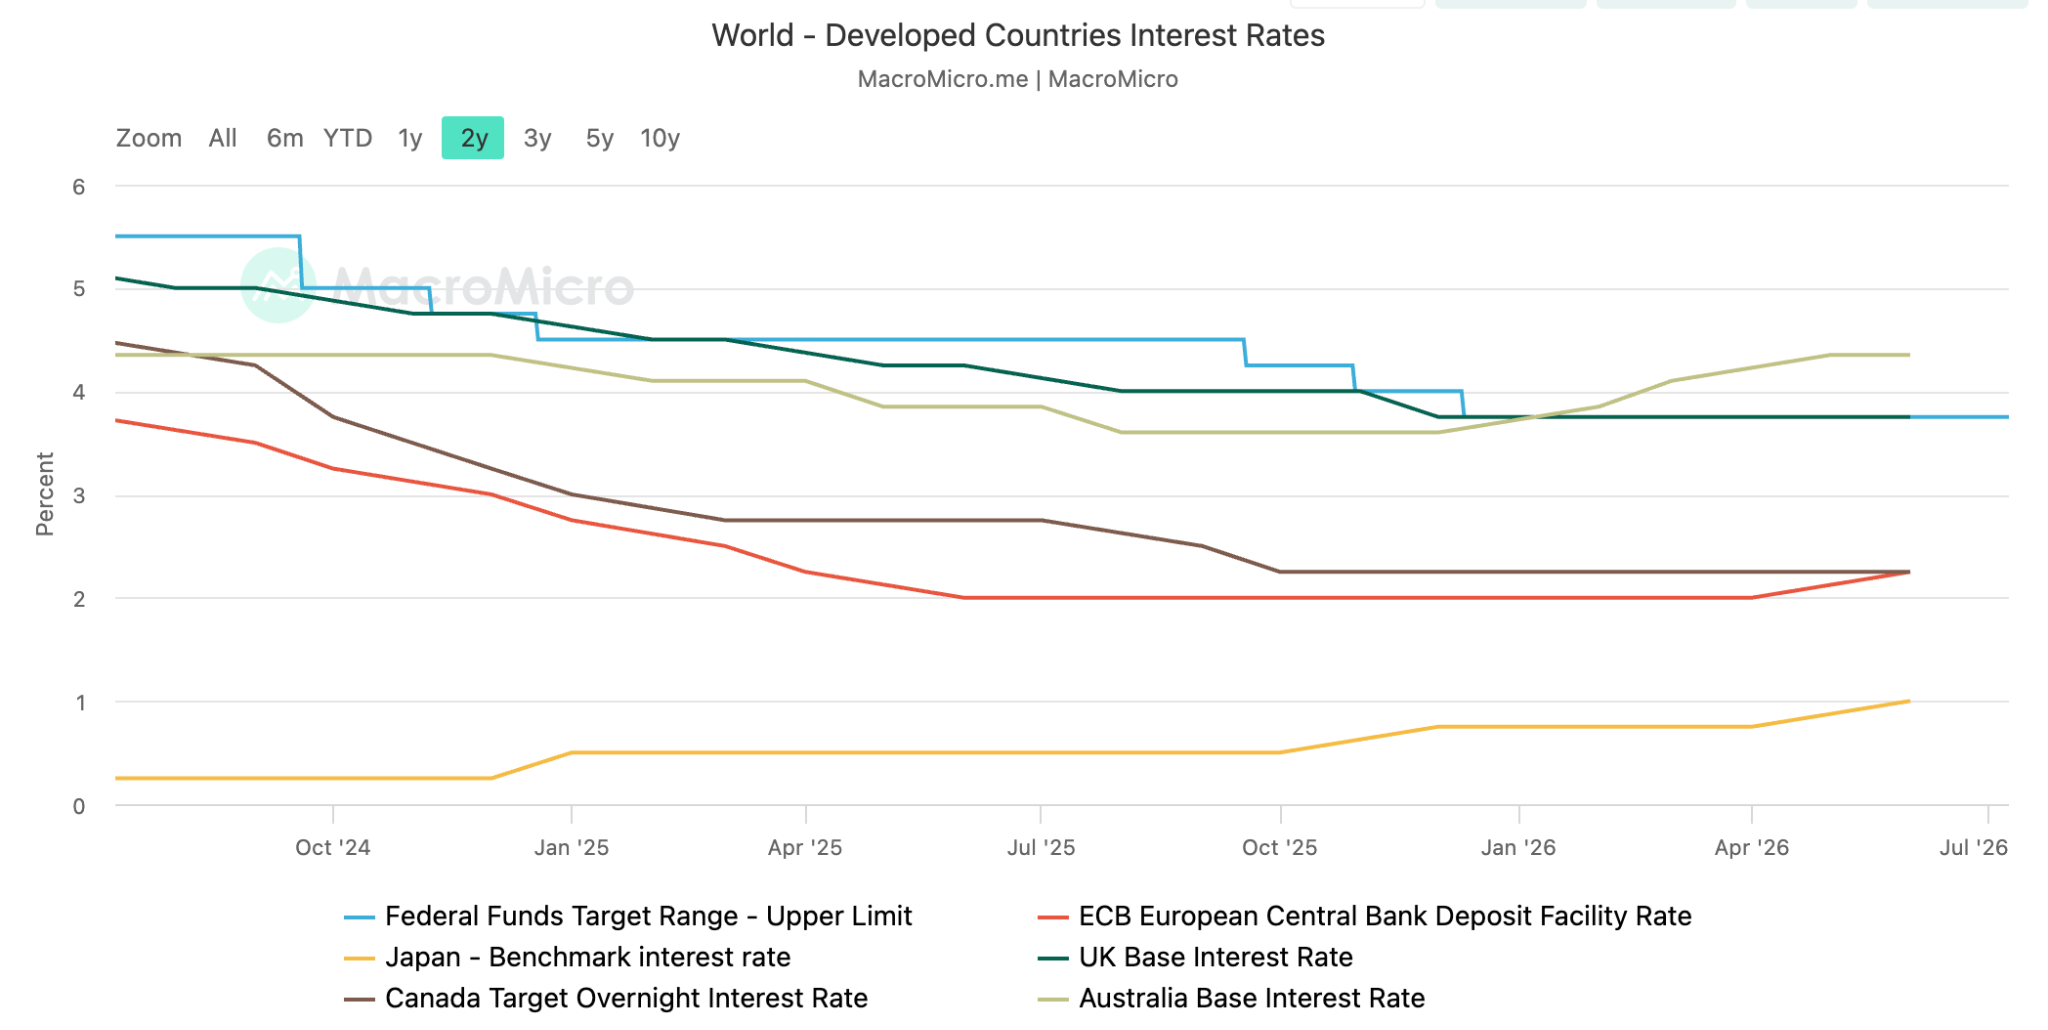
Some major central banks moved before the energy shock passed. The European Central Bank (ECB) raised its three key interest rates by 25 basis points on 11 June, taking the deposit facility rate to 2.25 percent and the main refinancing operations rate to 2.40 percent.
The ECB’s decision reflected concern that supply shocks could create more persistent inflation. The subsequent decline in energy prices has increased its room to pause. Unless inflation continues to accelerate or the oil market suffers another major disruption, the case for further immediate tightening has become less compelling.
The Bank of Japan also raised its policy rate by 25 basis points to 1 percent on 16 June, its highest level since 1995. Its challenge differs from that of many other central banks because policymakers must consider both inflation and the yen. Continued currency weakness can raise import costs and add to inflation, which could force the Bank of Japan to tighten earlier than domestic conditions alone would justify. Its next monetary policy meeting is scheduled for 30-31 July 2026.
The Bank Of England And Bank Of Canada Remain Cautious
The Bank of England held its Bank Rate at 3.75 percent in June, still assessing whether the earlier energy shock has become embedded in domestic prices and wages, while the Bank of Canada held its policy rate at 2.25 percent on 10 June against weak overall activity and soft business investment. Canada’s outlook is asymmetric: persistent weakness makes further increases difficult to justify, while a deeper fall in oil prices could eventually reopen the discussion around rate cuts.
Australia Still Has A Tightening Bias
The Reserve Bank of Australia (RBA) presents a different case. It kept the cash rate at 4.35 percent on 16 June after increasing it by a combined 75 basis points earlier in the year. Inflation remains too high, although tighter financial conditions are starting to slow the economy. Further tightening remains possible if inflation expectations rise, but for now the pause gives the board time to assess the delayed effect of earlier increases.
China And India Face Different Domestic Pressures
In the two largest emerging economies, the People’s Bank of China retains an easing bias, with weak household spending and property-market stress outweighing inflation, while the Reserve Bank of India must weigh cheaper energy against food-price risk from weaker crop yields. Both have reason to wait.
The Bigger Picture: Lower Oil Does Not Mean A Return To The Old Rate Regime
The broad message from markets and central banks is increasingly aligned. Investors believe the immediate energy shock is fading, while policymakers are gaining room to pause and assess domestic conditions rather than react to every movement in oil.
However, lower energy prices do not mean that interest rates will return to the unusually low levels seen before and during the pandemic. Competition for global capital, stronger investment needs and persistent inflation risks can keep borrowing costs structurally higher. Central banks may therefore pause without moving quickly towards aggressive rate cuts.
The result is a more fragmented global policy environment. The Federal Reserve, Bank of England and Bank of Canada have strong reasons to wait. The European Central Bank and Bank of Japan have already tightened in response to specific inflation and currency pressures. Australia retains a tightening bias, while China remains focused on weak domestic demand and India must balance lower energy costs against the risk of rising food prices.
The decisive shift is that the Middle East energy shock is no longer the only force driving markets or monetary policy. As oil retreats, investors and central banks are turning back towards the deeper questions that will shape the next phase of the global economy: whether inflation remains persistent, whether growth can withstand higher borrowing costs and whether today’s higher-rate environment represents a temporary adjustment or a lasting structural change.
For Bitcoin, the read is unchanged from last week’s issue: a Federal Reserve holding rather than hiking, disinflation arriving slowly and fiscal expansion still building keep the regime a tailwind for hard assets over duration.
The metric to watch is the term premium, the extra yield investors demand for holding a long-dated bond to maturity instead of rolling over short-term debt. The New York Fed’s ACM model, the standard estimate, put the 10-year term premium at 0.65 percent. The configuration to look for is the premium grinding higher while fed funds futures continue to price an extended hold: if long-end yields keep rising while policy expectations stay anchored, the fiscal-risk leg of the thesis, not the disinflation leg, is doing the work.
What Would Prove This Wrong
Our view is that the energy shock is fading, the Federal Reserve stays on a trapped hold and the regime remains a tailwind for hard assets. Several developments would break that thesis.
Energy: Brent’s monthly average moving back above $95 per barrel, or a renewed Strait of Hormuz disruption taking WTI above $90, would revive the inflation shock.
Inflation: Core CPI back above 3 percent, or core PCE above 3.4 percent for two consecutive prints, would show the energy shock has spread into services and wages.
Labour: Two consecutive payroll prints below the Fed’s 15,000 to 87,000 breakeven range, or unemployment above 4.5 percent with participation holding steady, would signal the market is breaking rather than cooling.
Rates: The 10-year TIPS real yield, 2.31 percent on 9 July, breaking sustainably above 2.5 percent while inflation expectations stay contained, would show the fiscal premium dominating disinflation and would end the tailwind thesis.
Central-Bank Pause: Renewed tightening at the Bank of Japan’s 30-31 July meeting, or another ECB increase, would break the read that falling oil gives policymakers room to wait.
