

Issue #212:
BTC Finds Floor As June Selling Fades
A Failed Breakdown Meets a Trapped Fed
June was not just a weak month for Bitcoin; it revealed a market where both spot demand and institutional flows had faltered.
Bitcoin closed June 2026 down 20.48 percent, its worst June since 2022 and second-worst since 2013, after falling to a fresh low of $57,803. The decline was likely intensified by waning STRC demand and a record six-week streak of Bitcoin Exchange-Traded Fund (ETF) outflows.
However, BTC’s quick recovery above $60,000 suggests the move below the prior $58,000 floor may have been a failed breakdown rather than a sustained leg lower. The rebound began before softer employment data lifted broader risk sentiment, indicating that spot demand had started to return at marginal lows.
July seasonality supports a firmer setup, with historical average and median gains of 7.6 percent and 8.16 percent, respectively. Still, a sustained recovery will likely depend on the return of stronger demand, particularly through renewed ETF inflows.
Meanwhile, US inflation is running on two tracks. Energy relief is real but slow, with retail fuel prices lagging the fall in crude, while defence spending and the artificial intelligence build-out add demand pressure in the same scarce industrial inputs. The labour market, cooling but still expanding above its breakeven pace, gives the Federal Reserve no reason to shift its focus away from price stability. The Fed is therefore trapped: it cannot ease into a fiscal expansion, and employment is not forcing its hand.
On balance, we read this regime as a tailwind for bitcoin: the Fed’s next move is still a cut, delayed rather than derailed, and a slow-disinflation, fiscal-expansion mix is one in which hard assets outperform duration.

Market Signals
July Could Bring Relief After A Bearish June
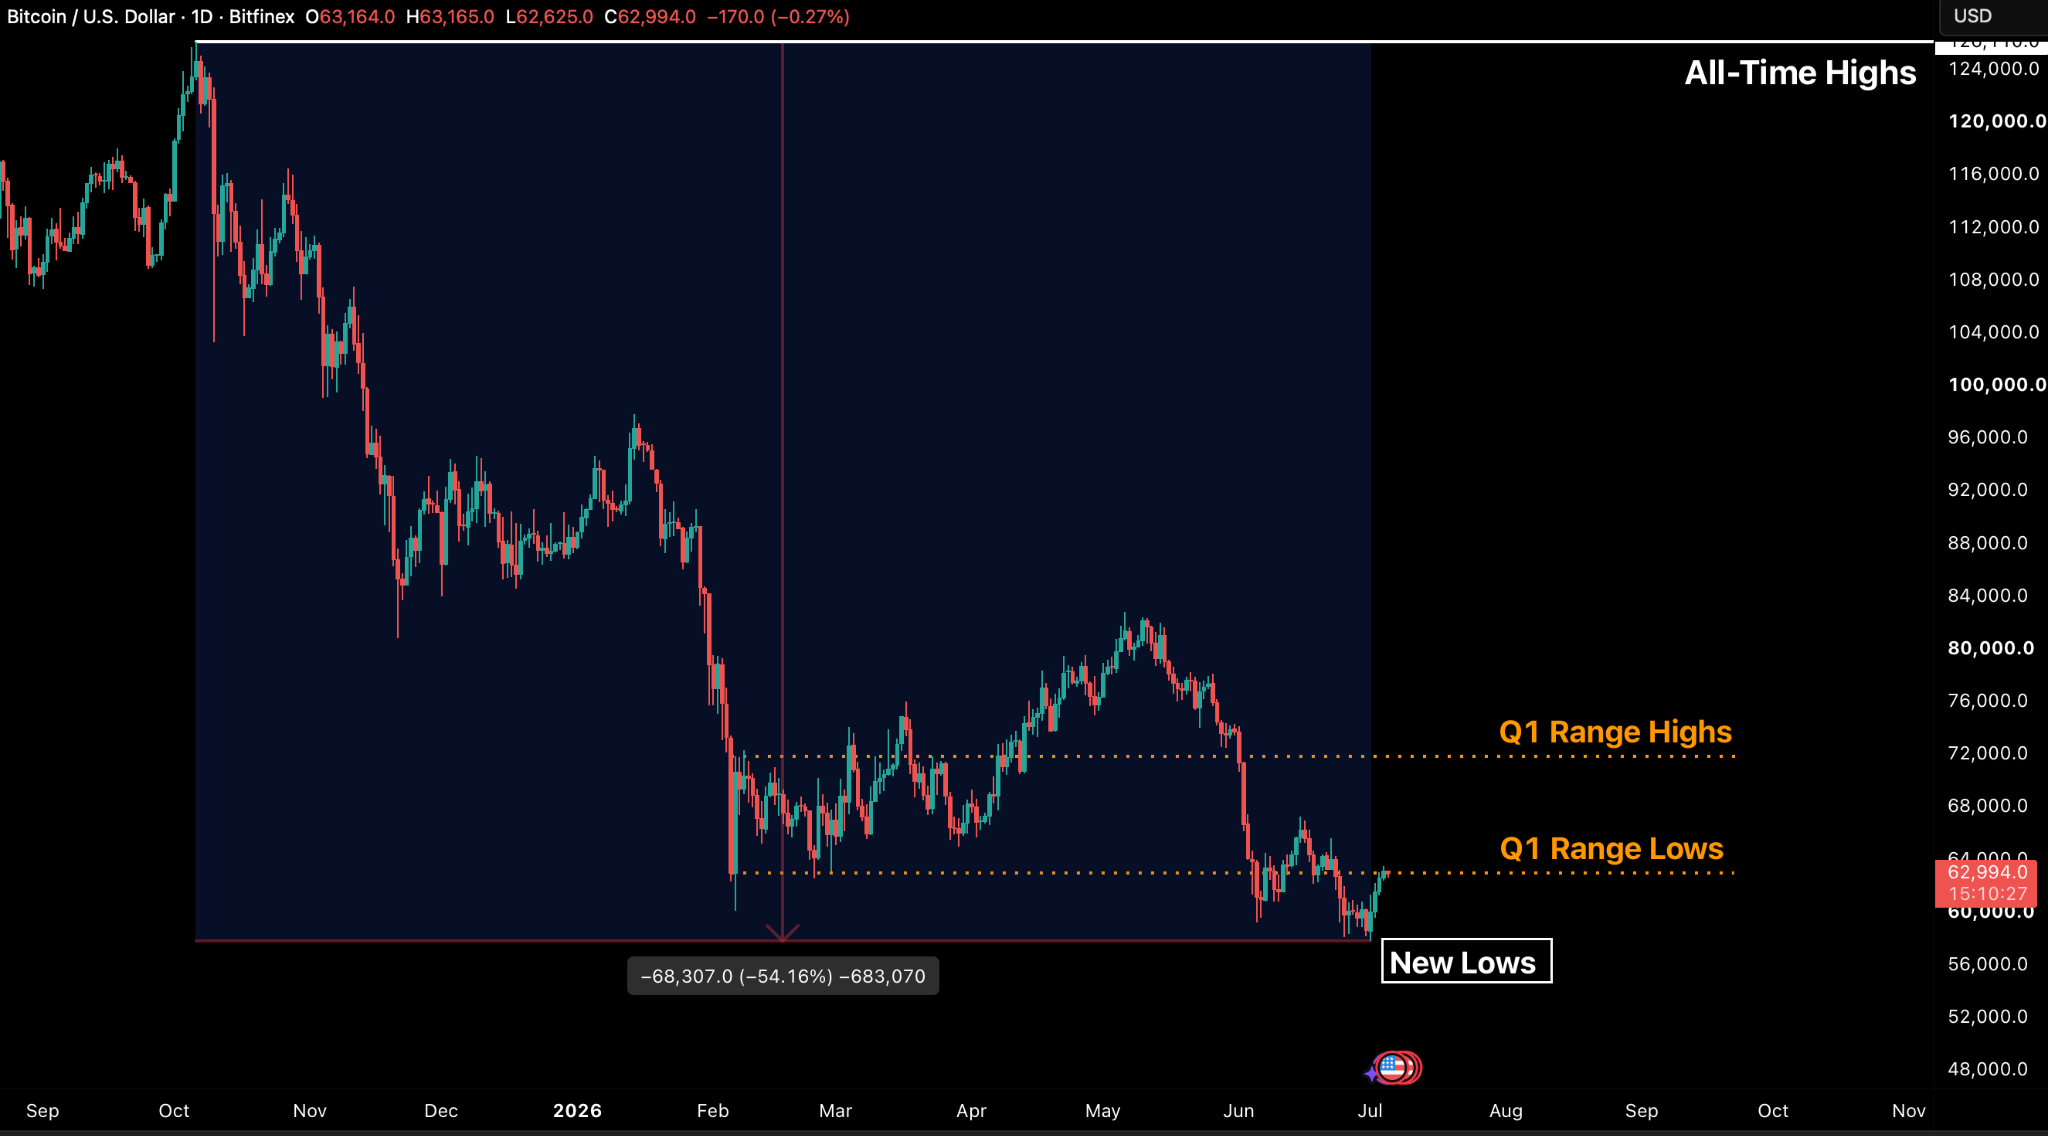
Bitcoin closed June 2026 down 20.48 percent, its worst June since 2022 and the second-worst June since 2013. Last week also brought a fresh BTC low with a Monthly Open at $57,803, some 54.16 percent below the current cycle highs.
BTC ticked higher after that low, and it is too early to tell whether the cycle lows are in, but in prior bear-market years June and November have been the weakest months, which points to a firmer July.
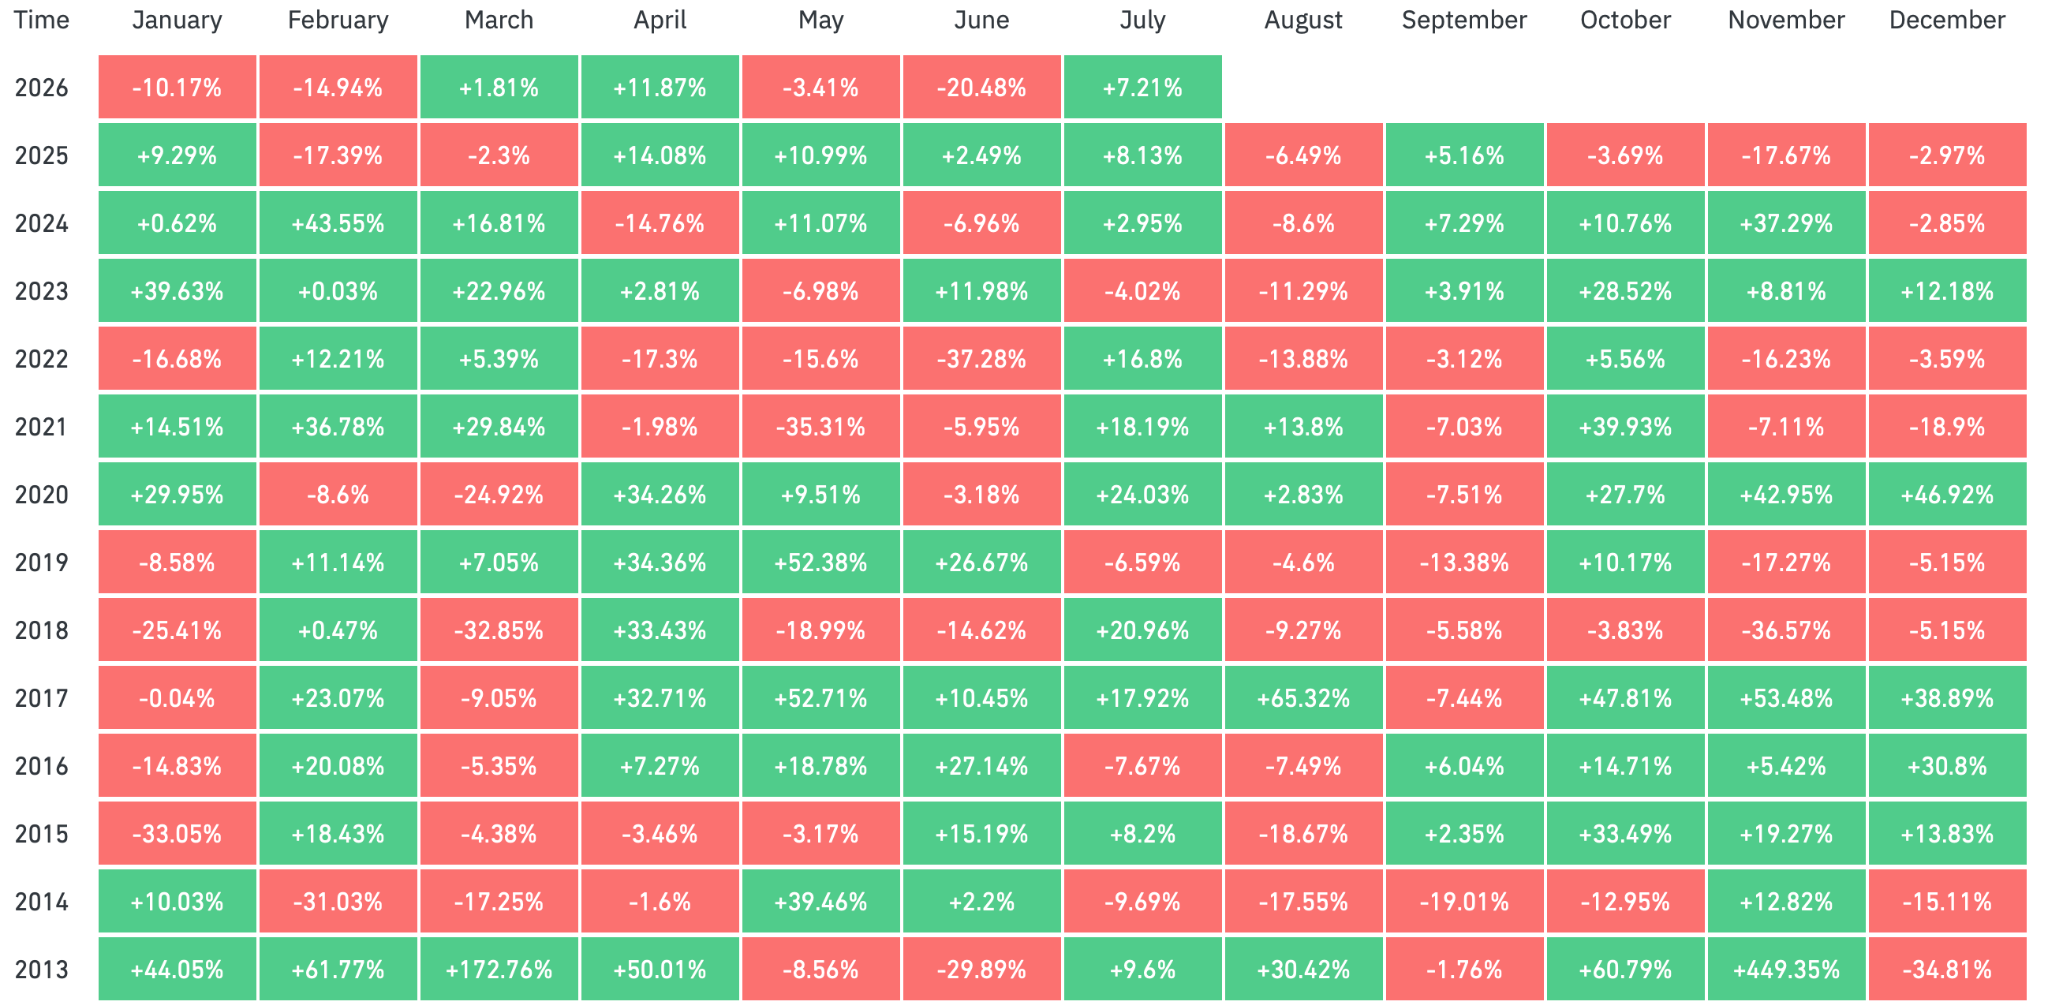
June’s downside was likely deepened by the failure of both principal demand engines: waning STRC demand and ETF outflows that represented the worst streak on record. The month closed down 20.48 percent from its monthly open, far below the seasonal median of negative 1.5 percent. That sharp deviation left the market technically oversold heading into July.
This sets the stage for a potential recovery, but only if one of the demand engines is repaired. The most likely route is the ETF sector, where a broader recovery in risk assets could feed through into inflows.
Seasonality supports the current setup but will not drive it. Coinglass data shows July has averaged a 7.6 percent gain with a median of 8.16 percent, and these positive moves often follow a weak June. July delivered double-digit gains in both 2018 and 2022 bear cycles.
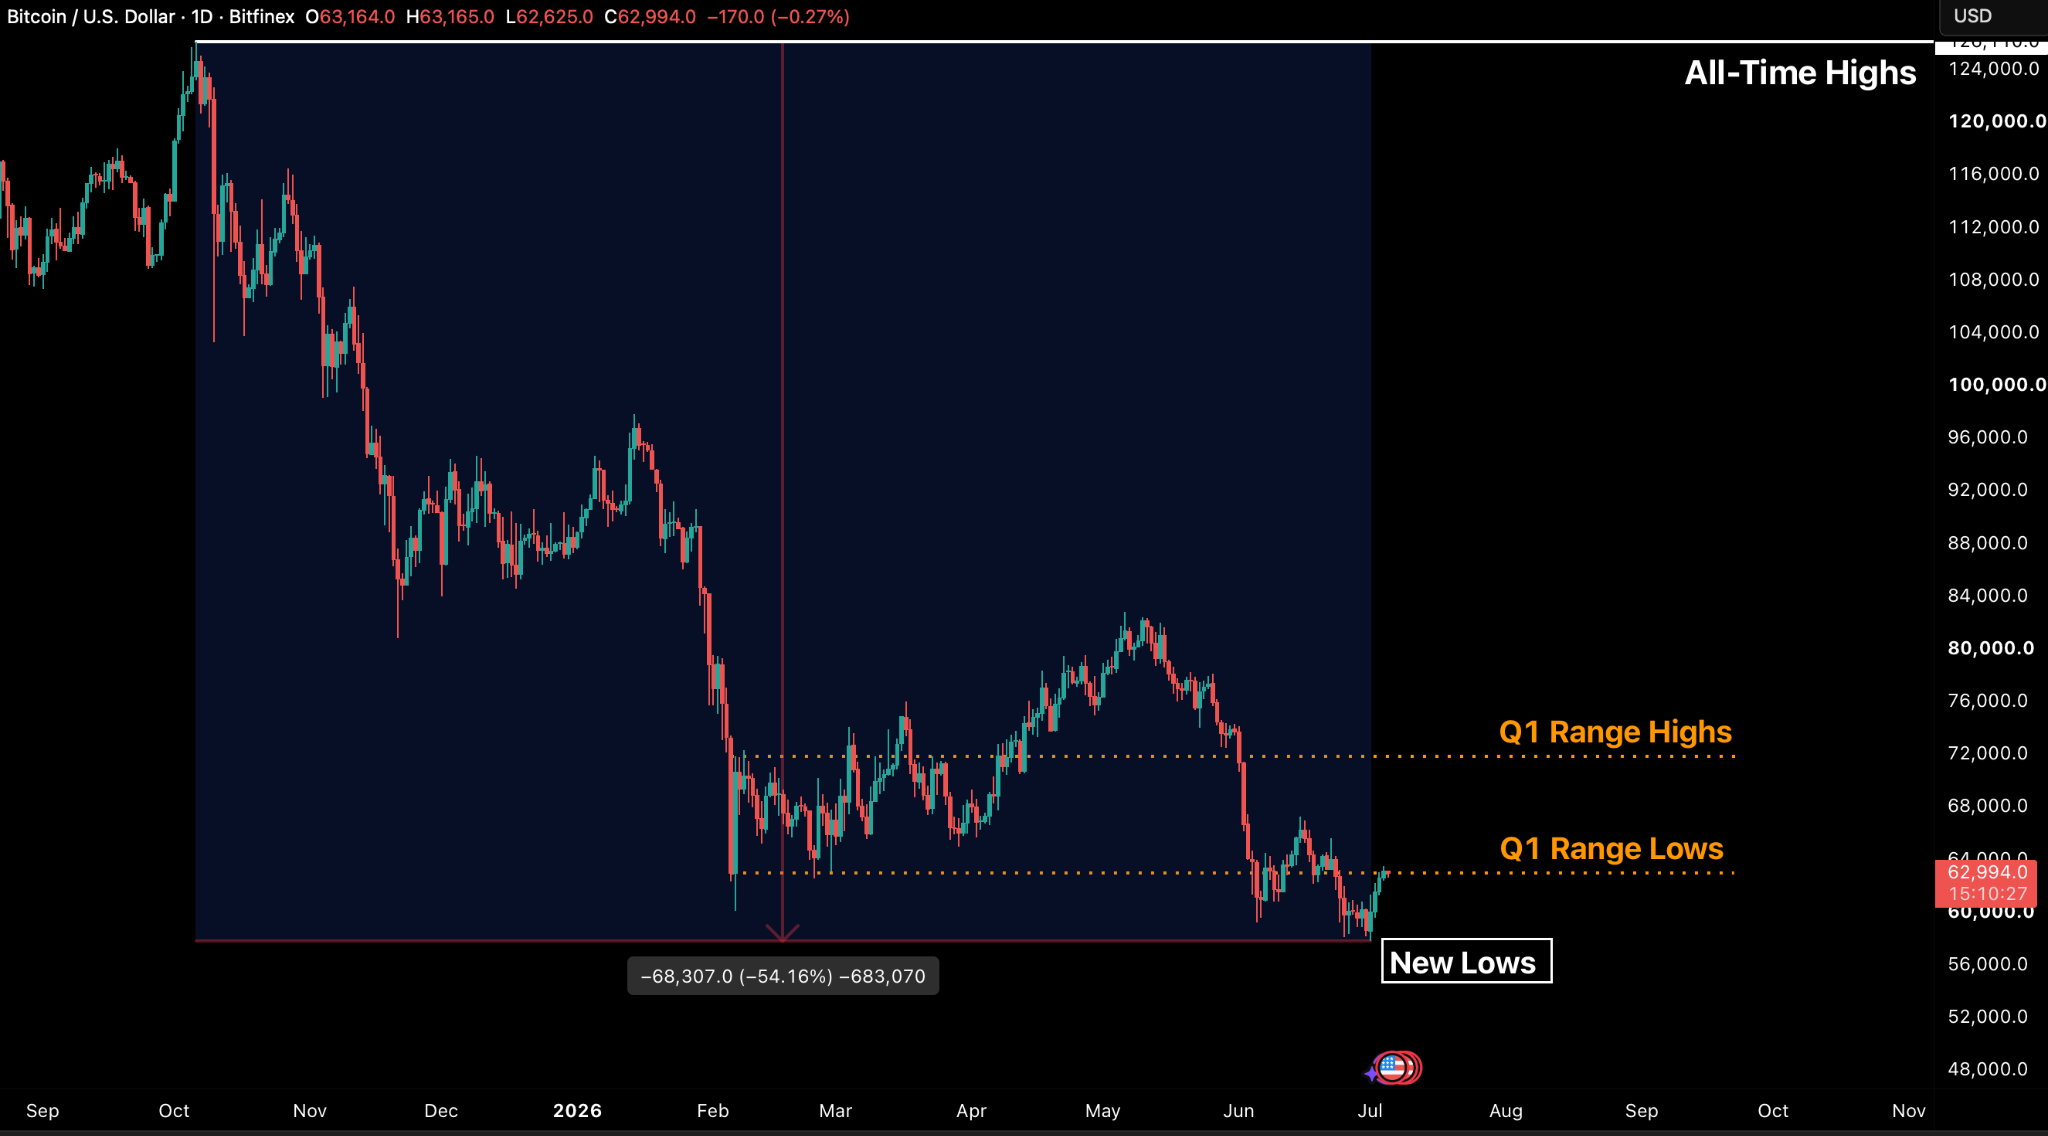
BTC reclaimed the $60,000 level within four trading sessions after falling below it on 1 July. The brief slide below the prior week’s $58,000 floor now looks like a failed breakdown, a sign of underlying stability rather than a sustained move lower.
Positively, BTC led the recovery on its own steam with the pivot from $57,803 beginning intraday on 1 July, ahead of the softer June employment data, released on 2 July that revived global risk sentiment.
The sequence matters: spot demand emerged at a fresh marginal low before the macro-driven rally, in contrast to the steady exhaustion of buyers seen over the prior weeks.
June also closed with a record volume of net redemptions, a six-week run of outflows and the longest stretch of weakness since these products launched.
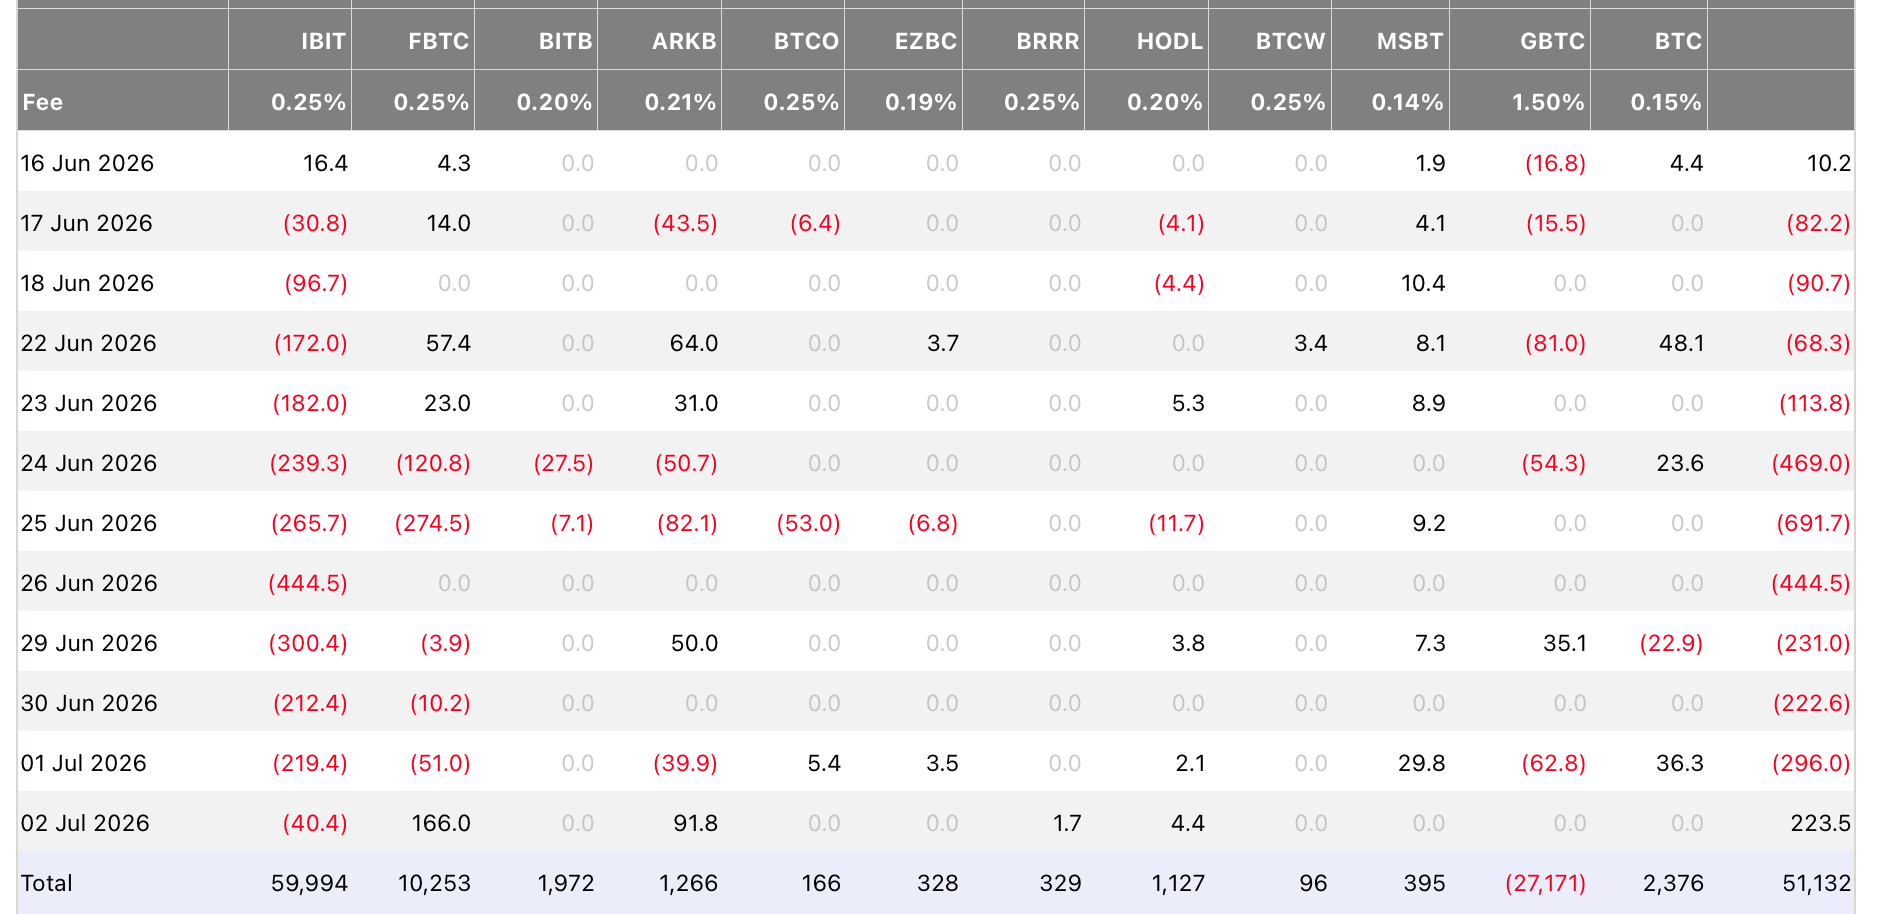
The $223.5 million inflow recorded on 2 July offered the first reprieve from the bearish regime run, but its composition matters more than its size. Continued redemptions in BlackRock’s IBIT indicate the print was driven by a temporary broadening of participation across smaller funds rather than a return of the marginal institutional buyer. Until IBIT itself flips back to sustained inflows, the structural institutional bid remains unproven.
One session of inflows however is insufficient to reverse the technical damage inflicted from six consecutive weeks of selling.

General Macro Update
Two-Track Inflation: Energy Relief Meets Defence Demand
US inflation is now running on two tracks. Energy prices are falling, but the pass-through to retail fuel is slow, so the disinflation it delivers arrives late. At the same time, rising defence orders and the artificial intelligence infrastructure build-out are lifting demand for the same scarce industrial inputs, adding fresh price pressure from the demand side. The Federal Reserve sits between the two tracks: it cannot ease into a fiscal expansion, and, as the labour data below shows, employment is not forcing its hand either.
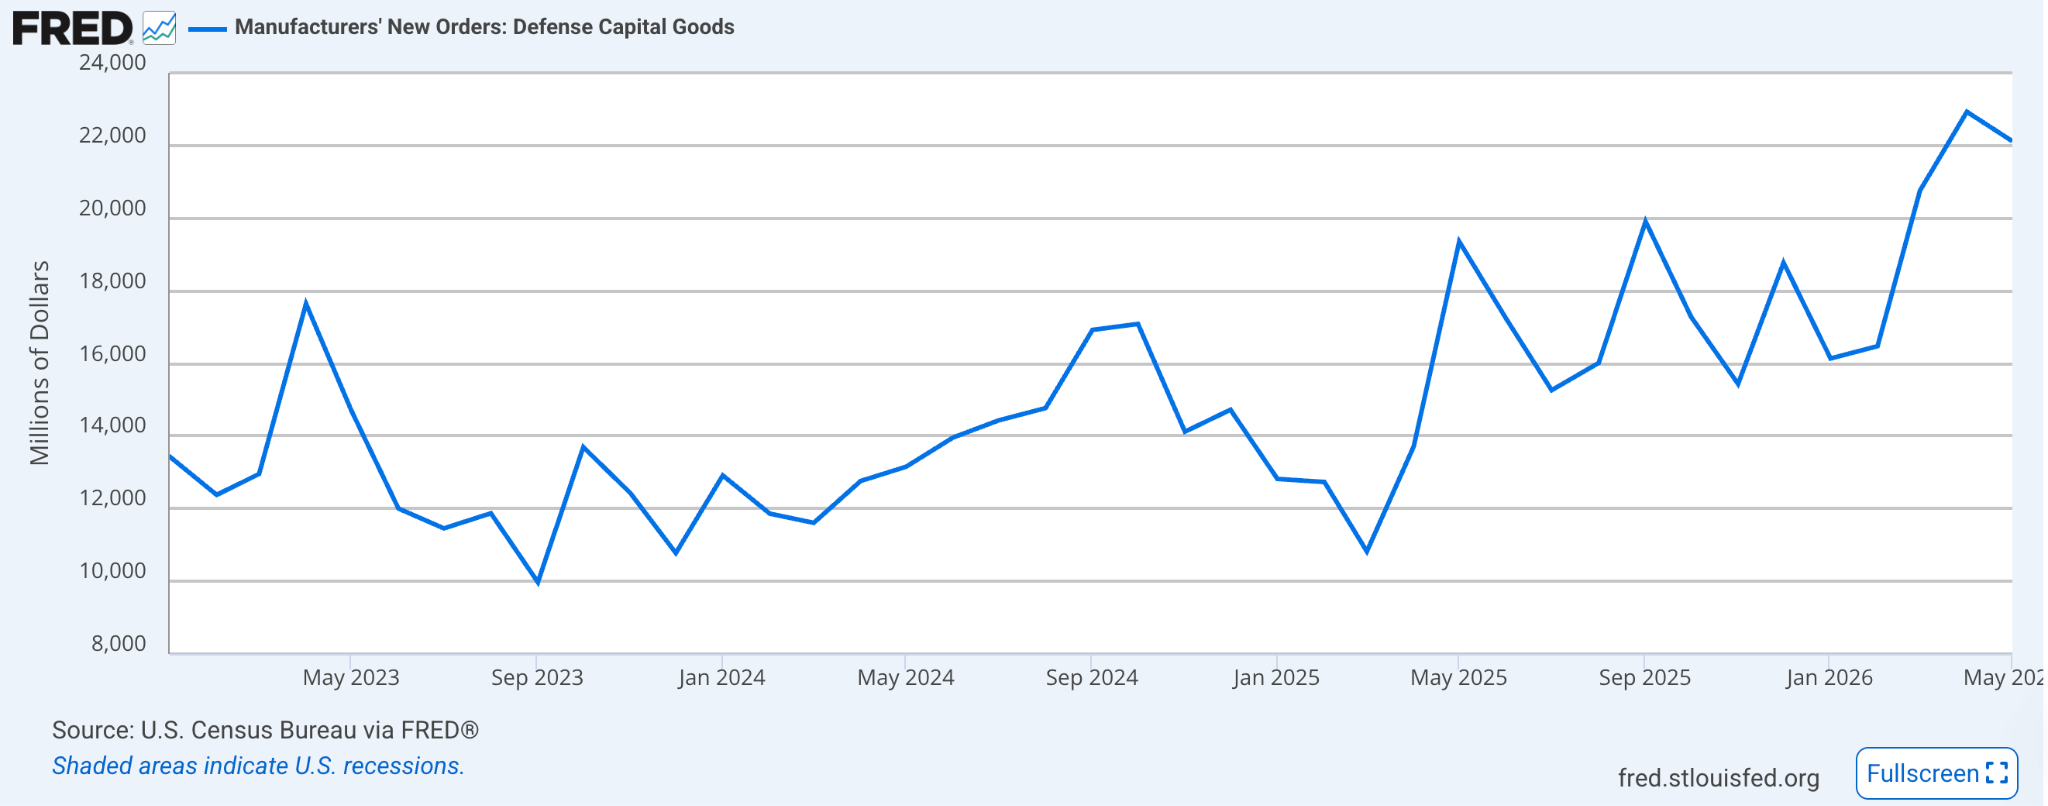
The defence spending signal comes from Manufacturers’ New Orders: Defense Capital Goods, a data series released by the US Census Bureau through the Manufacturers’ Shipments, Inventories, and Orders (M3) Survey. The latest figures show that defence-related capital goods orders have moved higher, with April orders reaching about $22 billion and the 12-month total rising to $225 billion, 27 percent above the same period last year.
Last week’s lead argued the Iran truce would pull oil lower and unwind the energy premium, and the move since has confirmed it. These two developments point in different directions for inflation. Lower oil prices can cut costs for households and businesses, especially through fuel and transport. Higher defence spending can do the opposite when it lifts demand for machinery, metals, electronics, aircraft, ships, missiles, communications equipment and other specialised goods.
Oil prices have already fallen sharply. West Texas Intermediate (WTI) crude declined from $114 on 7 April to about $68 as of 6 July, a drop of roughly 43 percent. The move in retail fuel prices has been slower. Gasoline fell from $4.30 per gallon on 18 May to $3.70 as of 29 June, a decline of 14 percent. Diesel fell from $5.6 per gallon on May 18 to $4.70 as of 29 June, or 17.80 percent.
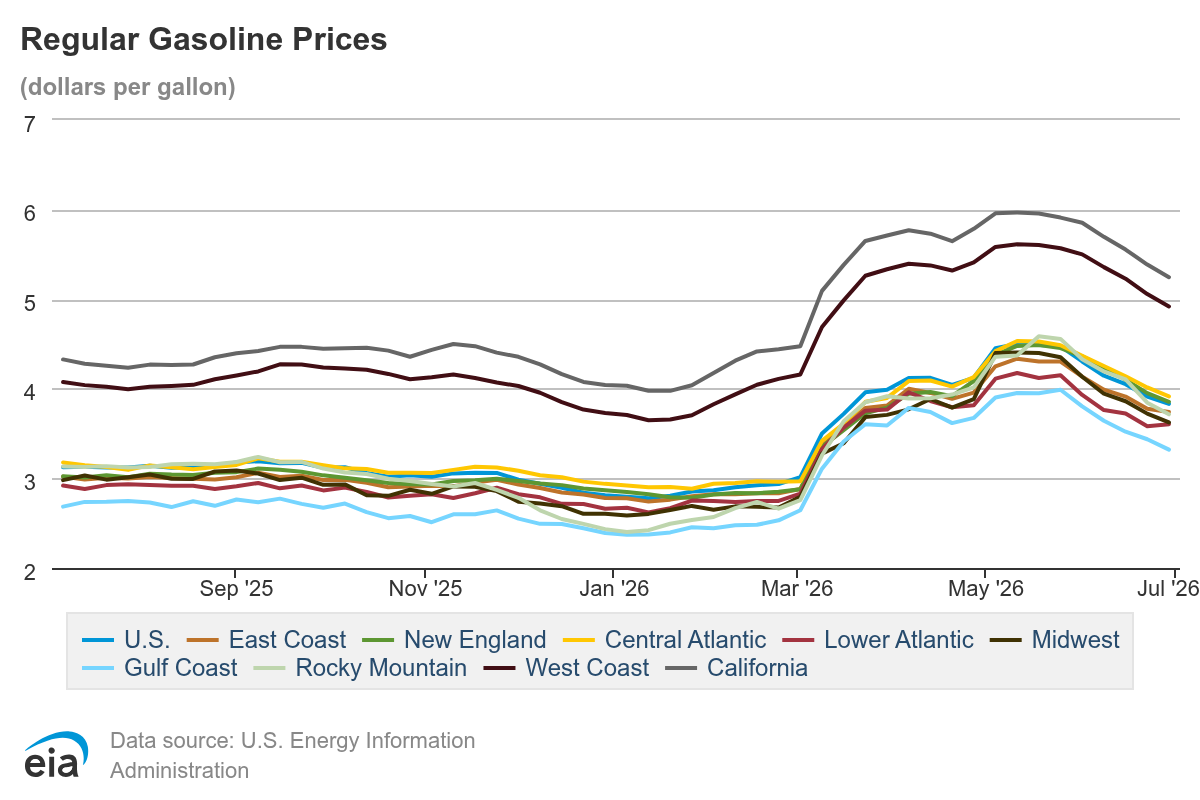

The slower pace of decline for gasoline and diesel matters because consumers often expect fuel prices to fall as fast as oil prices. In practice, the pass-through is slower. This is because fuel companies and distributors still need to sell inventory that they bought when prices were higher.
Inventories also need rebuilding. The US holds a Strategic Petroleum Reserve for crude oil, but nothing similar for gasoline. When gasoline stockpiles fall during periods of stress, the market needs time to refill them. That delay can keep retail prices above the level implied by crude oil alone.
Supply chains also remain uneven. At the peak of wartime disruptions, part of the oil barrel that would normally feed gasoline production was redirected towards jet fuel, where export demand was high. Jet fuel exports rose by more than 200,000 barrels per day in March and April. Even as those exports slow, refiners cannot immediately reverse production flows, which delays a full recovery in gasoline supply.
Fuel prices may still fall, but they may not move quickly towards $3 per gallon. Wholesale gasoline prices already sit well below retail, so the direction of travel remains lower. Timing is the issue. The adjustment is more likely to unfold later this year or early next year, rather than immediately.
For the Federal Reserve, slower fuel disinflation creates a challenge. Falling energy prices can help cool headline inflation, which includes food and energy. If fuel prices decline slowly, though, households may not feel relief right away, and
transport costs stay sticky for businesses.
The defence spending outlook adds another complication. Monthly new orders for defence contractors have already risen, and a broader increase in defence outlays is expected to support gross domestic product (GDP) in the second half of the year and into next year, because government spending lifts demand for goods, services and labour.
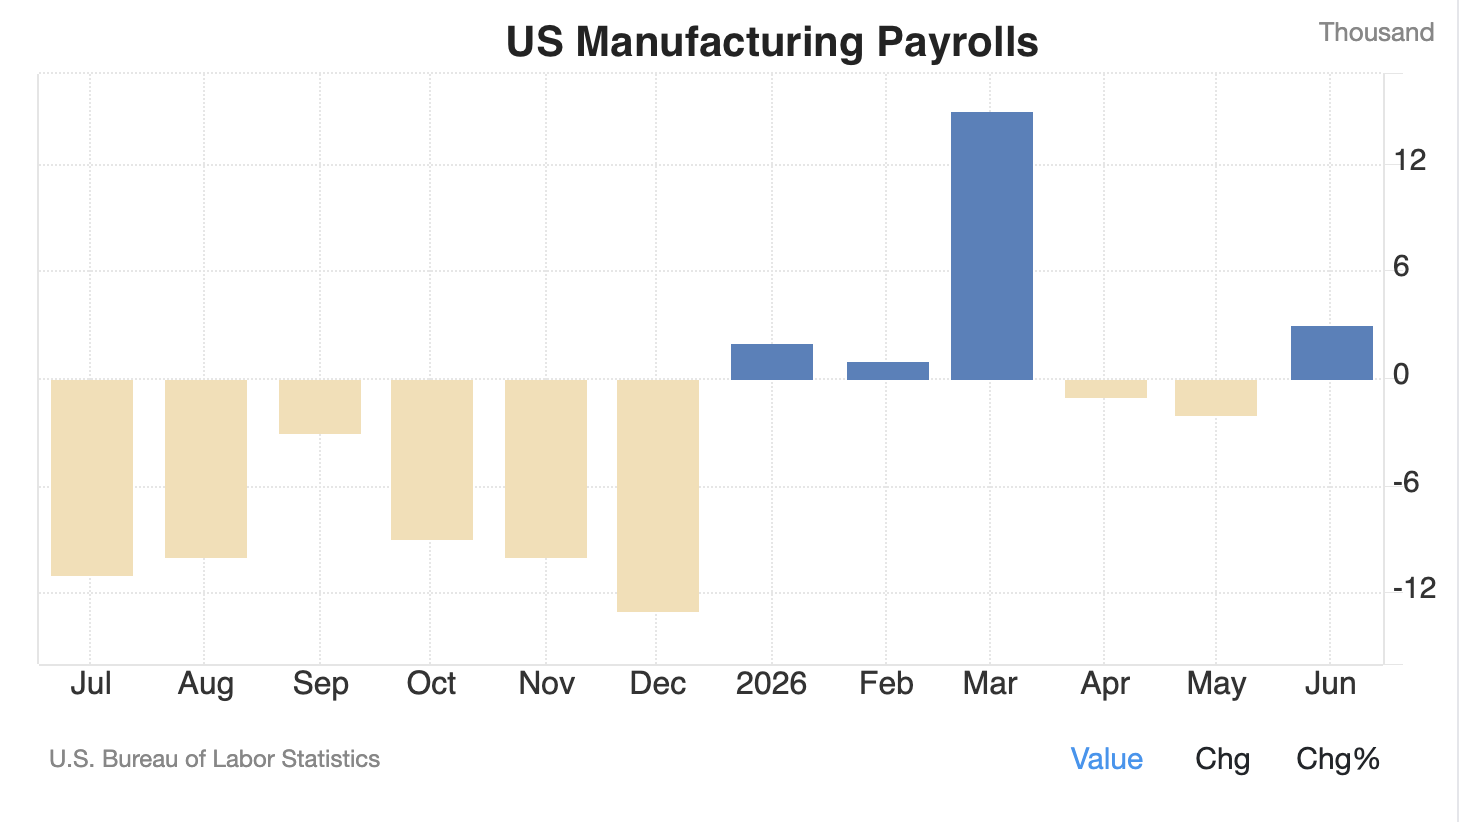
The labour market is already feeling some of this. Manufacturing added 25,000 jobs in the first five months of the year, helped by stronger demand tied to defence production. Higher employment can support household spending, which feeds back into growth.
Growth driven by government spending can come with a cost. Defence production draws on many of the same scarce inputs the private sector needs, especially technology, advanced manufacturing, metals, and electrical components. The build-out of artificial intelligence infrastructure is already driving a heavy capital expenditure cycle in exactly those inputs.
If defence contractors and technology firms compete for the same workers, parts, and materials, prices can rise. That is the main inflation risk. The deeper issue is timing: public and private demand may climb at the same time in areas where supply is already tight.
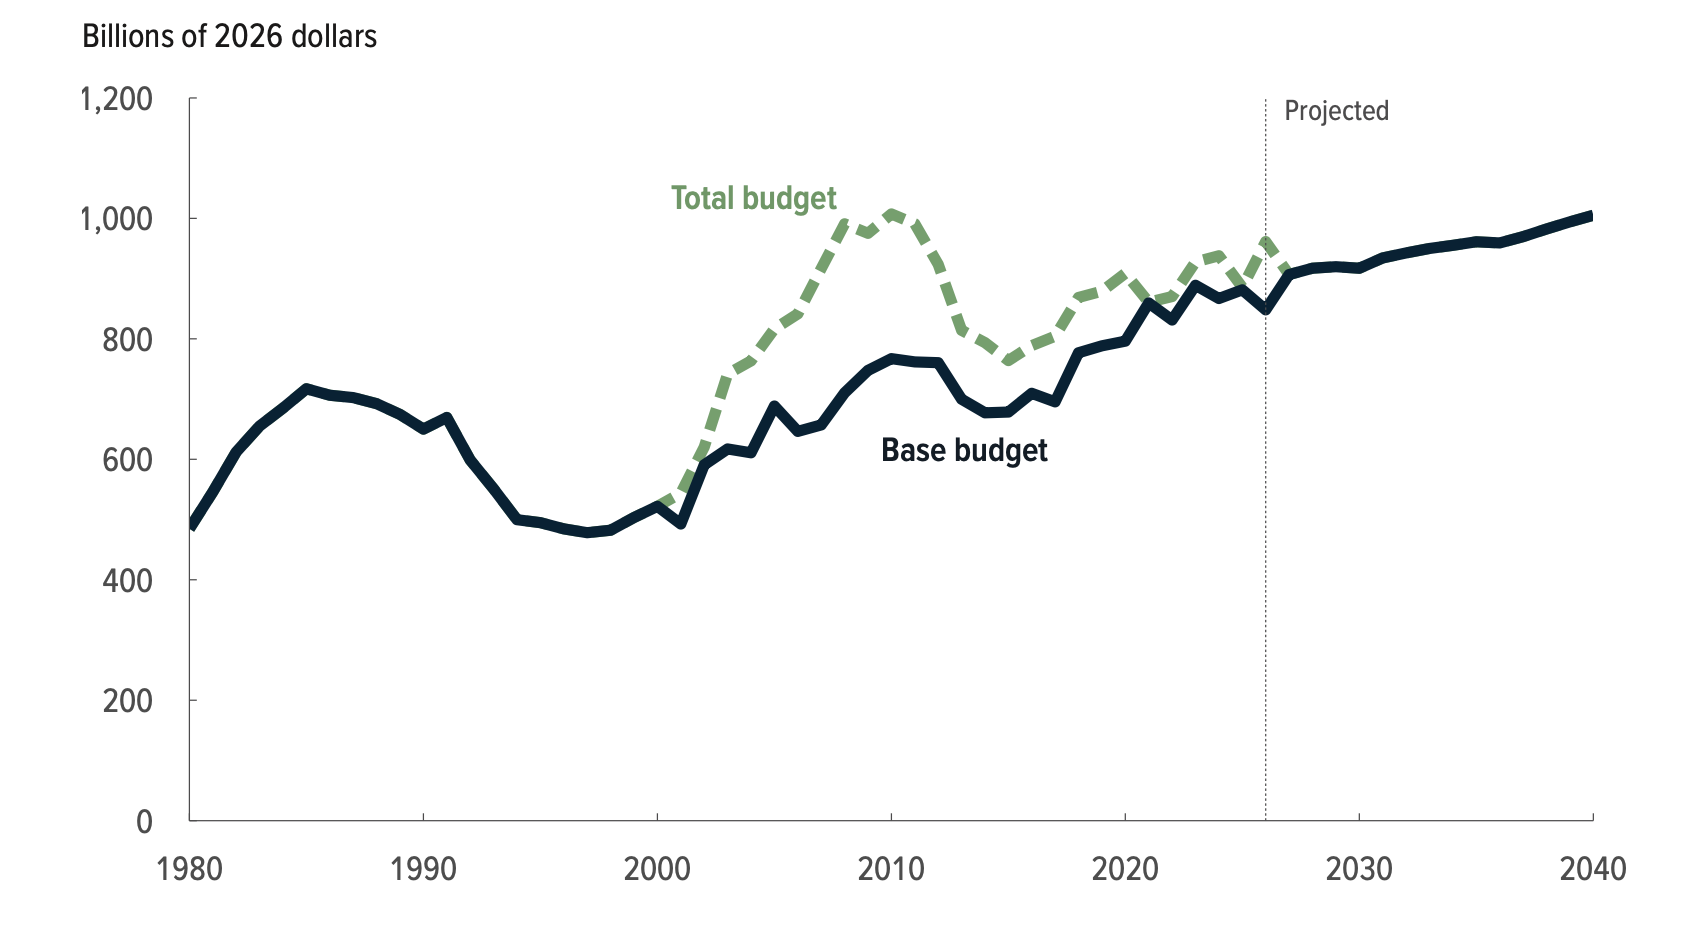
The proposed defence budget shows how large that demand could become. The Congressional Budget Office (CBO) said the Department of Defense fiscal year request totalled $961 billion, including $113 billion from the 2025 reconciliation act. Adjusted for inflation, the request ranked among the largest in 50 years. A separate supplemental request linked to the Iran war totalled $87.6 billion, with the final measure likely to exceed $100 billion as the US rebuilds weapons inventories and invests in drones, robotics, and related supply chains.
This raises the classic ‘guns and butter’ issue. The phrase describes a government trying to spend heavily on defence while also supporting domestic economic priorities. Fund both at once without enough offsetting revenue or spending restraint, and demand can exceed supply, pushing inflation higher.
The lesson from past periods of military expansion is clear. Defence spending can be necessary and can support short-term growth, yet it does not automatically create stronger long-term productivity. Poorly funded, it can also crowd out private investment. The near-term macro picture is therefore mixed.
Lower oil prices should eventually help reduce fuel costs and ease part of the inflation burden, though the benefit may come slowly because inventories, refining patterns and global pricing dynamics delay the adjustment.
At the same time, defence spending may lift GDP and support manufacturing, while also adding inflation pressure if it competes with private technology investment for the same limited resources. For markets, the key conclusion is that energy relief may soften inflation at the margin, while fiscal expansion through defence spending could keep medium-term inflation and interest rate risks elevated.

Employment Isn’t Forcing A Cut Either
If the labour market were cracking, the Fed’s dilemma would resolve itself, since employment weakness would justify cuts regardless of the inflation outlook. The June data shows no such forcing function. The US labour market is slowing, but job creation, vacancies and wage growth still point to a labour market that is holding steady, leaving the Fed free to keep its focus on inflation.
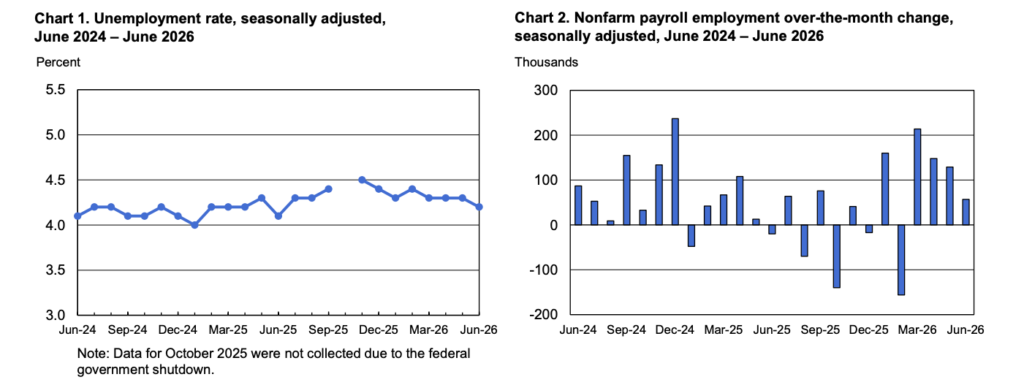
Figure 9: Unemployment Rate (Source: Bureau of Labor Statistics)
The latest employment picture is drawn from two key releases by the US Department of Labor’s Bureau of Labor Statistics (BLS): the June Employment Situation report and the May Job Openings and Labor Turnover Survey (JOLTS). Together, these reports show that headline labour data has become harder to read, because monthly figures are being revised often, while hiring trends and job openings still point to steady labour demand.
The June Employment Situation report showed that the US economy added 57,000 jobs in June. The BLS also revised the previous two months of employment gains down by 74,000, so the first estimate of monthly job creation should be read with care. A single month’s jobs number can often change, which is why the three-month and six-month averages now give a clearer view of the labour market.
The three-month average stood at 111,000 jobs, the six-month average at 92,000. Both sit above the level needed to keep the labour market stable. A breakeven jobs rate is the number of new jobs required each month to absorb workers entering the labour force and keep unemployment steady.
Federal Reserve estimates put that breakeven pace in a wide range, from about 15,000 to 87,000 jobs per month, with the spread reflecting uncertainty over immigration flows and slower labour force growth. Even at the upper end of that range, the recent three-month average of 111,000 suggests hiring remains strong enough to support the wider economy.
The unemployment rate eased to 4.2 percent in June, though the decline said little about the underlying strength of labour conditions. The rate fell partly because 720,000 people left the labour force, with participation dropping 0.3 percentage points to 61.5 percent, the lowest since March 2021. When people stop looking for work, they are no longer counted as unemployed, which can pull the rate down even when the labour market has not improved. The household survey also showed a decline of 507,000 workers, adding further noise to the monthly reading.
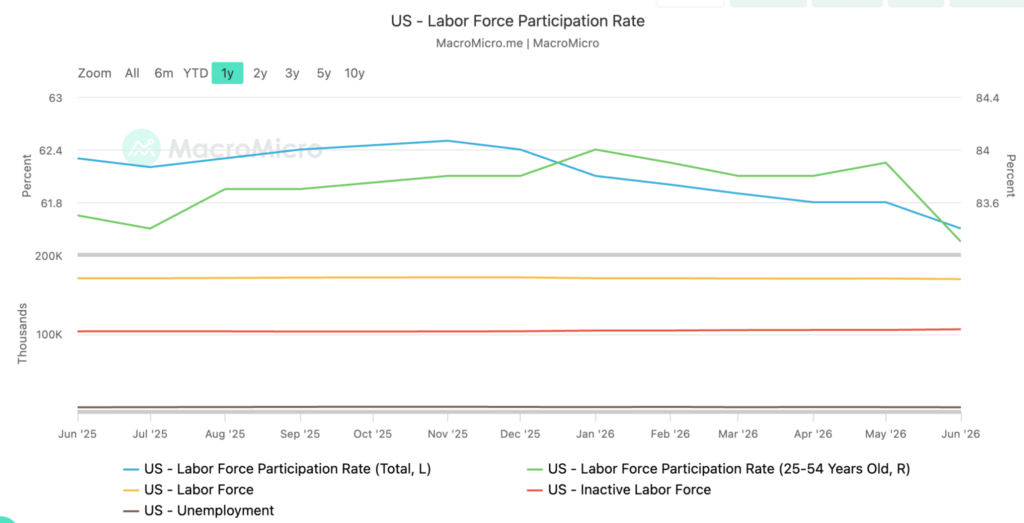
Figure 10: Labour Force Participation, Percent (Source: US Bureau of Labor Statistics)
Sector data was mixed. Private education and health services added 69,000 jobs and stayed one of the strongest areas of hiring, led by health care and social assistance. Professional and business services added 36,000 jobs, construction gained 11,000 and manufacturing added 3,000. Leisure and hospitality fell by 61,000 jobs in June, after May’s gain in the sector was revised down from 70,000 to 40,000. Retail trade and information also recorded job losses.
Wage growth remained firm but did not point to renewed labour market pressure. Average hourly earnings rose 0.3 percent in June and 3.5 percent from a year earlier. The median duration of unemployment stood at 11 weeks, close to its level for most of the year, which suggests workers who lose jobs are not facing a sharp rise in long-term unemployment.
The May JOLTS report added another layer. Job openings rose by 9,000 to 7.594 million by the end of May, the highest level since May 2024. There were 1.04 jobs available for every unemployed person, little changed from April and slightly above the 1.01 ratio recorded a year earlier. That ratio matters because it shows how many vacancies exist relative to the number of people looking for work.
A reading above 1.0 means there are still more available jobs than unemployed workers.
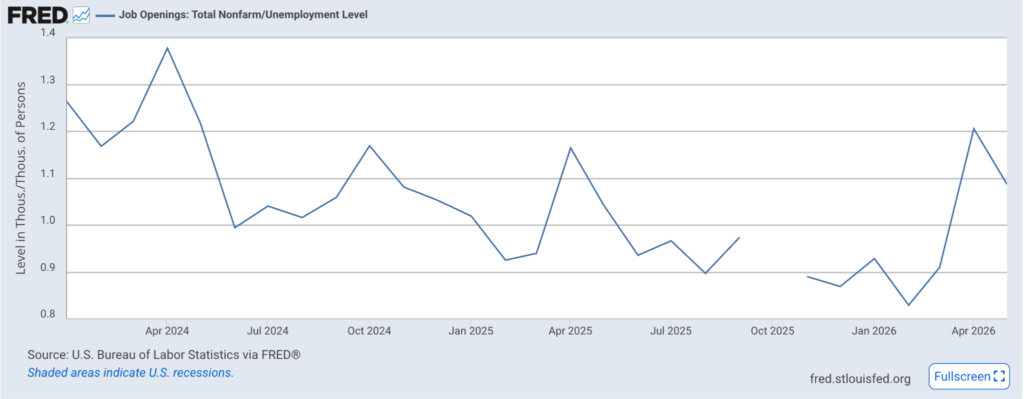
Figure 11: Job Openings and the Openings-to-Unemployed Ratio (Source: US Bureau of Labor Statistics, JOLTS)
The rise in openings did not translate into stronger hiring. Hiring held broadly steady at about 5.2 million in May, with the hiring rate at 3.3 percent. Businesses may still have open roles, but they are moving more slowly to fill them. Vacancies rose in wholesale trade, leisure and hospitality, construction, and manufacturing, while openings fell in health care and social assistance, finance and insurance, and transportation, warehousing and utilities.
The JOLTS deserves caution too, because survey participation has declined. A lower response rate makes the data less reliable, since fewer businesses are reporting, which raises the risk that the sample does not fully reflect the broader labour market.
For markets, the main message is that the labour market has cooled without deteriorating. Softer hiring and lower oil prices reduce pressure on the Federal Reserve to raise rates in the near term. At the same time, steady job openings and above-breakeven employment gains mean the central bank does not yet face strong pressure to prioritise the employment side of its mandate.
This keeps the Fed focused on price stability. If inflation stays the bigger risk, the Fed can hold rates while it waits for clearer evidence that price pressures are easing.
The takeaway is that investors should not overreact to one monthly jobs print. Large revisions, weaker survey response and mixed sector data make short-term labour numbers less conclusive. The more reliable signal is that the US labour market is still expanding at a slower but stable pace, which supports a less hawkish outlook while leaving the Federal Reserve cautious on inflation.
What Would Prove This Wrong
This view rests on two claims that are simple to test. The first is that energy relief is coming, but slowly. That thesis breaks if retail gasoline and diesel fail to converge towards the lower wholesale prices within the quarter, or if WTI reverses back above roughly $90 a barrel on renewed supply disruption through the Strait of Hormuz. Either would mean the pass-through has stalled rather than merely lagged, and that the disinflation expected from the oil move is not arriving. The second claim is that defence spending adds a medium-term inflation risk by competing with private capital expenditure for the same scarce inputs. The clearest confirmation of that channel would be core goods or core Personal Consumption Expenditures (PCE) reaccelerating in the categories most exposed to defence and artificial intelligence demand, such as metals, electronics and machinery. If those prices stay contained even as defence orders climb, the crowding-out risk being flagged here is not materialising.
The growth leg of the argument is equally testable. The base case expects higher defence outlays to support GDP and manufacturing employment into next year, so if defence new orders roll over rather than feed through to output and factory payrolls, that support will not exist. A material fall in the 10-year Treasury yield and market-based inflation expectations, as fuel disinflates faster than expected, would weaken the case for medium-term rate and inflation risk staying elevated rather than confirm it. Each of these will be checked against the primary data in the next issue.
The read from the June Employment Situation Report is that the labour market is cooling but still stable, which is a testable claim. The thesis breaks down however if payrolls printed below the breakeven pace, which the Federal Reserve now places anywhere from roughly 15,000 to 87,000 jobs a month, for two consecutive months. This would have the effect of dragging the three-month average toward zero and turning the slowdown into contraction. It would also break if the unemployment rate climbed above about 4.5 percent for the wrong reason, with household employment falling while participation held, rather than the participation-driven drop seen in June. On the demand side, the signal would reverse if the JOLTS openings-to-unemployed ratio fell below 1.0 and the hires rate broke below roughly 3.2 percent, which would mark genuine demand destruction rather than employers being slow to fill roles. A sharp rise in the median duration of unemployment from its current 11 weeks toward the high teens would signal long-term unemployment building beneath the still-firm headline. Each of these elements will be checked against the next BLS releases.
Finally, the committed read on Bitcoin fails if real yields rise rather than fall from here, with the fiscal and inflation premium dominating the disinflation impulse, or if Federal Reserve communication signals that the next move may not be a cut.
