
Complacency Bounce Reaches Resistance
BTC spot prices have recovered 13 percent off its low, but this reflects selling exhaustion, not demand. Our view below on the triggers that decide the next leg and what to expect for this week’s FOMC.
Bitcoin has recovered roughly 13.5 percent from its 5 June cycle low of $59,200, tagging $67,259 on 15 June before stalling and easing back to under $65,000 as today’s Federal Reserve rates decision approaches. This will be the first Federal Open Market Committee meeting under the new chairman Kevin Warsh, and will also be accompanied by a new ‘dot plot’ of FOMC members’ forward-looking rate expectations. As we noted in this week’s Bitfinex Alpha report, this bounce has been built on seller exhaustion and a macro reprieve, rather than any fresh demand. Until that changes, we see a relief rally inside a range rather than the start of a new trend.
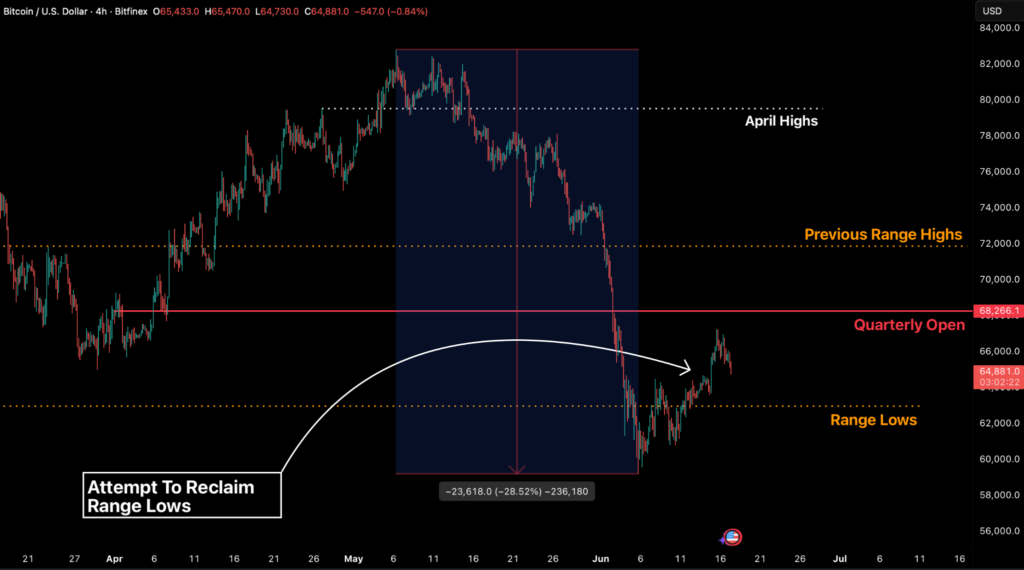
The price action itself has been orderly. The range lows that gave way in early June has been reclaimed as support for now. The recent high came in just shy of the $68,266 quarterly open, a level that sits beneath the short-term holder cost basis in the low-to-mid $70,000s. Initial strength observed post the US-Iran peace deal has now faded across majors. We read the current market structure as acceptance back above $60,000 and in our Q1 range, with the aggregate Realised Price near $54,000 still serving as the floor for any deeper move.
What the Structure Is Saying
Beneath the price, the market has reset rather than re-accelerated. Open interest was flushed from its October 2025 peak above $90 billion to around $42.6 billion by the end of May and has not rebuilt through the bounce. Funding has been sticky, which leads us to believe the odds of price being confined to a range remain high until we see material spot taker demand lifting price.
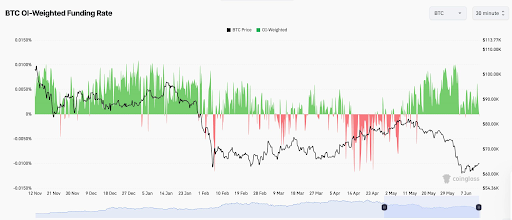
The open-interest-weighted funding rate for bitcoin has pivoted back into positive territory. Even though funding rates in general remain close to neutral, persistent positive prints on open-interest-weighted funding signal that leveraged long-side appetite is re-engaging.
This return of demand follows an early-June wash-out that purged leveraged longs around the $60,000 floor, producing several multi-billion dollar long liquidation days in the first week of the month and effectively clearing the negative funding environment that characterised BTC February through April. With current metrics now testing the upper bound of their multi-month range, the market is leaning decidedly long on perpetuals ahead of the FOMC. If the Fed delivers a hawkish surprise, a shift back to negative funding would be the primary indicator of a long capitulation.
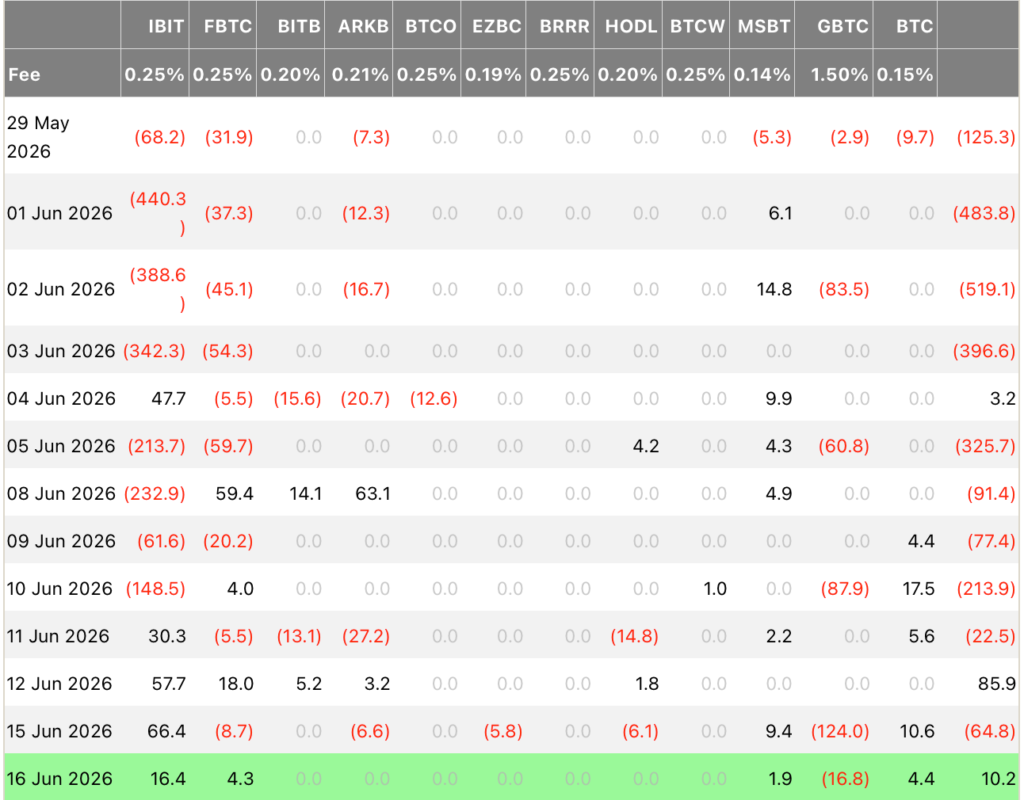
Meanwhile, exchange-traded fund (ETF) flows remain lacklustre, even after a strong equity recovery, with the Nasdaq moving 7.2 percent higher off the early June lows and within touching distance of all-time-highs. Crude drifting below $75 for the first time since the West Asia escalation.
The STRC Tell, and How It Works
One corner of the market is worth a closer look. Strategy, the largest corporate holder of bitcoin with 846,842 coins, funds much of its buying through STRC, a perpetual preferred share sold to income investors as a high-yield cash product. The mechanics are simple. STRC carries a stated value of $100 and pays a cumulative monthly cash dividend at a variable annual rate, currently 11.50 percent, or about $0.958 a share each month. The rate is not fixed: Strategy resets it monthly with the explicit aim of keeping the share near its $100 par. Crucially, the dividend is not paid from profit, of which there is little. The dividend is funded by issuing new stock or preferreds or, as the company disclosed last month, by selling BTC. The yield investors collect is financed by continued access to capital markets and, at the margin, by the size of the coin pile itself.

How the STRC yield is funded. Source: Strategy SEC filings (8-K, STRC 424B5); prices from Massive Market Data.
The tell is that this mechanism is failing. STRC closed at $91.79 on 16 June, a fresh low and more than eight percent below the par it is built to defend, putting its market yield near 12.5 percent against an 11.5 percent coupon. The rate has been raised but the price has fallen anyway. To defend par from here, Strategy would have to lift the dividend again, paying more for each dollar of funding at precisely the moment its equity is weakest. This is not a crisis call; STRC is one instrument and the holdings are intact. It is, however, a clean real-time gauge of how expensive Strategy’s funding has become, and right now it is getting more expensive.
The Bid Still Has to Return
That gauge matters because the corporate treasury complex is one of the two engines that must fire for bitcoin to find a durable bid, the other being the spot ETFs. This week both are sputtering. Strategy added just 1,550 Bitcoin last week, a $101.3 million purchase that is a fraction of the multibillion-dollar raises it ran on the way up, and the ETF complex has eased its selling without turning to sustained net inflows.
The clearest expression of the problem is the divergence on the screen: spot has rallied 13.5 percent off its low while STRC has made new lows and MSTR, the common stock, sits near $122.81, down about 23 percent from its May high. The asset is stabilising; the machinery that buys it is not. The BTC bounce that the marginal buyers are not funding is, by definition, living on borrowed time.

Spot rallied while STRC made new lows. Source: BTC/USD and STRC daily, Massive Market Data.
What We Expect, and the Triggers That Decide It
Our base expectation is that bitcoin holds a range between the $60,000 shelf and the $68,266 quarterly open until one side resolves it, with the burden of proof on the bulls. The relief rally can extend, but turning it into a trend requires the bid to come back, and that is a question of flows and the Fed, not of price patterns.
On the upside, the confirmation we would need is specific. Spot ETF flows would have to string together genuine net inflows rather than fade after a single day; STRC would have to climb back toward its $100 par, signalling the corporate funding channel has reopened; open interest would have to stay subdued while price rises, proving the move is spot-led; and bitcoin would have to accept above the $68,266 quarterly open.
That combination would put the short-term holder cost basis in the low-to-mid $70,000s back in play, and above it the heavy supply cluster between $78,000 and $82,000 left by May’s buyers.
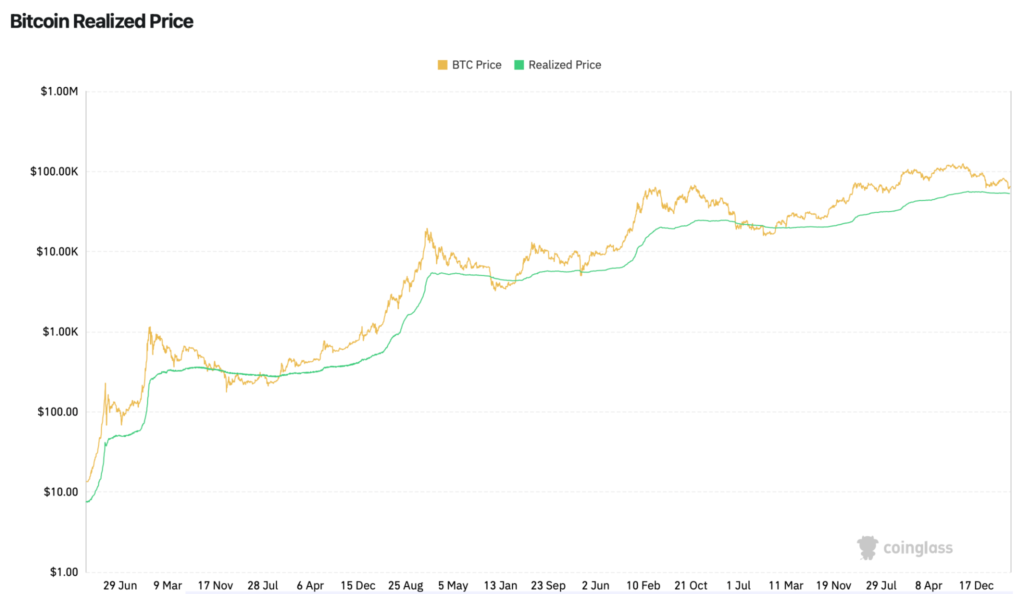
On the downside, the invalidation is just as clear. A daily close back below $60,000 and the $59,200 cycle low would open the thin air gap toward the Realised Price at $54,000. A resumption of ETF outflows, open interest rebuilding faster than price, a further slide in STRC, or a hawkish surprise from the Fed would each push the market that way.
The immediate catalyst is hours away. Today’s decision is Kevin Warsh’s first as Chair and carries the first dot plot of his tenure. A hold is near-certain, so the signal sits in the projections and the tone. The market has trimmed its year-end hike odds to under 40 percent from 43.4 percent following the United States and Iran memorandum of understanding, with signing scheduled for 19 June and crude back near $75, a three-month low. A dovish dot plot would loosen financial conditions and give both spot-buyer complexes room to recover; a hawkish one, or a collapse of the Iran deal that lifts oil again, would press hardest on the leveraged, capital-markets-dependent structures this note has described.
Triggers to Watch Near $65,600
| Metric | Status near $65,600 | Bullish trigger | Bearish trigger |
|---|---|---|---|
| Price | +13% off the $59,200 low; rejected at the quarterly open | Acceptance above $68,266 | Daily close back below $60,000 |
| ETF flows | Selling eased, not reversed | Sustained net inflows | Outflows persist |
| Corporate bid | Strategy added just 3,137 BTC; STRC sub-par | STRC reclaims the $100 par for next ex-div date | Dividends funded by coin sales |
| Leverage | OI flushed, not rebuilding; funding subdued | Price rises while OI stays flat | OI rebuilds faster than price |
| Cost basis | Spot below STH basis (low-to-mid $70k) | Reclaim of STH cost basis | Realised Price $54,000 floor breaks |
| Macro | Crude ~$80, 10Y ~4.47% into the FOMC | Dovish Warsh dot plot | Hawkish dots or oil re-spike |
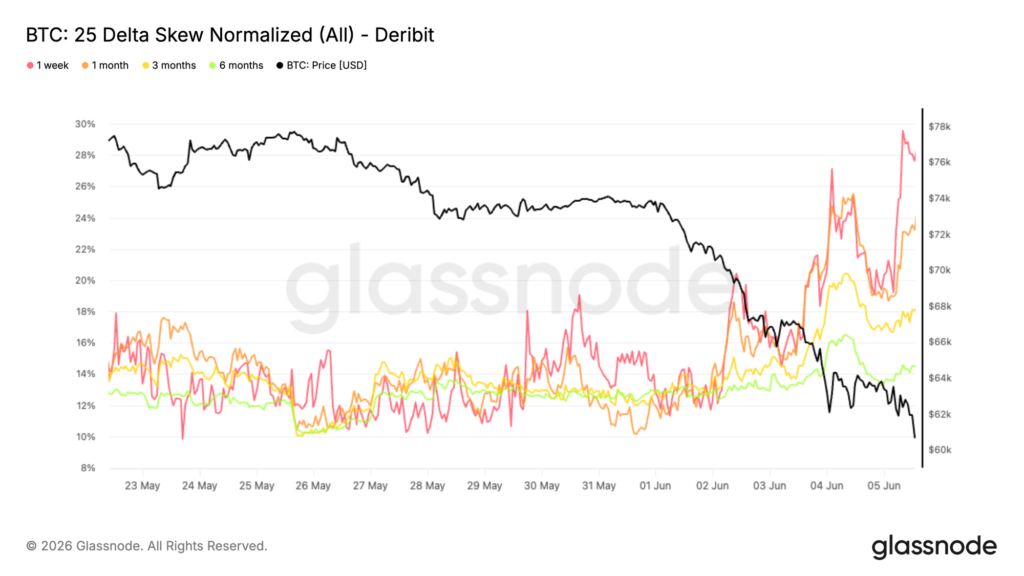
The current price movements have sent volatility premiums expanding (IV > RV). This implies options traders are pricing in more volatile price moves in the future and paying premiums for taking on directional bets. Skew identifies exactly where the defensive bid is clustering. As the asset breached support and drifted toward its February floor, market participants pivoted sharply toward downside protection.
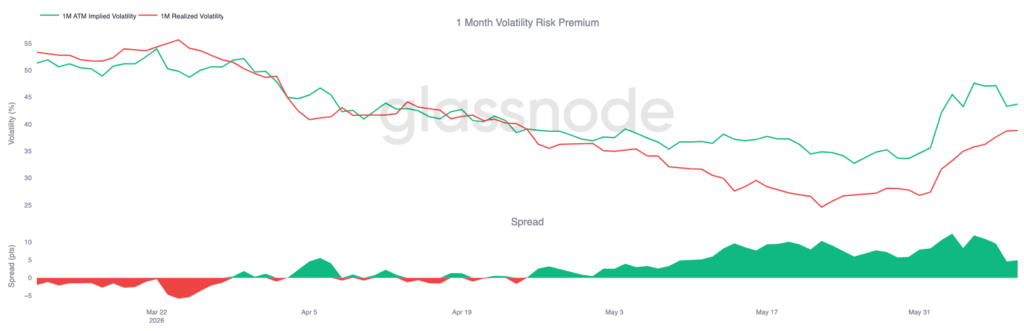
Because skew measures the spread between put and call volatility, these positive prints confirm that insurance now carries a significant premium. This flush lower sparked a rapid repricing across the curve: 1-month skew surged from 11 percent to 24 percent, while the 3-month and 6-month tenors drifted higher toward 18 percent and 14 percent.
The front end took the brunt of the move, with 1-week skew tagging 30 percent as the scramble for immediate hedging intensified. While implied volatility rose in aggregate, the skew trend is directional, signalling a market exclusively focused on tail-risk mitigation.
The demand for protection has hardened, with traders paying a growing premium for downside insurance as the technical structure weakens.