

Issue #216:
155,000 Bitcoins Say Bulls Hold Steady
On-chain Data Signals Accumulation, Not Exodus
Markets entered August at a decisive fault line: Bitcoin prices hit what we have suggested is a downside trigger (two daily closes below $63,000) just as stronger US demand, persistent inflation and rising long-term yields began to challenge the conditions that supported risk assets through July. The next market move will depend less on headline economic growth and more on whether buyers can defend Bitcoin’s concentrated $62,000-$65,000 support range while real yields remain below a critical threshold.
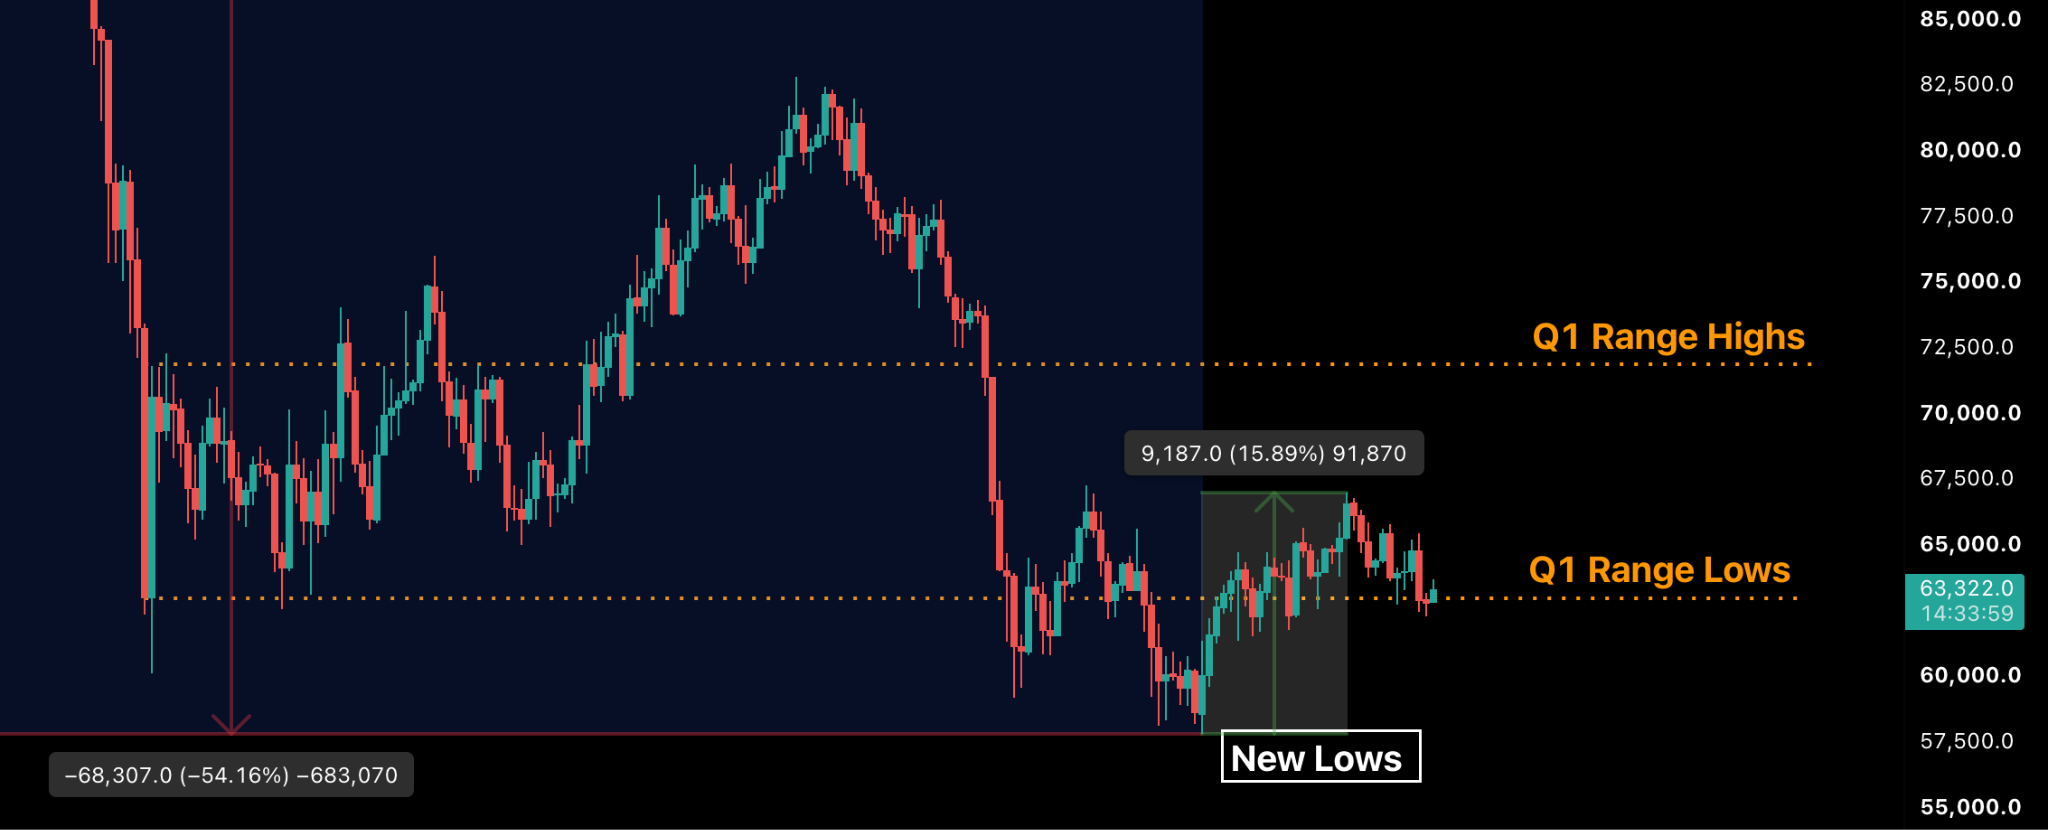
Bitcoin ended July with a 7.3 percent gain, closely matching its historical seasonal average, but consecutive closes below $63,000 shifted the near-term outlook towards further consolidation or downside. Bitcoin exchange-traded funds recorded their first weekly outflow after three positive weeks, spot trading volumes fell to their lowest level since late 2023 and options markets again priced a premium for downside protection. However, the decline has not yet developed into broad capitulation. Approximately 155,000 BTC moved into the $62,000-$65,000 cost-basis range, indicating that selling was absorbed by buyers near current prices. This concentration now represents 0.7 percent of circulating supply and could keep BTC range-bound until a stronger catalyst emerges.
The macroeconomic backdrop is also more resilient than the 1.5 percent second-quarter Gross Domestic Product growth rate suggests. Real final sales to private domestic purchasers increased by 3.9 percent, supported by household spending and business investment. Capital-goods imports, particularly semiconductors, telecommunications equipment and industrial machinery, also point to a major artificial intelligence infrastructure cycle. This investment could improve productivity over time, but its immediate effect is inflationary as demand for hardware, electricity, construction and skilled labour rises faster than supply.
Inflation therefore remains the central constraint on monetary policy. Second-quarter Personal Consumption Expenditures prices increased at a 5.1 percent annualised rate, while core inflation increased by 3.4 percent.
Household spending remained firm, but the personal savings rate declined to 2.7 percent, leaving consumers more exposed to higher energy, food and borrowing costs. Rising diesel prices and geopolitical risks add another potential source of inflation pressure.
The Federal Reserve held its policy rate at 3.5-3.75 percent, but three dissenting policymakers and limited guidance increased uncertainty. Short-term Treasury yields declined, suggesting that markets do not expect an immediate rate increase, while long-term yields rose as investors demanded greater compensation for persistent inflation. This divergence indicates that markets are becoming less concerned about near-term Federal Reserve action and more concerned about whether inflation will remain elevated over time.
For Bitcoin prices, the decisive variable is the real cost of money. A Federal Reserve that holds rates while inflation remains above target can support the case for scarce assets, but elevated real yields and a stronger US dollar increase the opportunity cost of holding an asset that pays no income. The 10-year Treasury Inflation-Protected Securities real yield stood at 2.41 percent on 30 July, close to the 2.5 percent threshold that would invalidate the current macro tailwind thesis for Bitcoin, if sustained for two consecutive weeks.
The outlook is therefore cautious rather than decisively bearish. Bitcoin continues to show evidence of accumulation near its current range, but weak institutional flows, compressed liquidity, unfavourable August seasonality and rising real yields leave the market increasingly dependent on support holding between $62,000 and $65,000. A sustained break below that range would expose the thinly traded area towards the realised price near $52,852, while stabilising real yields and renewed exchange-traded fund demand would strengthen the case for recovery.

Market Signals
Green July Ends. Turbulent August Begins
Bitcoin closed July at $62,899, delivering a 7.3 percent monthly return that nearly matched the 7.6 percent seasonal average for the month that we highlighted in Bitfinex Alpha 212 published on July 6.
Spot volumes are the thinnest they have been since late 2023, yet the $62,000 to $65,000 cost-basis support has also grown by approximately 155,000 BTC even as prices pulled back. This $3,000 range now holds the largest supply concentration in terms of on-chain cost basis across all prices, accounting for 0.7 percent of all circulating BTC.
Institutional momentum stalled as the ETF complex snapped its three-week winning streak, recording a net outflow of $61.5 million over the past week.
The Federal Reserve kept interest rates unchanged, but internal disagreement and limited policy guidance increased uncertainty across markets.
The 10-year real yield stood at 2.41 percent on 30 July, up from 2.24 percent at the start of the month and nine basis points below the threshold.
The transition into August comes with immediate pressure: a reversal from an intra-week peak of $65,420 led to a close below $63,000, followed by price closing at $62,815 on Saturday, August 1, 2026. Two daily closes below $63,000 officially activates the downside trigger established in last week’s Intelligence Update. Additionally, the market remains macro dependent, as has been our read for several weeks now. A strong bond market for longer-term maturities and the current pressure on equities has led to increased strain on BTC. For bitcoin though, the most important factor is not economic growth. It is the real cost of money — the return investors can earn after inflation. The current environment can help and hurt at the same time.
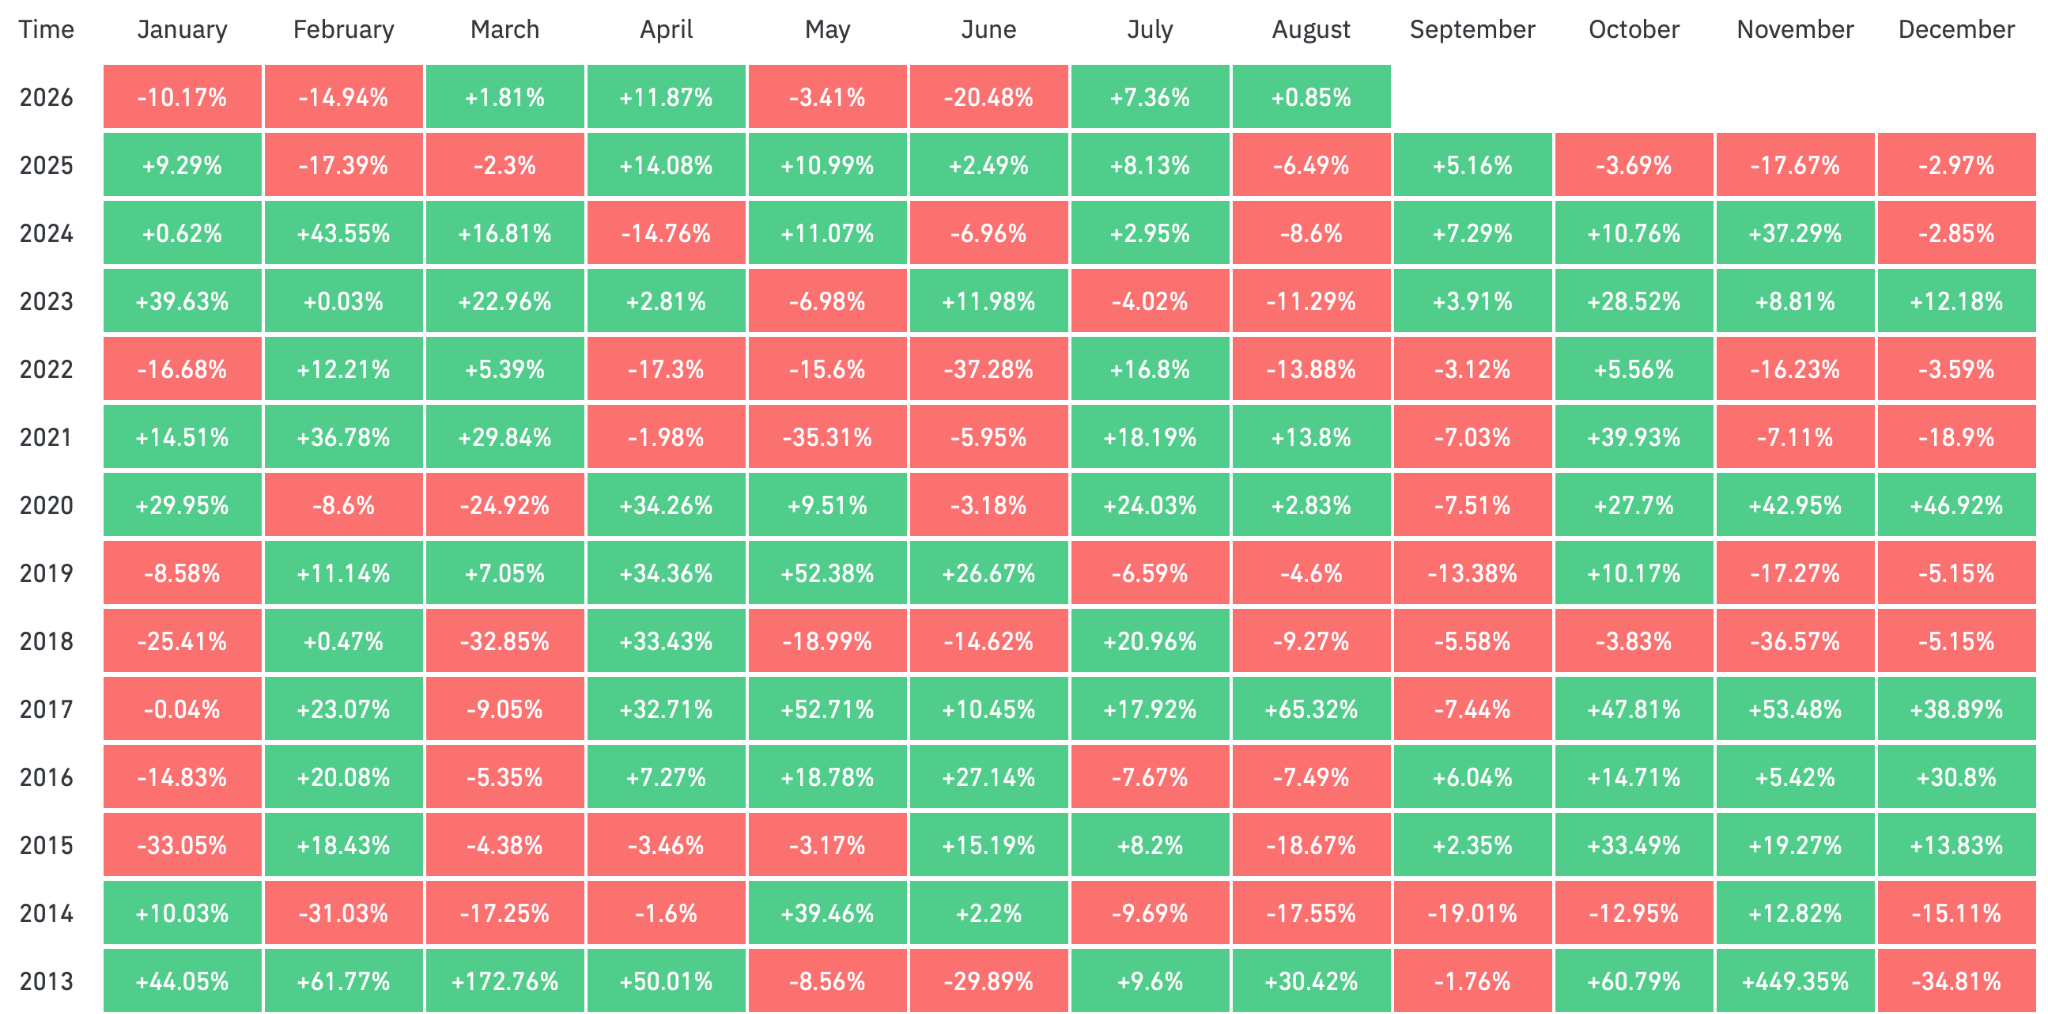
Evaluating the downside trigger requires a balanced interpretation of conflicting signals. The requirement for multiple closes below the $63,000 support band has been met, and August ranks as the second-weakest month historically.
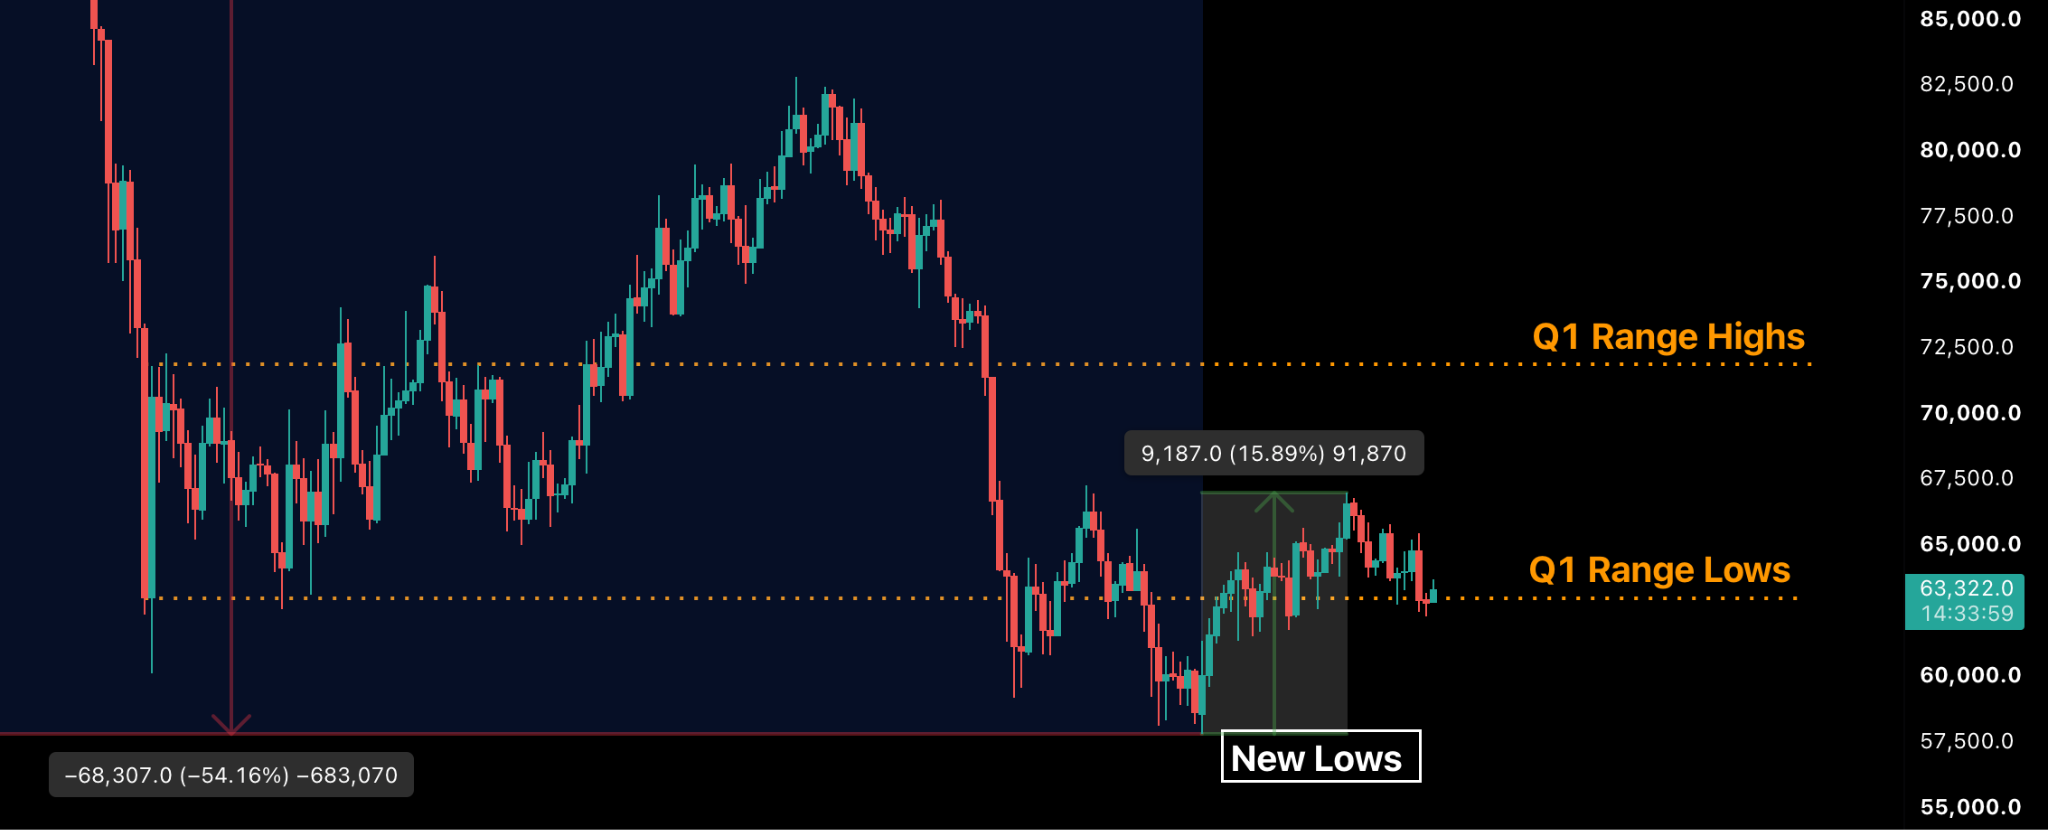
The pullback in BTC was accelerated by the fact that BTC ETFs had a net outflow week, ending a three week streak of positive inflows. However, the fundamental backdrop is more complex.
Our sub-$63,000 trigger has arrived in the thinnest spot volumes since late 2023, yet the $62,000 to $65,000 cost-basis support has also grown by approximately 155,000 BTC even as prices pulled back. This $3,000 range now contains the largest supply concentration in terms of on-chain cost basis across all prices, with 0.7 percent of circulating BTC held at this price.
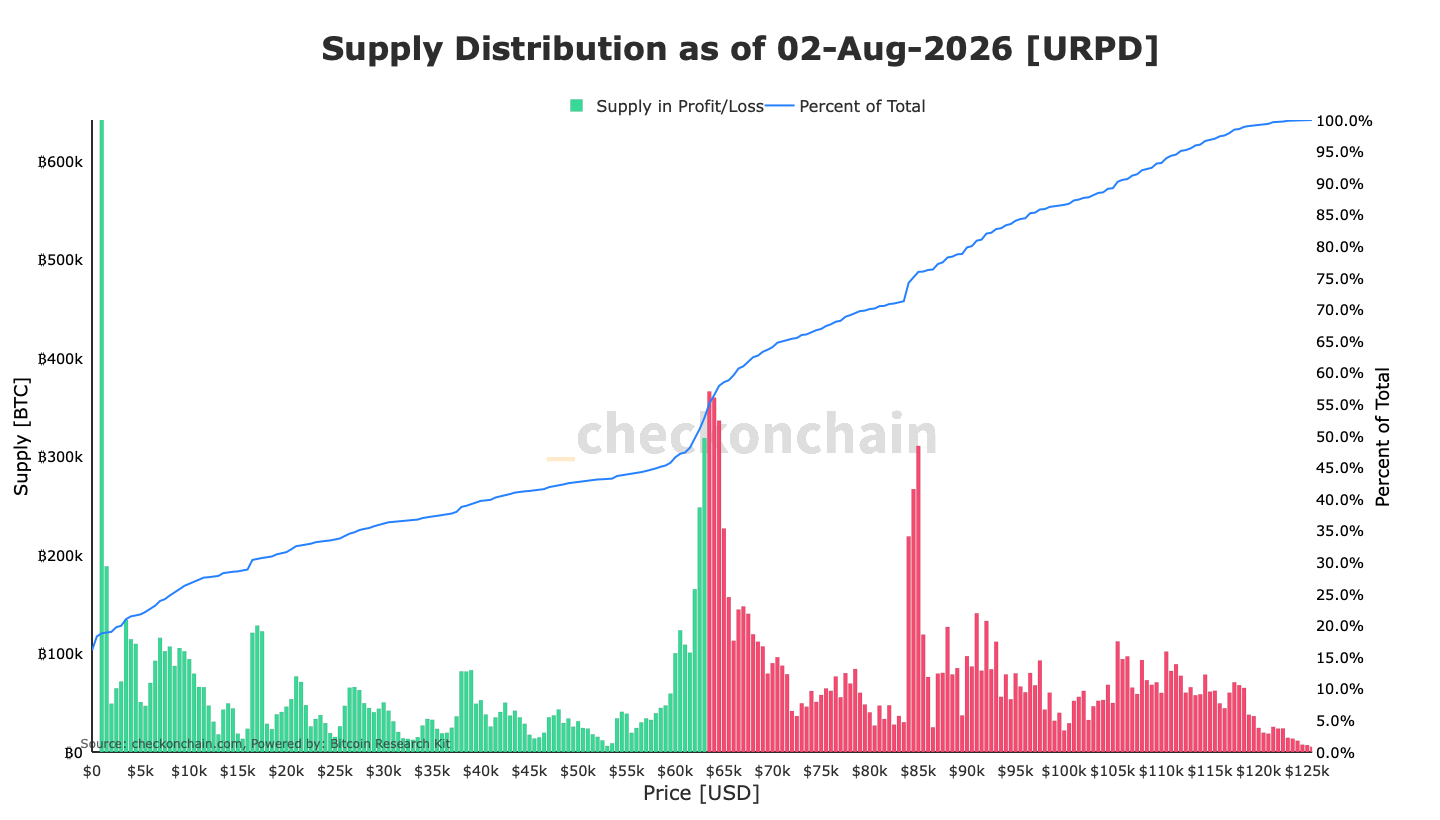
The highest cost-basis concentration band was around the $82,000-85,000 band until two weeks ago. However, an uptick in activity that saw a combination of Long-Term Holder (LTH) supply increasing, while Short-Term Holders (STH) sold at breakeven, or close to it, led to roughly 155,000 BTC migrating into the $62,000-65,000 band. This occurred even as the price fell through it. The largest $500 band in the UTXO Realised Price Distribution was centred at $63,500. We expect prices to respond to this concentration by continuing to trade within this range until a strong catalyst or a buying/selling spree breaks the range.
Cost-basis concentration matters because a price zone gains weight only when transactions take place there. If that concentration grows during a downturn, it indicates buyers absorbed selling pressure at those levels. This, coupled with the fact that LTH supply is still increasing gradually while STH supply diminishes reinforces the belief that passive absorption of supply hitting the market is still ongoing.
This pattern reflects accumulation at a higher timeframe range extreme, since the low $60,000s are still near the lower end of BTC’s price movements throughout both 2024 and 2026. While it does not ensure the support will hold, it differentiates the current move from a market exodus, where thinning clusters would signal that holders are exiting and cost basis is dispersing away from current spot prices.
Below this support shelf, the rationale for a limited downside projection is evident in the supply distribution: the $50,000 to $60,000 range contains only 3.29 percent of supply, representing a significant liquidity gap with minimal historical activity. A break below the $60,000 level and our current bear market low at $57,803 would mean a potential visit to the other end of the “air gap”. This would be in line with August seasonality. Our “green July” thesis was backed by statistics indicating that BTC has a +7.58 percent average return in July and that holds true especially during bear market years. Similarly, August has had a median return of -6.99 percent since 2013 and this holds true especially during bear market years.
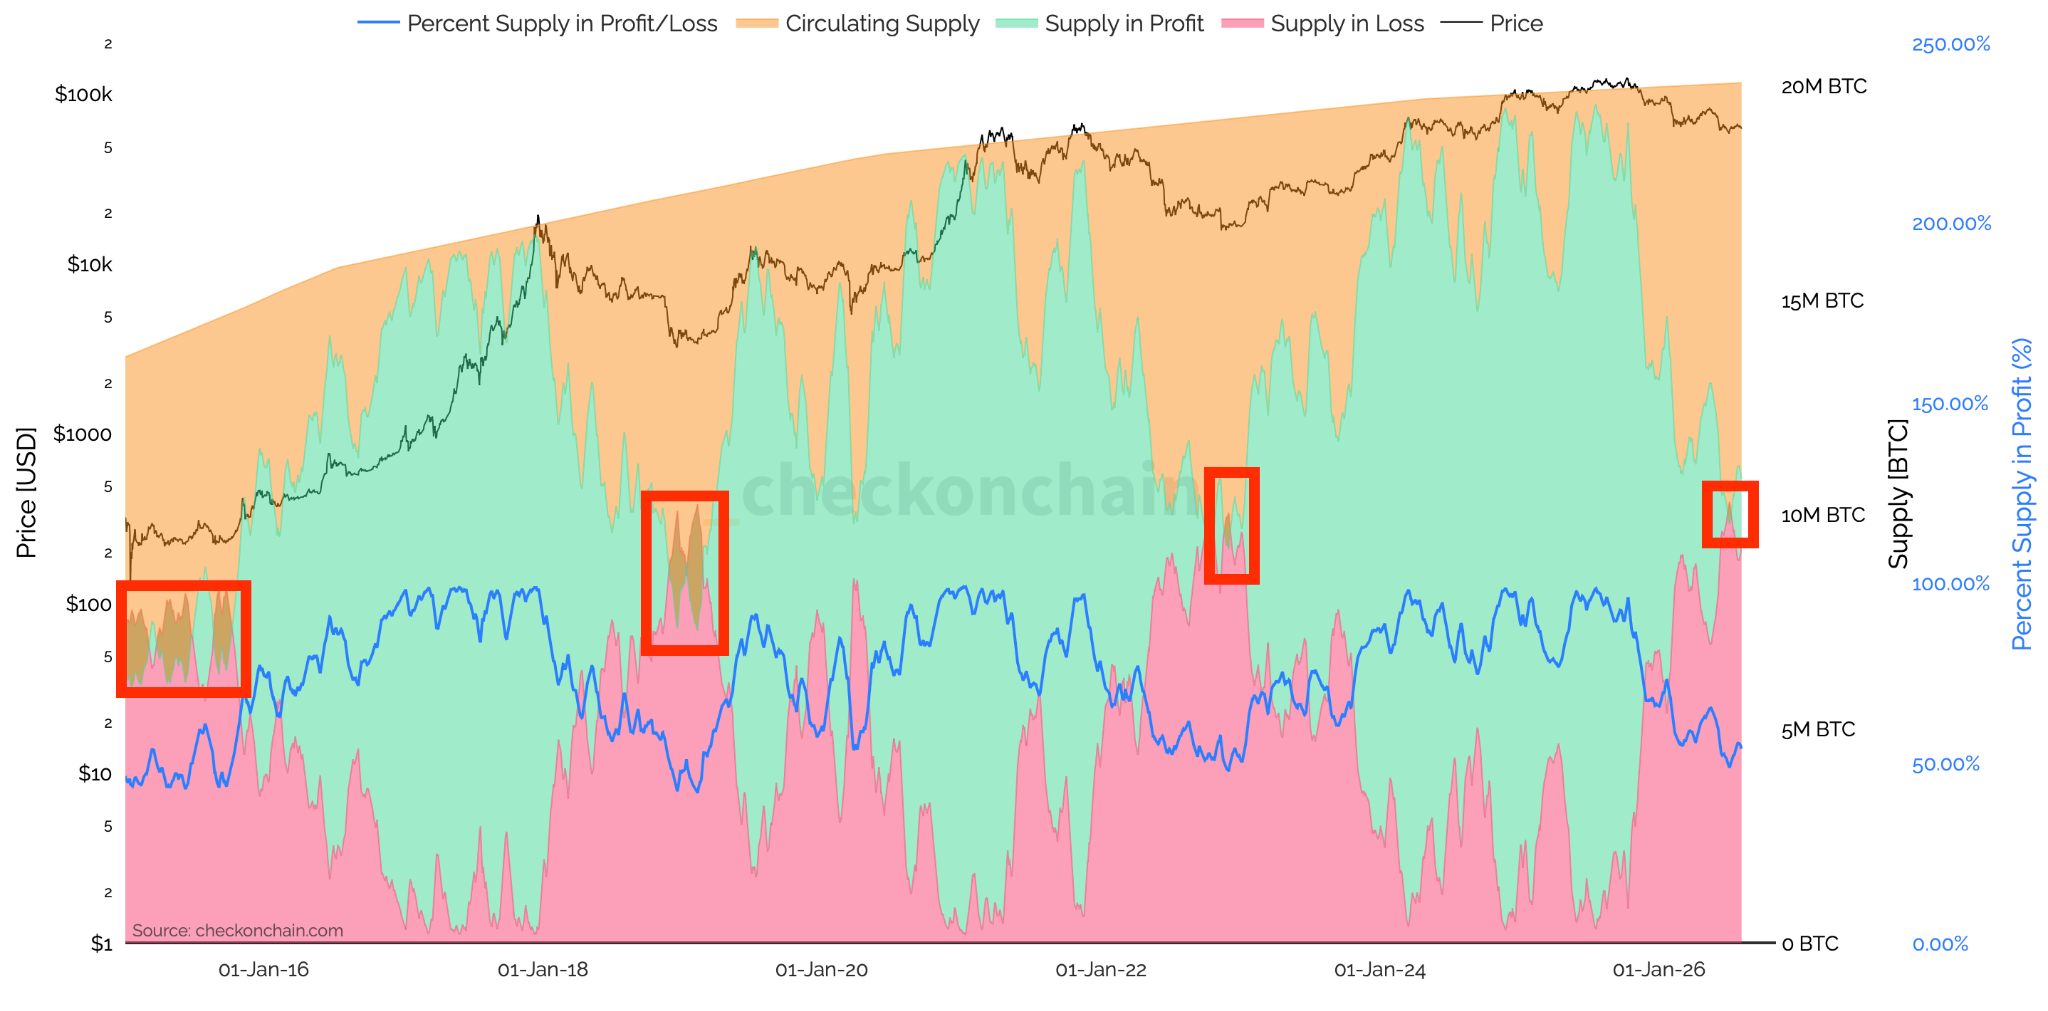
Profitability is currently at a critical pivot. With 54.6 percent of supply in profit as of the 2 August close, the average holder is effectively at breakeven.
Historically, when the supply held at a loss crosses the supply in profit metric, it has signaled cycle bottoms (refer to Figure 4 above) rather than the beginning of a breakdown, as such distributions tend to exhaust the remaining sellers. This happened for the first time this cycle between 1-4 July before reversing.
It is important to note that this is a slow process and, historically, this state of net profitability being under 50 percent has lasted for a while before the price finally bottomed. Supporting this, the Short-Term Holder Spent Output Profit Ratio (STH-SOPR) reached 0.9971 on August 1, indicating that while short-term participants are realising losses, these are relatively minor and do not yet reflect the capitulation seen at levels below 0.95.
Resistance at the other end remains firm at the short-term holder cost basis of $68,071. This aligns with the $68,247 Q2 open level, while the aggregate Realized Price floor is at $52,852, confluent with the lower end of our onchain air gap. If price were to break down below the $62,000-$65,000 range with no significant change in the market environment, that would open the door of visiting the Realised Price, which is our cycle’s higher timeframe support band.

Institutional Flows Remain Lacklustre
Institutional momentum stalled as the ETF complex broke its three-week winning streak, recording a net outflow of $61.5 million over the past week. The reversal was punctuated by Friday’s $265.4 million exit, which fully erased the previous session’s $233.1 million inflow. Additionally, as price slid below $62,500 for the first time in over 20 days, the options market returned to paying a premium for downside protection while simultaneously pricing in the lowest volatility for BTC in over six years.
The ETF performance means that we failed to clear the confirmation threshold of a bottoming of the market, supported by a sustained positive week for both IBIT and the broader complex. While IBIT managed a net gain of $86.9 million, the aggregate red finish suggests the July inflow period was a temporary exhaustion of selling rather than the arrival of a sustained new bid.
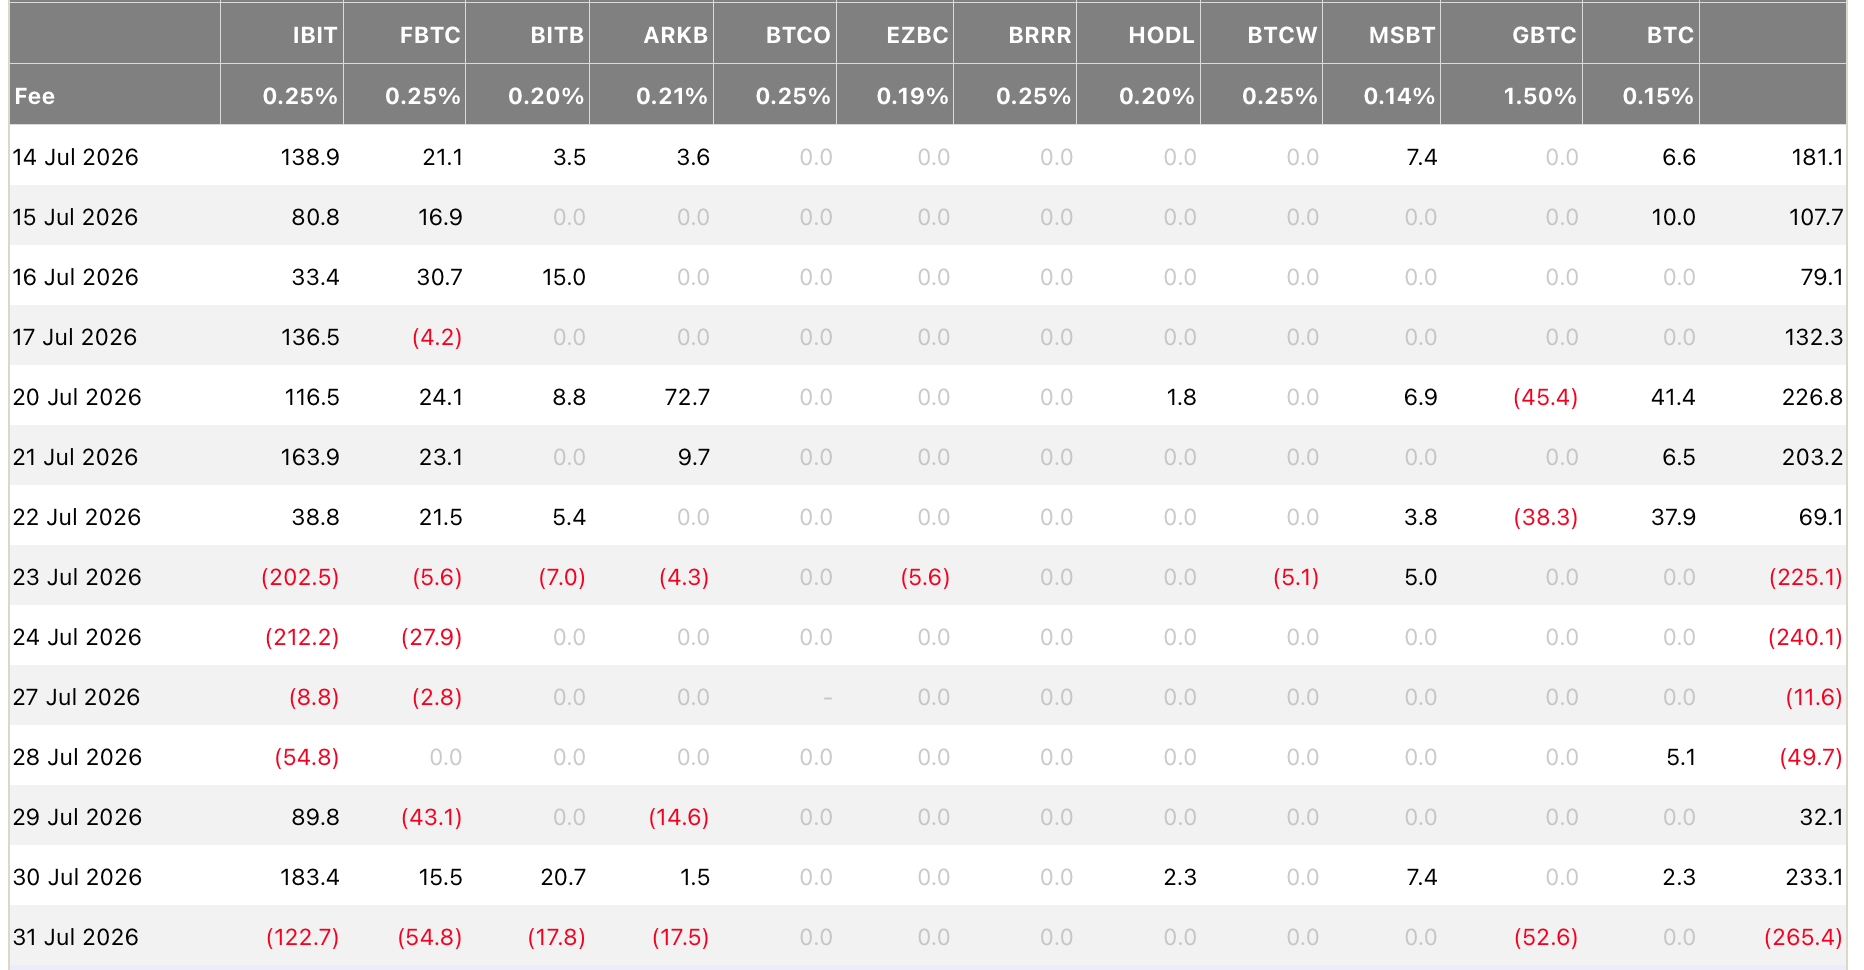
Conversely, Ether ETFs attracted $10 million in net new capital, outperforming Bitcoin counterparts for three straight weeks. Despite the modest scale, the average ETF participant continues to favour Ether. These flows are occurring against a backdrop of significant illiquidity, as July spot volumes averaged just $4.3 billion daily, the lowest levels of activity since late 2023, which was the pre-ETF era.
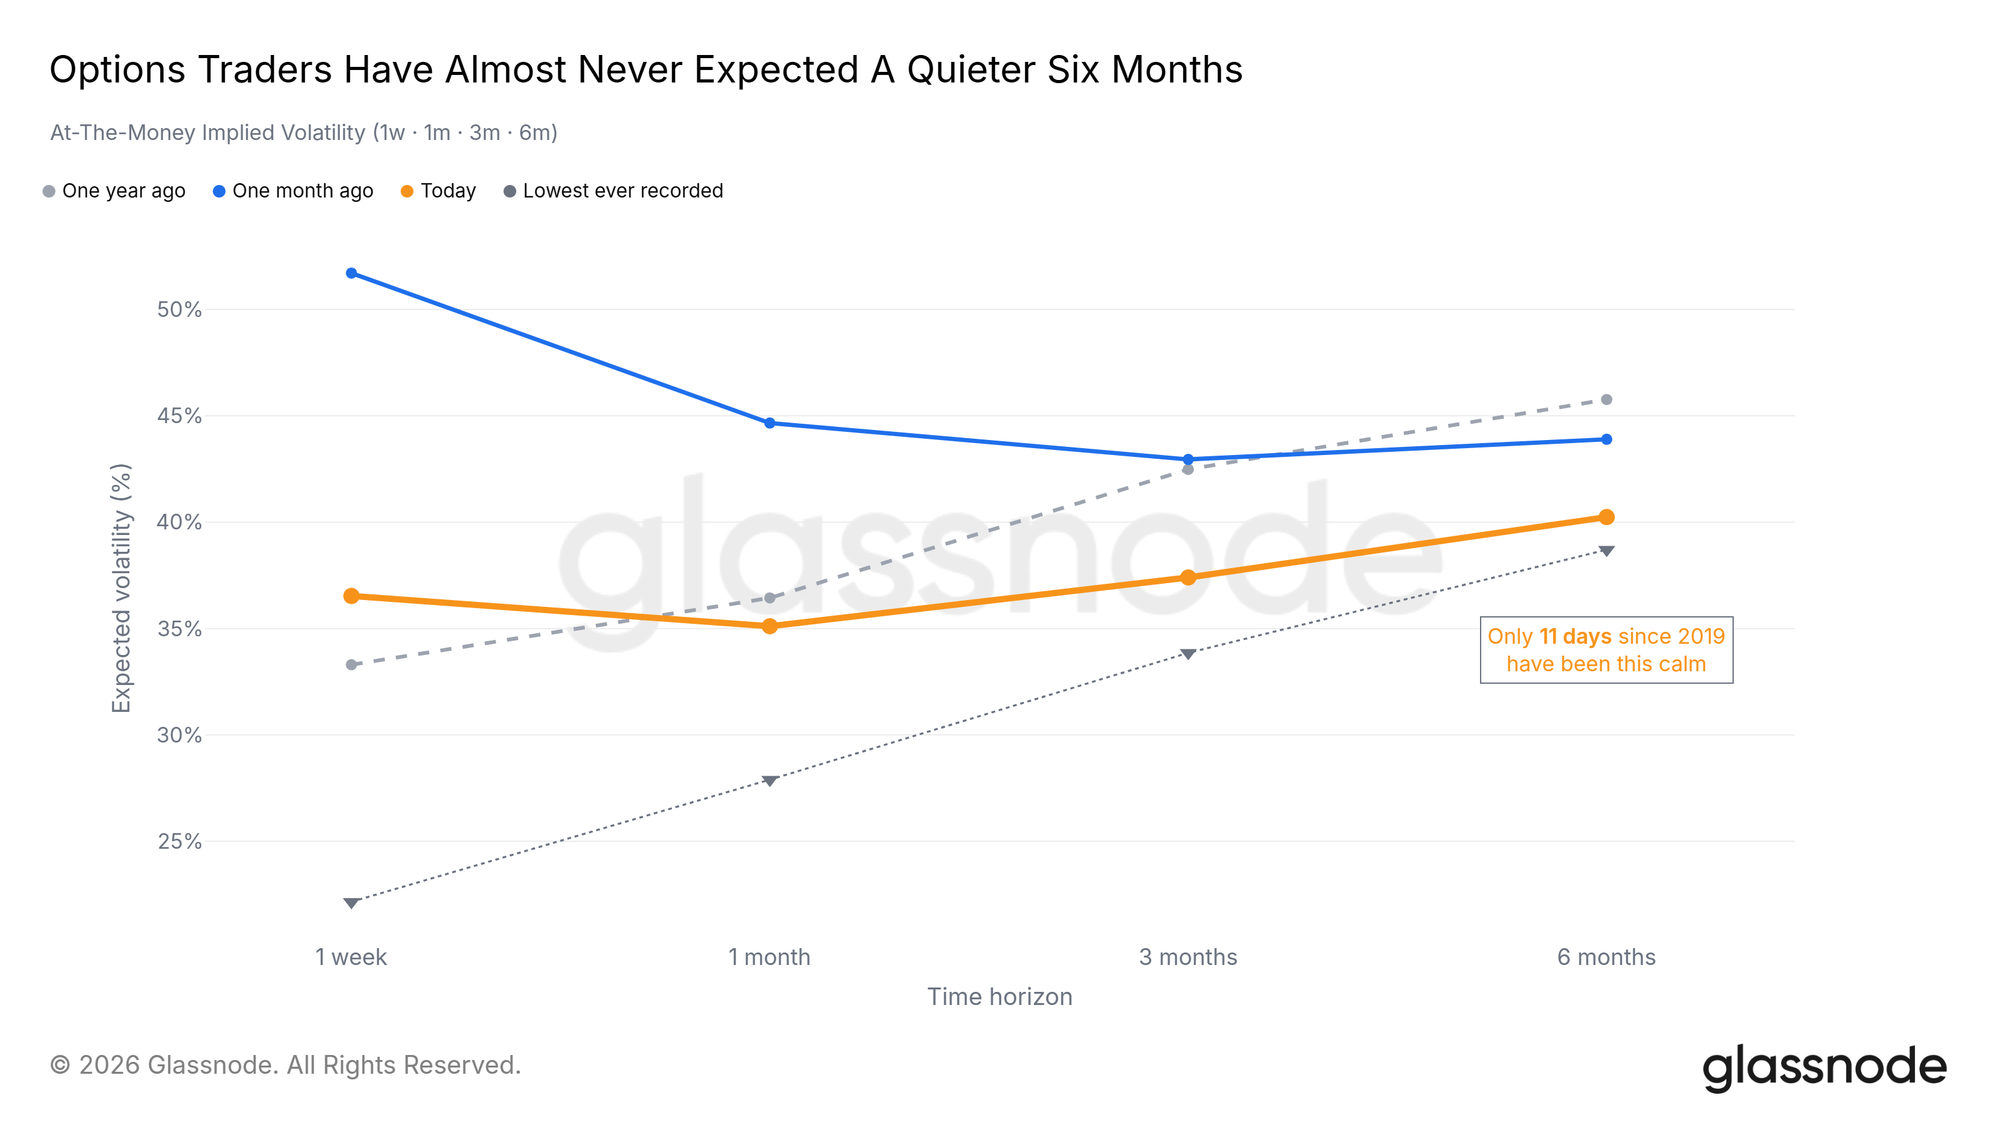
Implied volatility (IV) remains compressed near the lower bound of its historical range, with the six-month tenor reaching near-record lows, the second lowest since Bitcoin derivatives were launched. The last time participants in the derivatives market priced in such a low level for six-month IV contracts, BTC was trading around $3,500.

General Macro Update
US Growth Is Stronger Than Headline GDP But Inflation Risks Persist
The US economy grew more slowly in the second quarter, and understated the strong household demand and business investment we are seeing in the real economy.
Persistent inflation, rising energy risks and firm domestic spending also strengthen the case for the Federal Reserve to hold policy at a restrictive level for longer, but not necessarily to raise rates further.
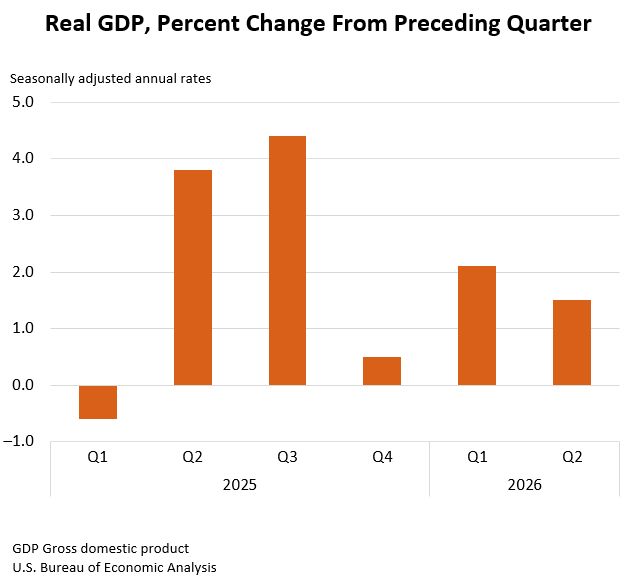
In the US Bureau of Economic Analysis (BEA) latest Gross Domestic Product (Advance Estimate), Second Quarter 2026 and Personal Income and Outlays, June 2026 reports. Real gross domestic product (GDP) grew at an annual rate of 1.5 percent in the second quarter, down from 2.1 percent in the first quarter.
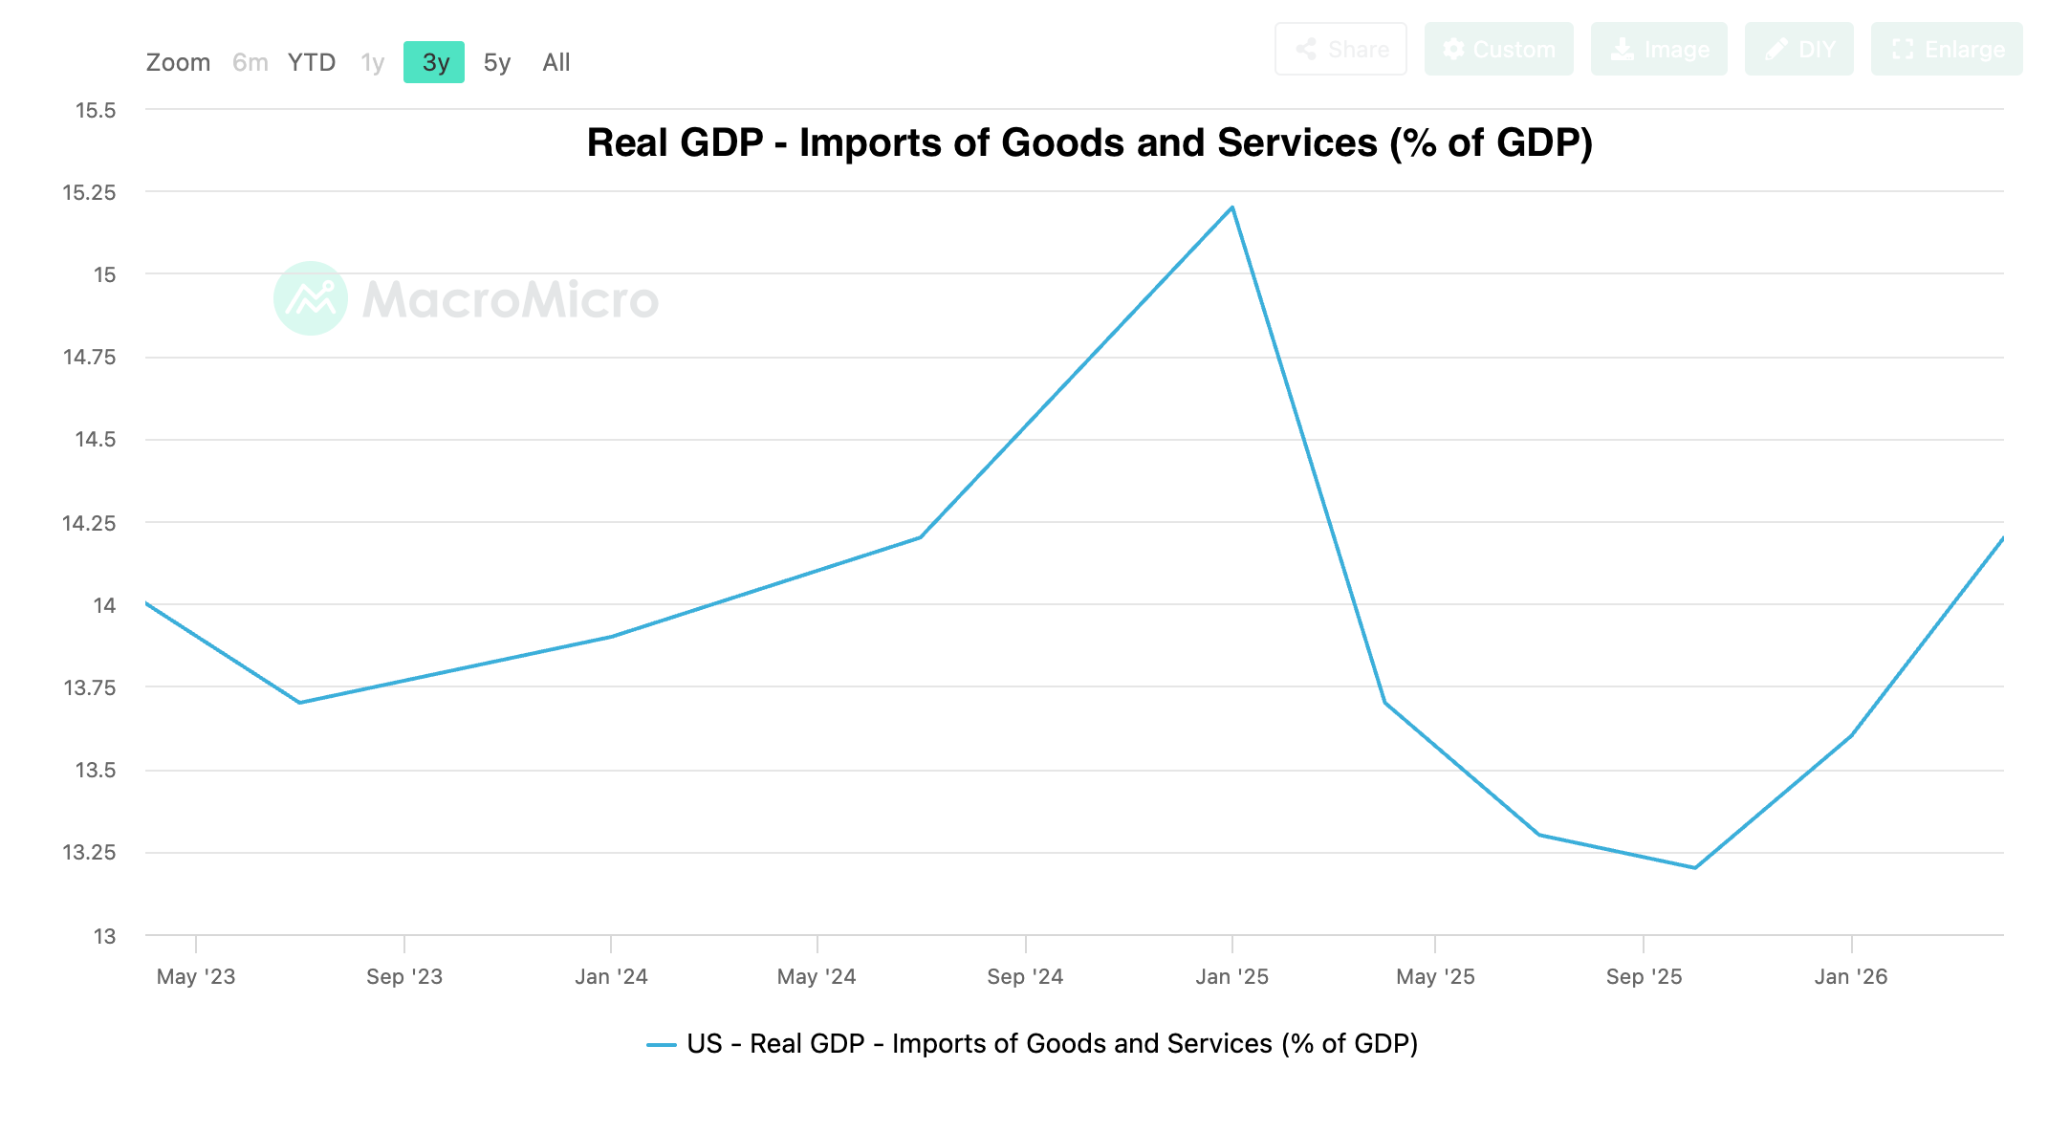
The slowdown however, was not from private demand, but rather a downturn in government spending and slower investment and exports, while a rise in imports and a drawdown in inventories also reduced measured growth. Rising imports matter because they reduce headline GDP, which counts only goods and services produced in the US, but they can still signal strong business investment and a resilient economy.
A clearer measure of domestic momentum supports this interpretation. Real final sales to private domestic purchasers increased by 3.9 percent, compared with 1.7 percent in the first quarter. This measure combines household spending and fixed private investment while removing the more volatile effects of inventories, trade and government activity. Consumer spending, investment and exports all contributed to growth, while government spending declined.

The composition of imports also matters. The BEA said capital goods led the increase, including telecommunications equipment, semiconductors and related devices, and industrial equipment. Federal Reserve Chair Kevin Warsh separately highlighted strong high-technology capital spending and said investment in artificial intelligence-related equipment and software had grown by nearly 20 percent over four quarters. This suggests that part of the trade drag came from companies buying infrastructure that could expand future productive capacity.
AI Is Driving Inflation
Artificial intelligence investment can affect inflation in two stages. Heavy spending on equipment, electricity, construction and skilled labour can raise prices in the near term because demand increases faster than supply. Over time, better technology can improve productivity, which means companies can produce more with the same amount of labour and capital. That improvement could eventually ease inflation, but
in the short-term, current AI spend is inflationary.
The demand side is now visible in official data: capital-goods imports led by semiconductors and telecommunications equipment, firm equipment and intellectual-property investment is notable within the second-quarter GDP report, and the near-20 percent growth in AI-related equipment and software reflects this demand.
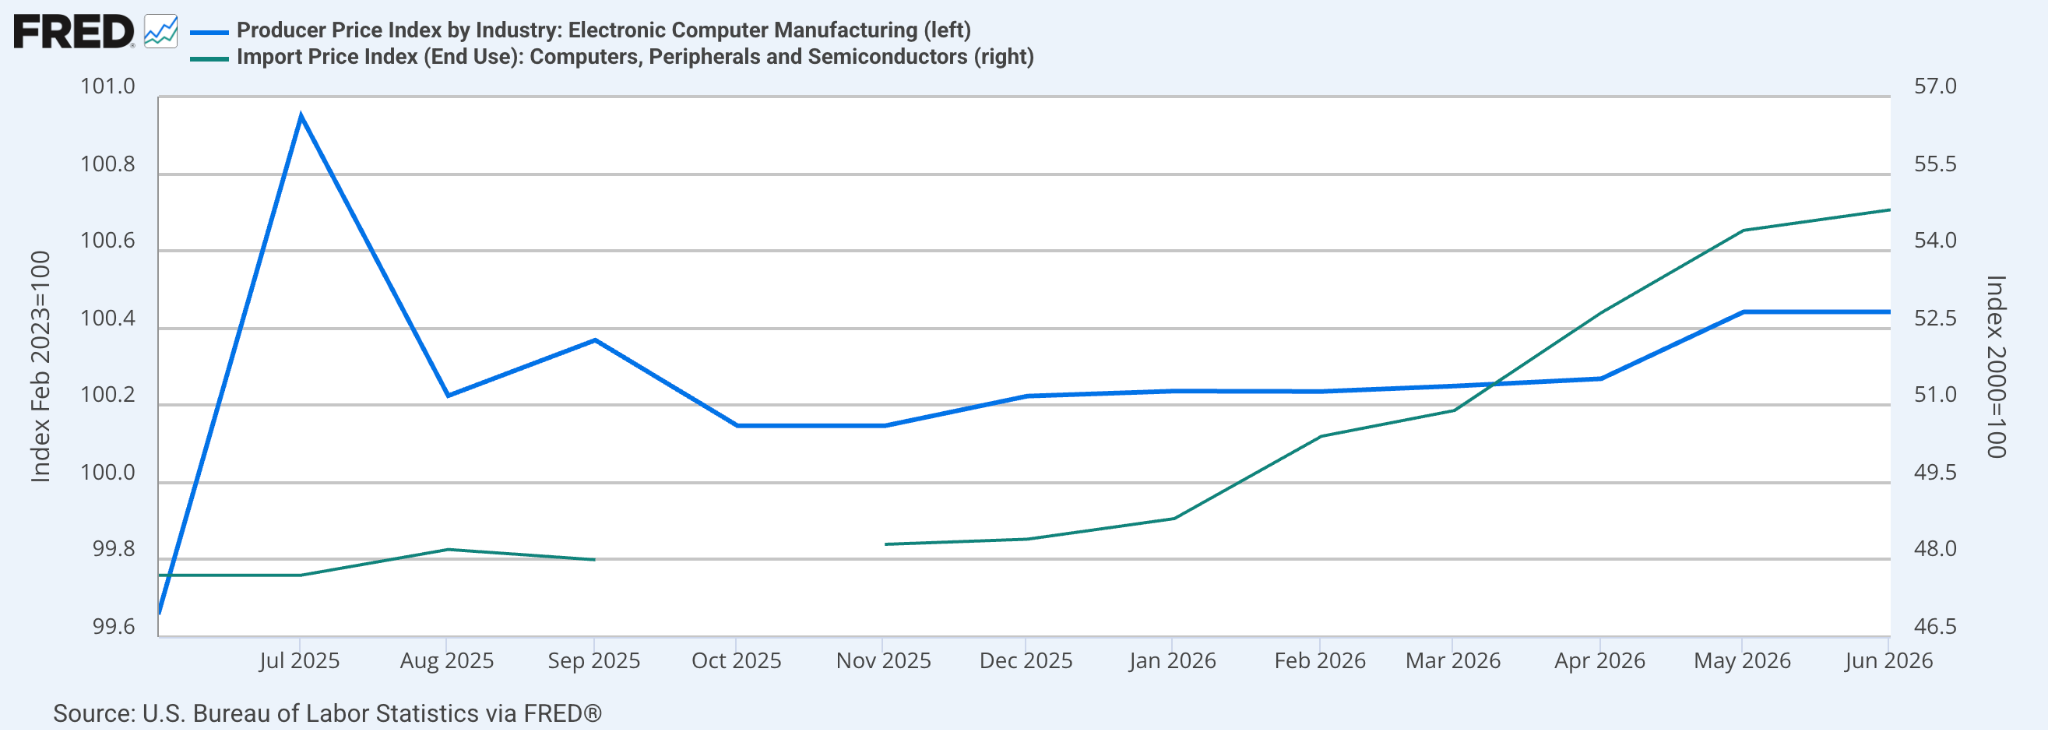
The price side followed suit. Producer prices for computers rose 2.5 percent in June alone, while import prices for computer parts and peripherals stood about 41 percent above their level a year earlier.
The inflation data reinforced this tension. Second-quarter Personal Consumption Expenditures (PCE) increased at a 5.1 percent annualised rate, while the core measure, which excludes food and energy, increased by 3.4 percent. The gross domestic purchases price index rose by 5.7 percent.
The June figures for the separate monthly Personal Income and Outlays Report, showed some monthly relief, but little evidence that inflation had returned to target. The headline PCE price index declined by 0.1 percent from May, while core prices increased by 0.1 percent. Over 12 months, headline inflation stood at 3.7 percent and core inflation stood at 3.3 percent.
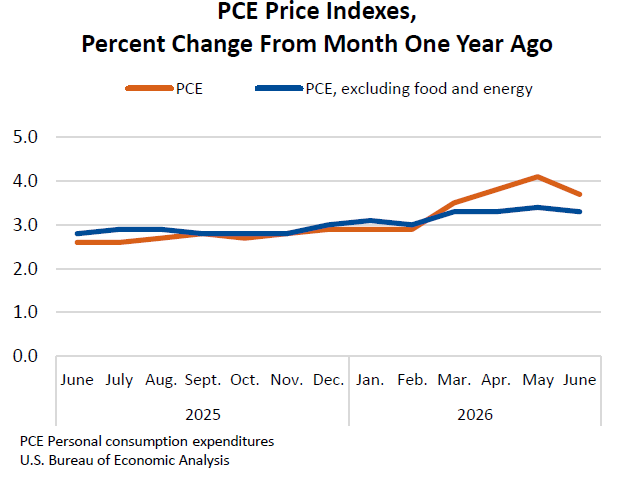
The annualised quarterly figure of 5.1 percent for PCE shows how quickly prices could rise if the latest quarter’s pace continued for a full year. The yearly rate of 3.7 percent compares June 2026 with June 2025. The stronger quarterly figure therefore indicates that recent price pressure remains firmer than the 12-month comparison alone suggests.
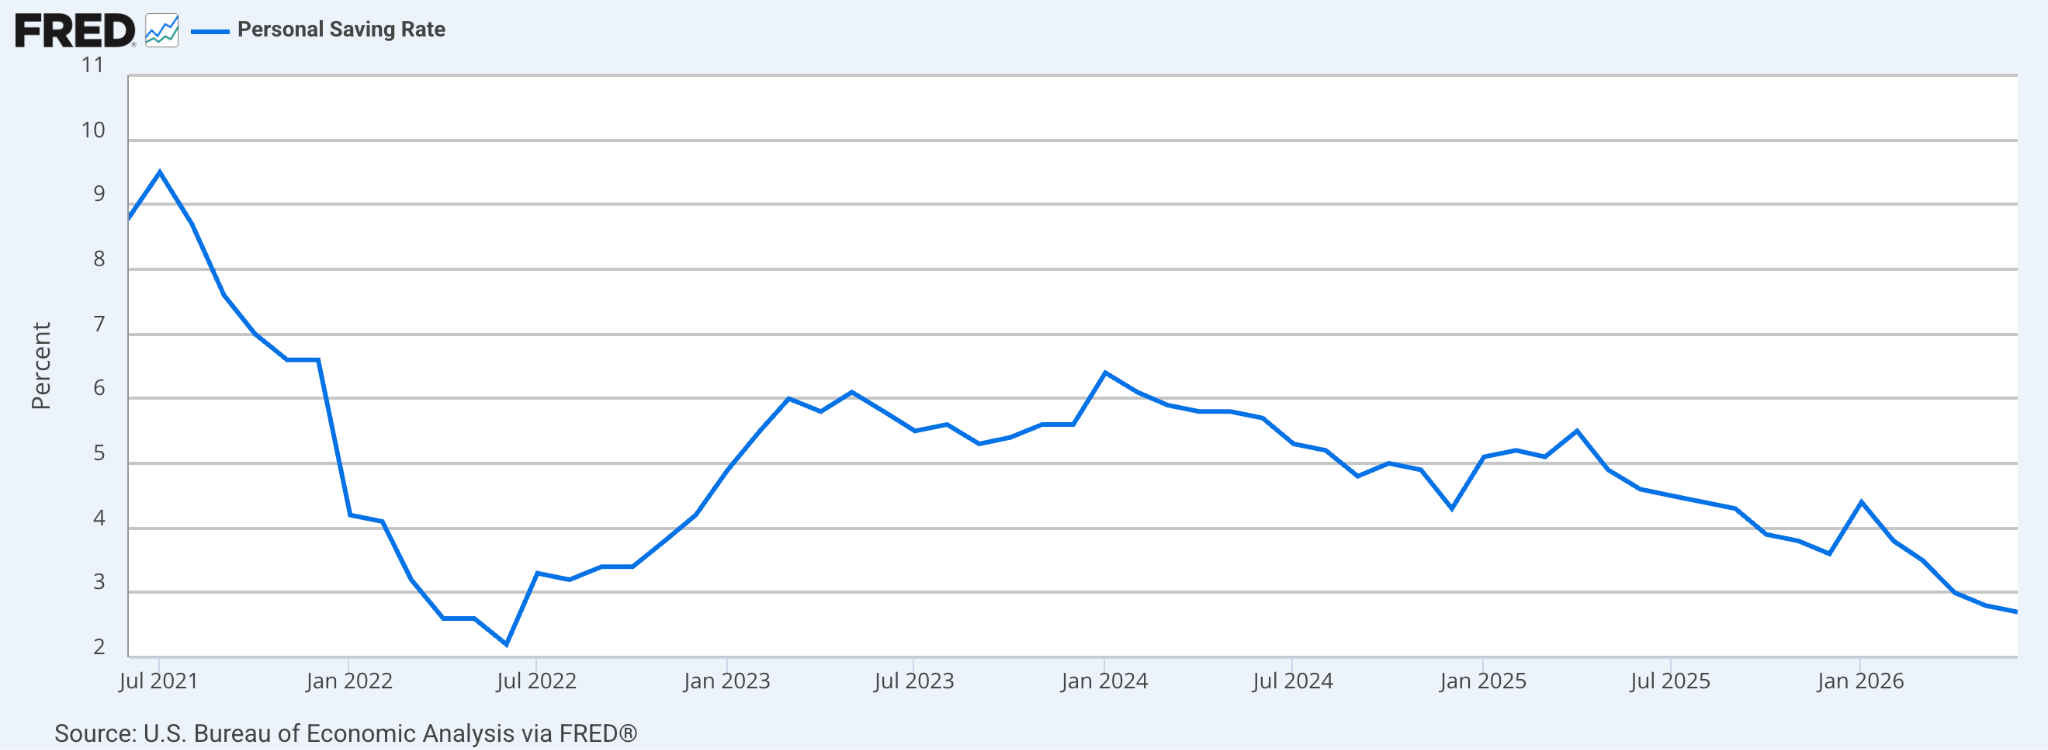
Household spending also remained resilient. Personal income increased by 0.2 percent in June, nominal consumer spending increased by 0.3 percent and inflation-adjusted spending increased by 0.4 percent. However, the personal savings rate declined to 2.7 percent. Strong spending supports current growth, but a low saving rate gives households less protection against further increases in food, fuel and borrowing costs.
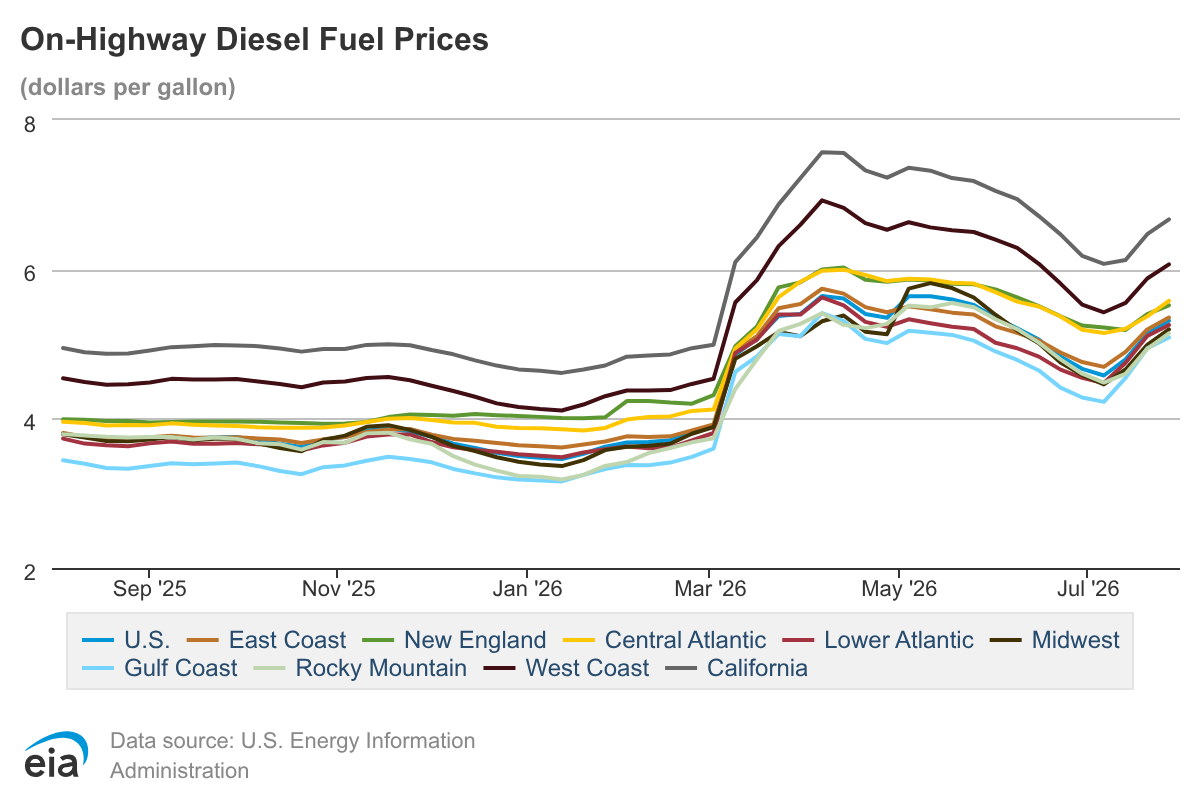
Energy remains an important risk. June’s headline inflation decline reflected earlier relief in energy prices, but the Federal Reserve said supply shocks are still driving price increases in parts of the economy, including energy.Conflict in the Middle East adds further uncertainty. This extends the supply-side risk we set out in last week’s diesel analysis and that risk is no longer hypothetical. Retail diesel has risen for three consecutive weeks, reaching $5.31 per gallon on 27 July. A renewed rise in oil and fuel costs could reverse part of June’s improvement and spread into transport, manufacturing and consumer prices.
For markets, this combination points towards interest rates remaining higher for longer. Firm domestic growth reduces the need for the Fed to support the economy, while persistent core inflation limits its ability to lower borrowing costs. This environment can support Treasury yields and the US dollar, while placing valuation pressure on technology shares and other assets that depend heavily on cheaper funding.
The central signal, therefore, is not weak growth. The economy continues to benefit from household spending and a large investment cycle linked to artificial intelligence infrastructure. However, that strength is arriving alongside inflation that remains above target, creating a more difficult policy setting and raising the threshold for any sustained easing in financial conditions.

Federal Reserve Holds Rates As Bond Markets Reprice
The Federal Reserve kept interest rates unchanged, but internal disagreement and limited policy guidance increased uncertainty across financial markets. Short-term bond yields fell, long-term yields rose and equity returns softened as investors reassessed inflation risks and the central bank’s willingness to act.
The Federal Open Market Committee’s July Interest Rate Decision, released by the Federal Reserve, maintained the target range for the federal funds rate at 3.5-3.75 percent. The effective rate remained near 3.63 percent, where it has stood since December 2025.
The Federal Open Market Committee (FOMC) approved the decision through a nine-to-three vote. Regional Federal Reserve presidents Neel Kashkari, Lorie Logan and Beth Hammack dissented.
Federal Reserve Chair Kevin Warsh reinforced a firm stance on inflation during the press conference. He stressed the central bank’s commitment to returning inflation to its 2 percent target and highlighted the rise in real yields. When real yields rise, borrowing conditions become tighter because investors can earn a higher inflation-adjusted return from government bonds.
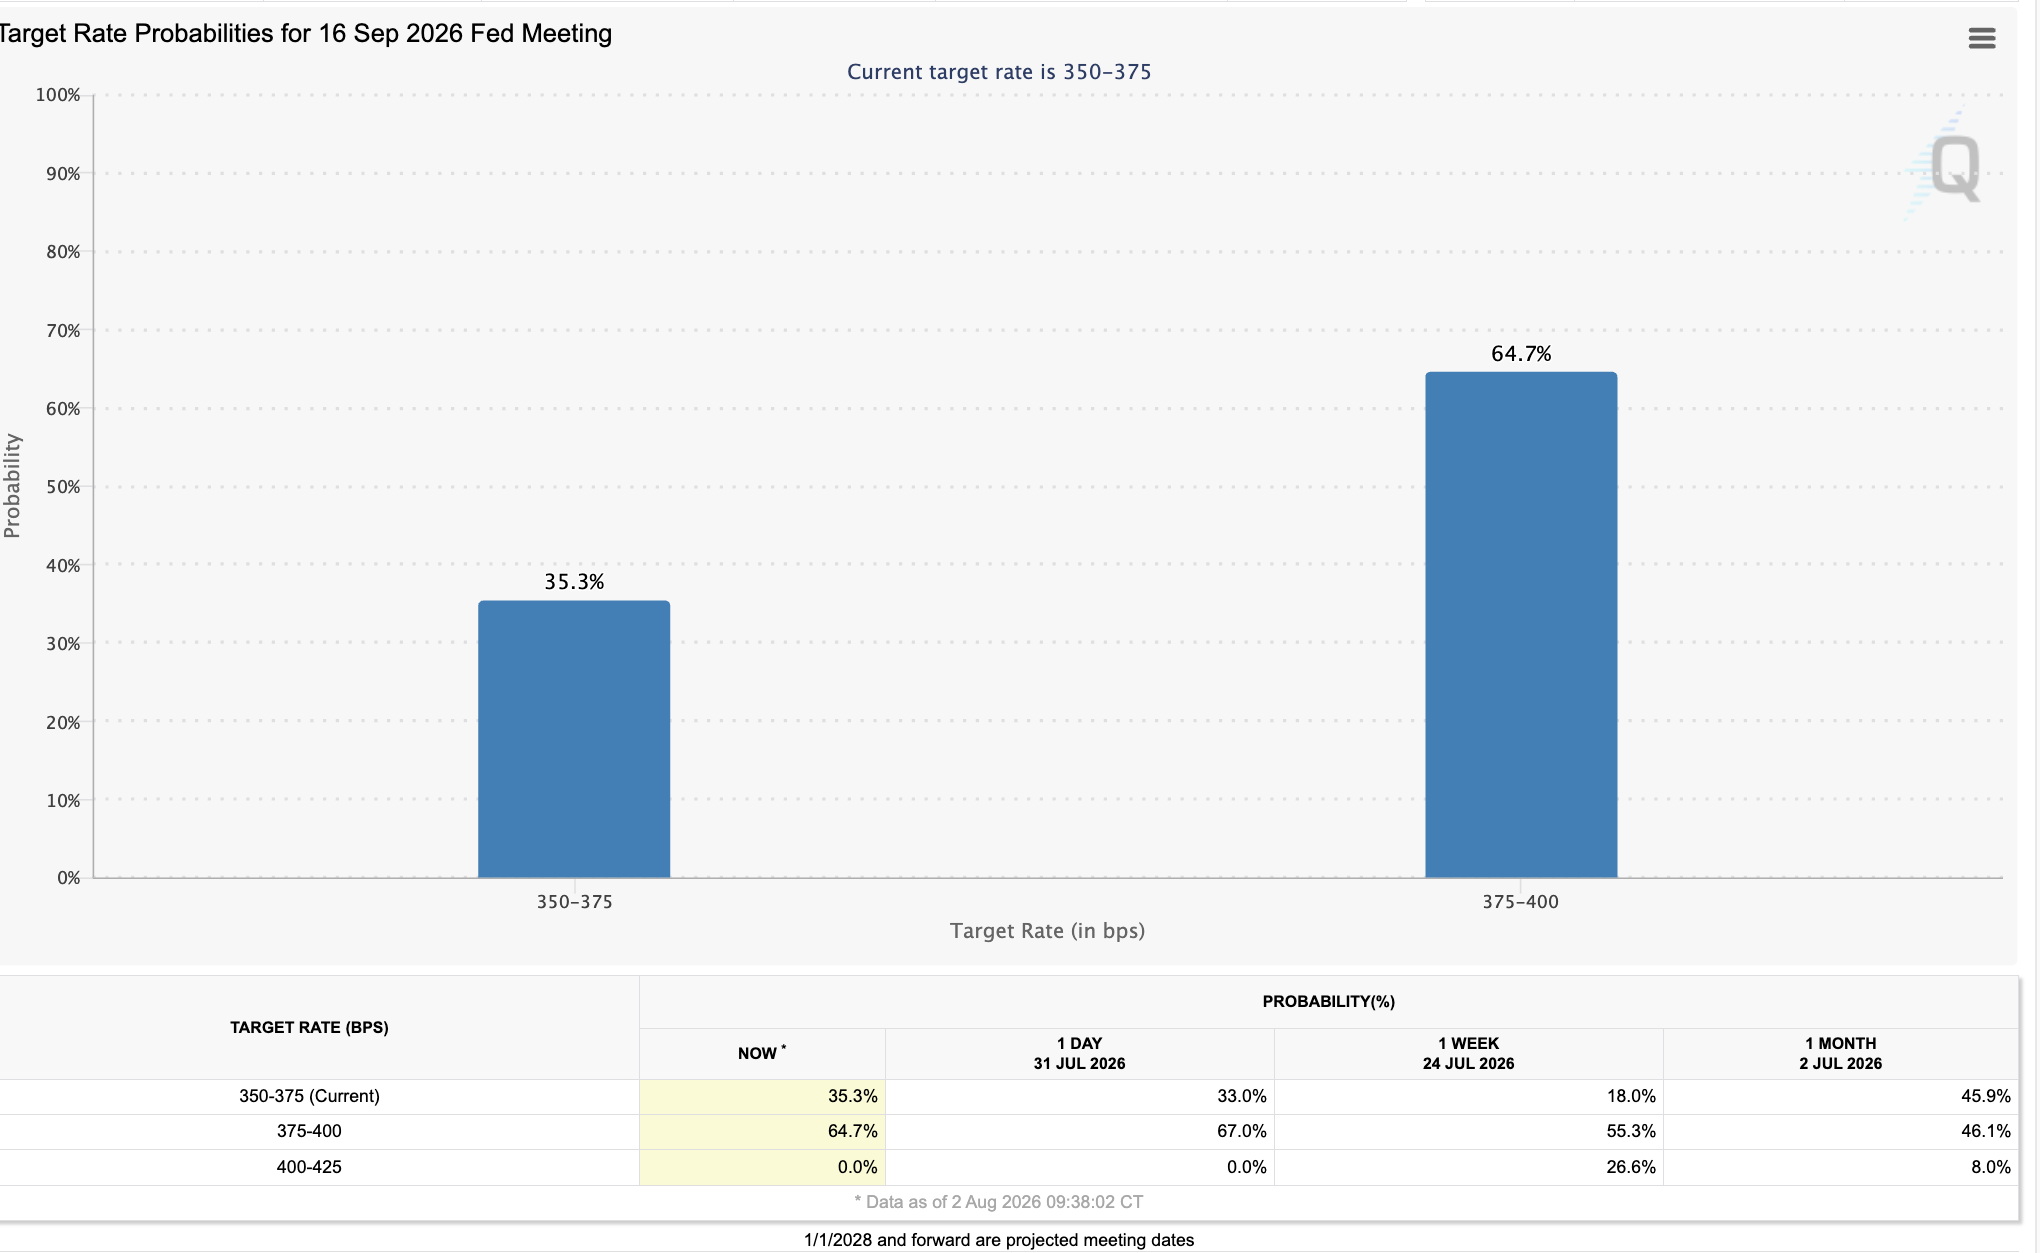
Warsh’s comments strengthened expectations that the Fed could consider a rate increase in September. Fed funds futures now assign roughly a 64.7 percent probability to a quarter-point increase at that meeting. Our base case, however, remains that policymakers will leave rates unchanged for the rest of the year.
Inflation remains close to or above 3 percent, but the Fed may treat part of the increase as the result of a supply shock, triggered by the conflict in the Middle East. This lens allows the Fed to avoid reacting immediately because higher interest rates cannot produce more oil or repair disrupted supply chains.
This approach also gives the Fed room to wait, but it creates a risk that inflation remains above target for longer than expected.
Bond Markets Send A Divided Signal
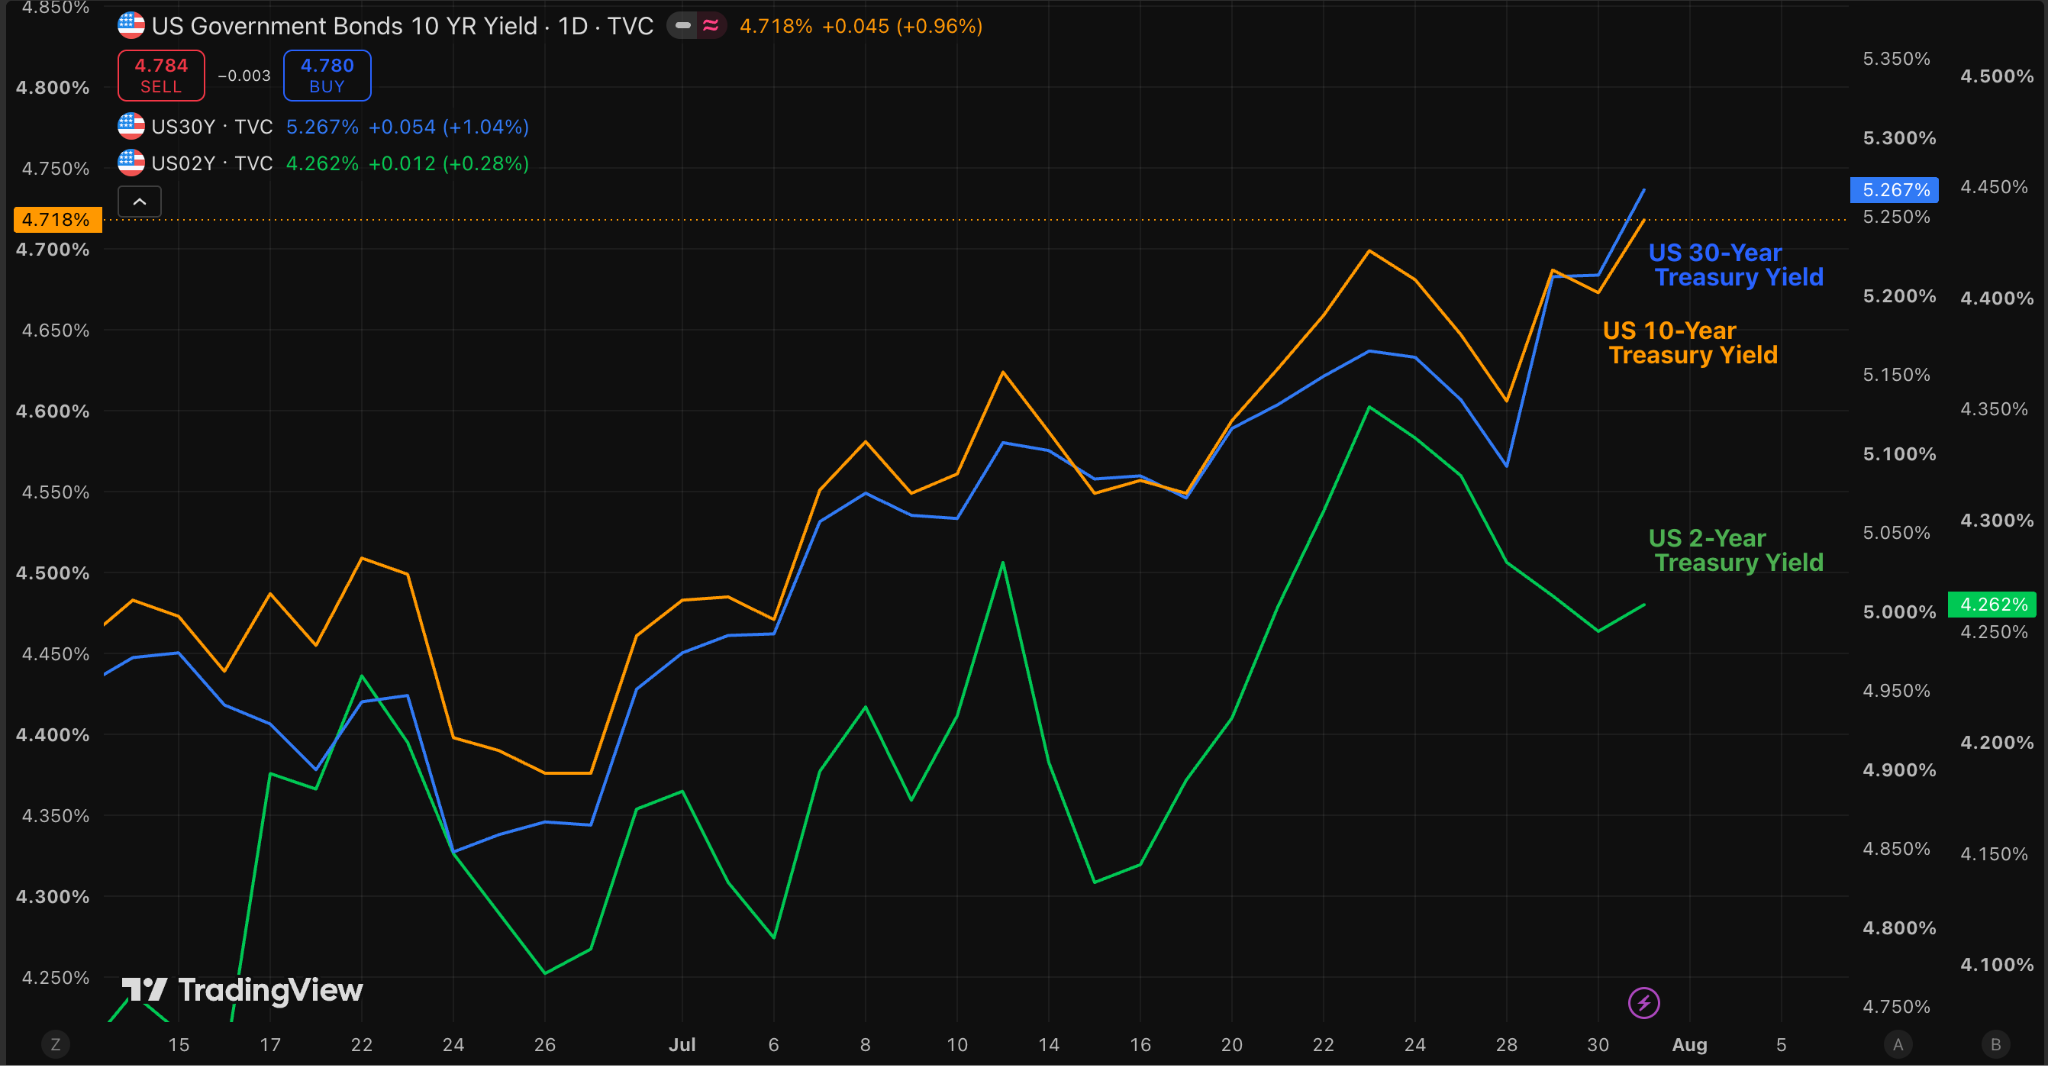
The clearest market response appeared in the US Treasury market. Yields on two-year notes declined, while yields on 10-year and 30-year bonds increased. This divergence demonstrates that the short and long ends of the yield curve are sending different messages.
The fall in the two-year yield suggests that investors do not expect an immediate policy rate increase. Short-term bond yields usually reflect expectations for Federal Reserve policy. The rise in longer-term yields reflects a different concern. Investors appear to be demanding more compensation for the risk that inflation will reduce the future value of the interest they are receiving on longer-dated bonds.
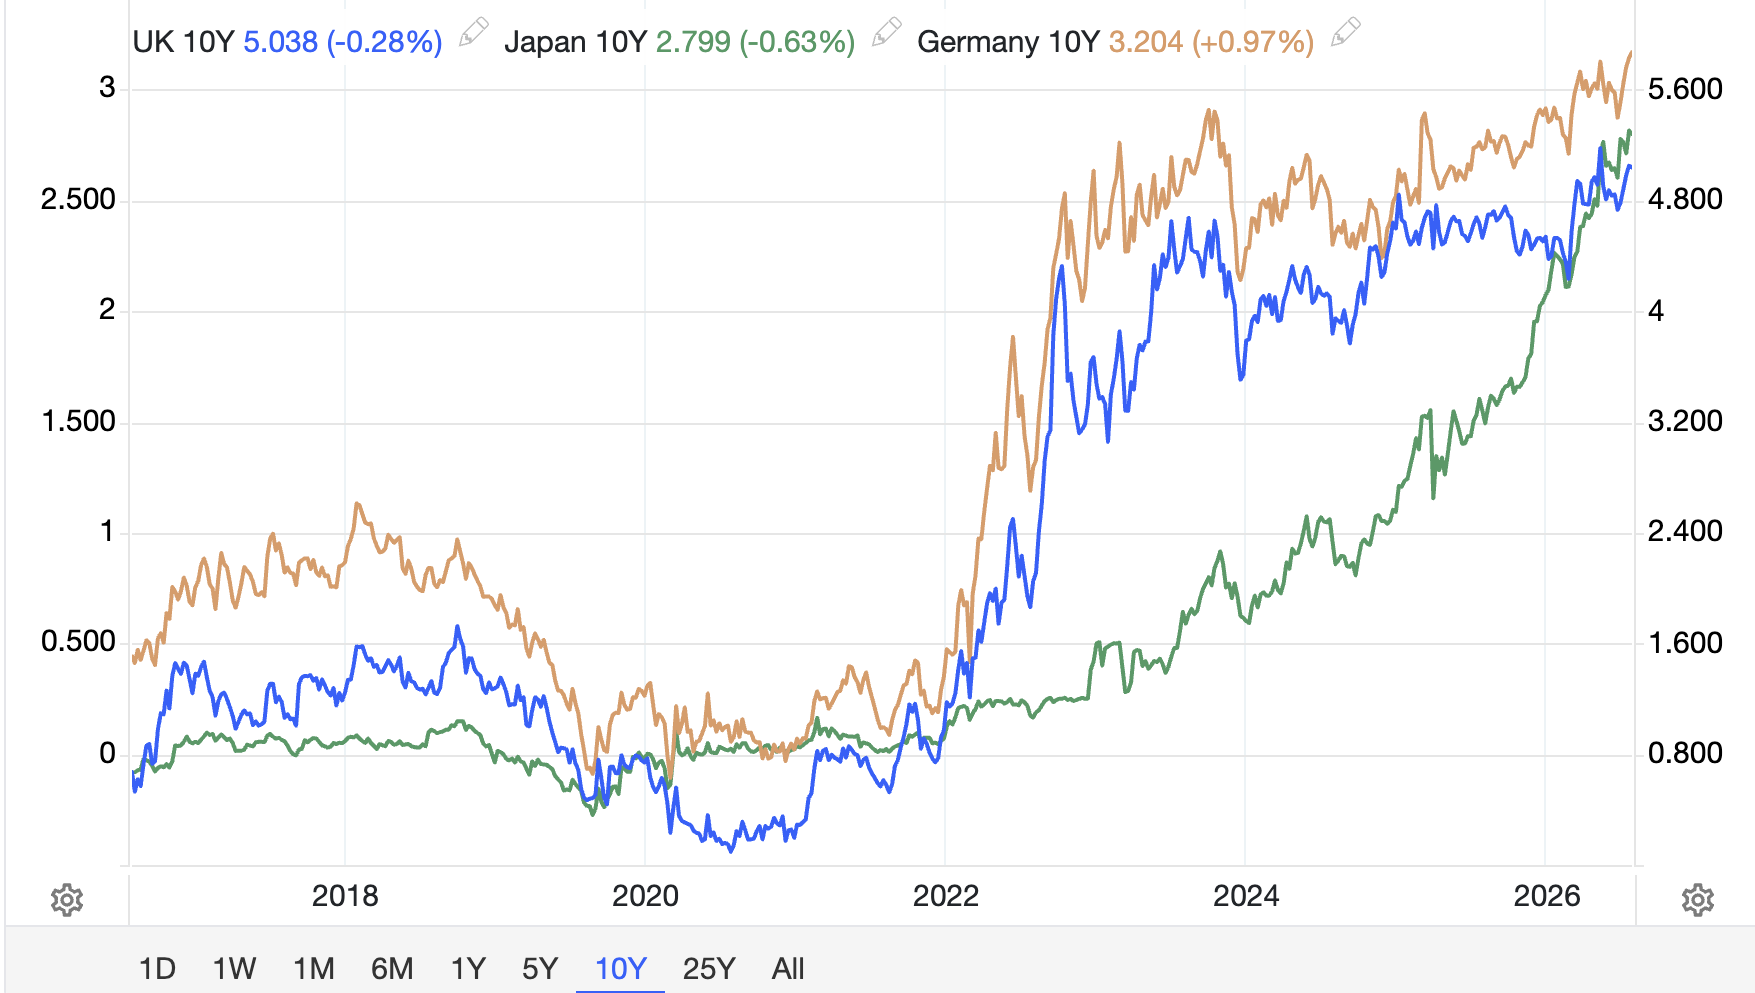
This suggests that markets are not only questioning when the Fed will act. They are also questioning whether its current approach will be effective in controlling inflation. This concern is not confined to the US: long-term yields in the UK, Germany and Japan have also risen to multi-year highs as energy costs feed inflation expectations, suggesting investors are repricing inflation risk globally rather than passing judgment on the Fed alone.
Limited Guidance Raises The Policy Risk
Warsh has argued that financial markets should rely less on Federal Reserve guidance and instead draw their own conclusions, telling reporters that market participants are learning to “play the ball, not the referee”. Less guidance, however, carries a cost. Markets understand that Warsh wants inflation back to 2 percent, but they have far less clarity about his so-called ‘reaction function’, meaning how much inflation, employment strength or financial stress it would take to trigger a rate increase. Part of this week’s volatility in bonds and equities reflects that gap.
The economic policy symposium in Jackson Hole, on 21-23 August, 2026 is the natural venue for the Fed to provide more guidance. Warsh could use the event to explain why the 2 percent target remains appropriate and how the central bank will respond if inflation stays above that level. Whether he will or not, remains to be seen.
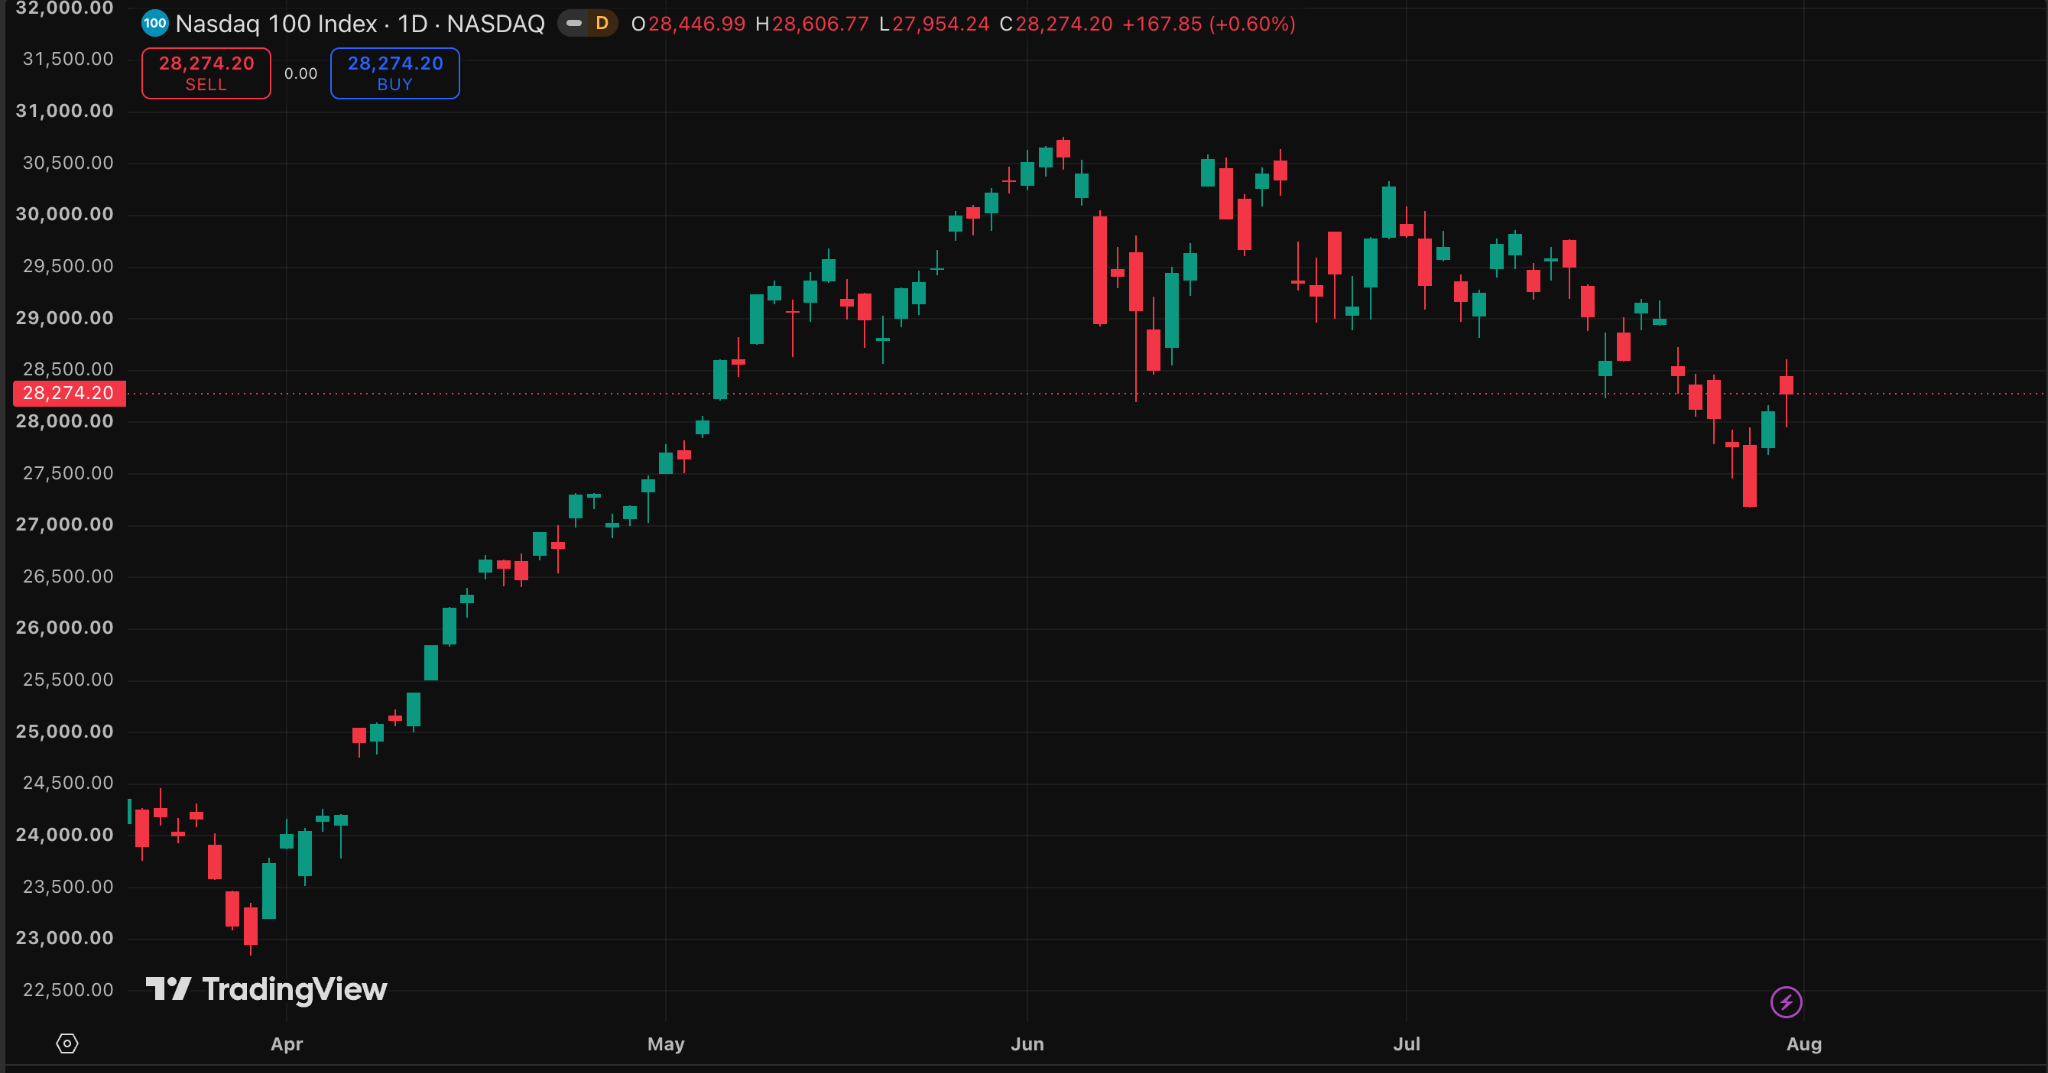
US equity markets have started to level off after strong returns during the first seven months of the year. Corporate earnings remain supported by a resilient economy, but technology-focused indices have moved lower.
Higher long-term yields are part of the reason. Investors discount future company earnings at current interest rates, and when those rates rise, the present value of future earnings falls.
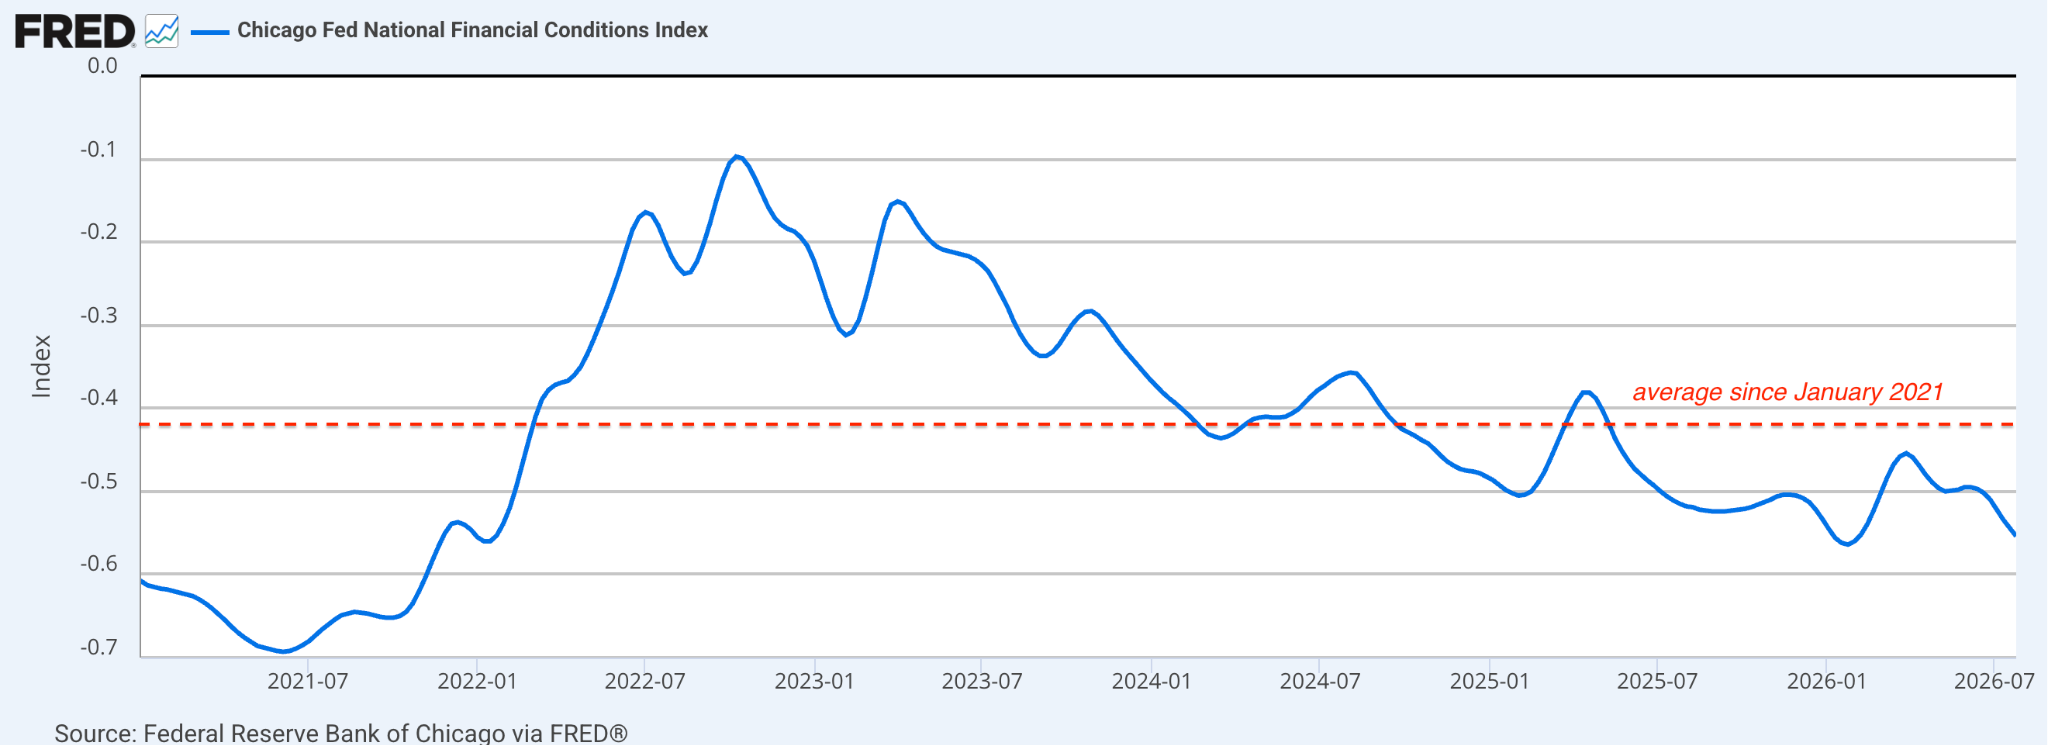
Even so, the pressure has not yet become a broad tightening of financial conditions. The Chicago Fed’s National Financial Conditions Index remained looser than its 5-year average through July.
The Outlook
The Fed is likely to keep its policy rate unchanged unless inflation pressures intensify or employment remains stronger than expected. However, the probability of a near-term rate increase has risen because more policymakers are openly supporting tighter policy.
Energy prices and geopolitical tensions will remain important risks. They could keep inflation elevated while increasing volatility in bonds and equities.
The White House’s preference for lower rates also creates a political contrast with Warsh’s firm inflation stance. The Fed will need to show that its decisions remain tied to economic conditions rather than political pressure.
For now, markets face an unusual policy mix. Short-term yields suggest that the Fed may wait, while long-term yields show that investors are becoming less comfortable with persistent inflation and the Fed’s ability to control it.
The next major test will be whether Warsh can explain the Fed’s reaction function at Jackson Hole. Clearer communication would not remove uncertainty, but it could help markets understand what conditions would cause the central bank to act.
Why This Matters for Bitcoin
We have described the market setting since early July as a tailwind for Bitcoin. That was never a claim that policy is easy. The Federal Reserve is not cutting rates or adding liquidity. The tailwind rests on three conditions: inflation above the 2 percent target, a central bank holding rather than raising rates and growth strong enough to support investor confidence. In that mix, cash and traditional bonds lose purchasing power faster than the inflation target implies. The effective policy rate is close to 3.63 percent against core inflation of 3.3 percent. This leaves the return on cash after inflation only slightly positive and negative against the second quarter’s 5.1 percent annualised pace. When a central bank tolerates above-target inflation rather than raising rates aggressively to control it, investors look for assets that cannot be created in unlimited amounts. The tailwind is an argument about the purchasing power of money, not about liquidity.
The same environment also creates the headwind. Because the Fed cannot easily cut while inflation remains high, real bond yields and the US dollar may stay elevated, and both raise the cost of holding an asset that pays no interest. The cleanest measure of that opportunity cost is the 10-year TIPS real yield, the return on a 10-year US government bond after inflation is removed. When it is low, investors give up little by holding Bitcoin instead. When it is high, a relatively safe bond pays a meaningful real return, and assets that pay no yield face pressure.
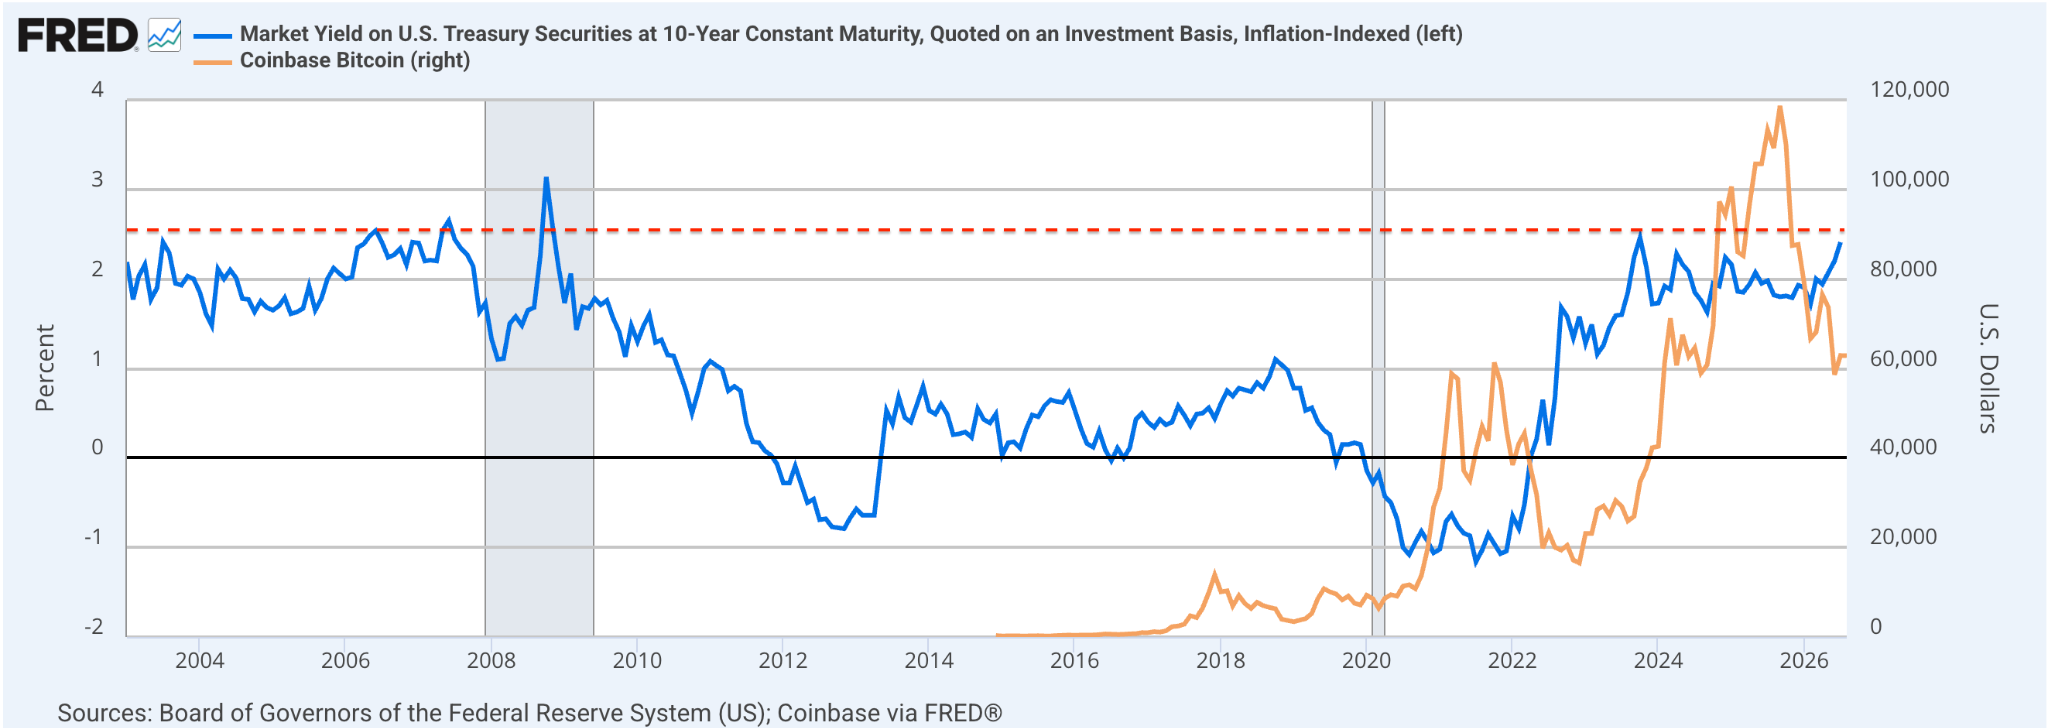
We use 2.5 percent as the dividing line because it marks the edge of Bitcoin’s observable history: the 10-year real yield has not reached that level since 2008, before Bitcoin even existed as a traded asset. The July 10-year TIPS auction cleared at the highest real yield since October 2008 reaching 3.09 percent. We know a lot more about how BTC reacts when real yields are below 2.5 percent. In 2022, the real yield’s climb from negative to about 1.7 percent accompanied a fall of more than 60 percent in Bitcoin prices, while the October 2023 approach to 2.5 percent pressured long-term bonds and equities. Above it, we do not have a historical precedent for how BTC might respond.
The 10-year real yield stood at 2.41 percent on 30 July, up from 2.24 percent at the start of the month and nine basis points below the threshold. Real yields can rise for more than one reason, and a break above 2.5 percent would not automatically be bearish for Bitcoin. But it would mean the tailwind we have described no longer applies, and if the yield holds there for two consecutive weeks we will retire the argument rather than reinterpret it.
What Would Prove This Wrong
Our views this week are that growth is stronger than the headline, that price pressure is firmer than the 12-month rate suggests, and that the Fed is holding because it must, not because it wants to. These are the conditions that would overturn them:
A federal funds rate increase, or the loss of two-sided language in Fed communications. The Fed held rates steady on 29 July, 2026, though three members dissented and futures markets priced in a roughly 64.7 percent chance for a September increase.
The 10-year TIPS real yield holding above 2.5 percent for two consecutive weeks.
A sustained retreat in diesel prices together with distillate inventories rebuilding toward their five-year average in the EIA’s weekly petroleum data.
Retail diesel rose for a third consecutive week to $5.31 per gallon on 27 July, 2026. US distillate fuel inventories stood at 110.6 million barrels in the week ending 24 July, 2026, about 10 percent below the five-year average, according to the US Energy Information Administration.
Computing-hardware prices flattening for two consecutive months while cloud capital-spending guidance holds, which would weaken the AI inflation channel.