

Issue #210:
BTC Absorbs Selling Pressure As Rate Cuts Vanish
BTC Trades Within a Consolidation Channel
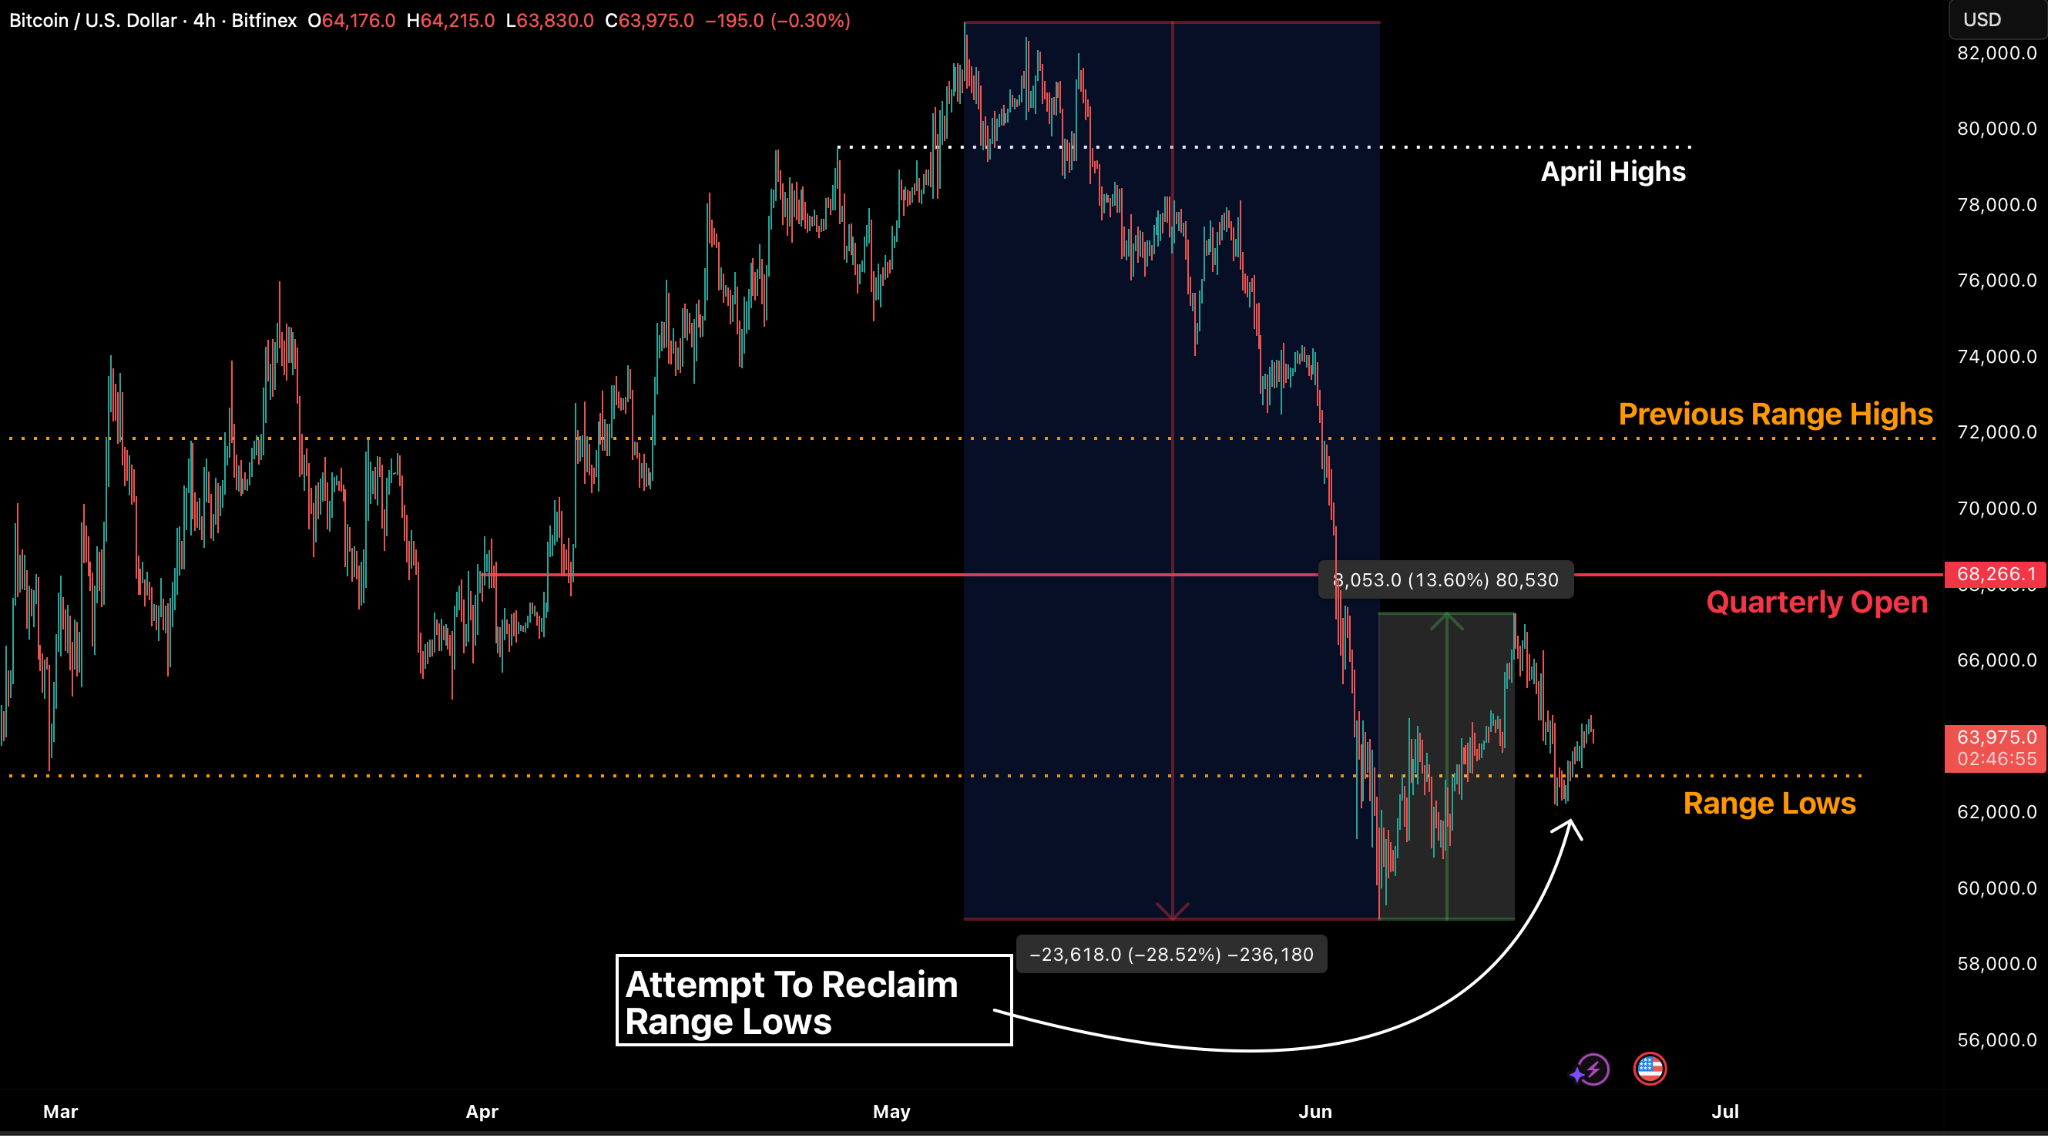
Bitcoin continues to trade within its established $62,500–$72,000 consolidation zone. A relief rally of 13.6 percent, originating from the 5 June dip below $60,000, saw prices reach $67,259 on 15 June before momentum stalled under the weight of external macro pressures. While the floor remains intact, our two key bull criteria: consistent ETF inflows and a stabilisation of the derivatives market are unfulfilled. However, declining ETF volumes suggest a market in limbo rather than a sustained bearish streak.
The Federal Reserve did not provide the relief markets sought either: a hawkish shift in the dot plot removed the prospect of any 2026 rate cut, and also effectively nullified any tailwinds from the US-Iran peace memorandum. There is nervousness even as crude prices have dropped 39 percent from their March peak to trade below $75. It is now all about monetary policy, leaving BTC to trade in lockstep with the Nasdaq-100 and broader equity markets.
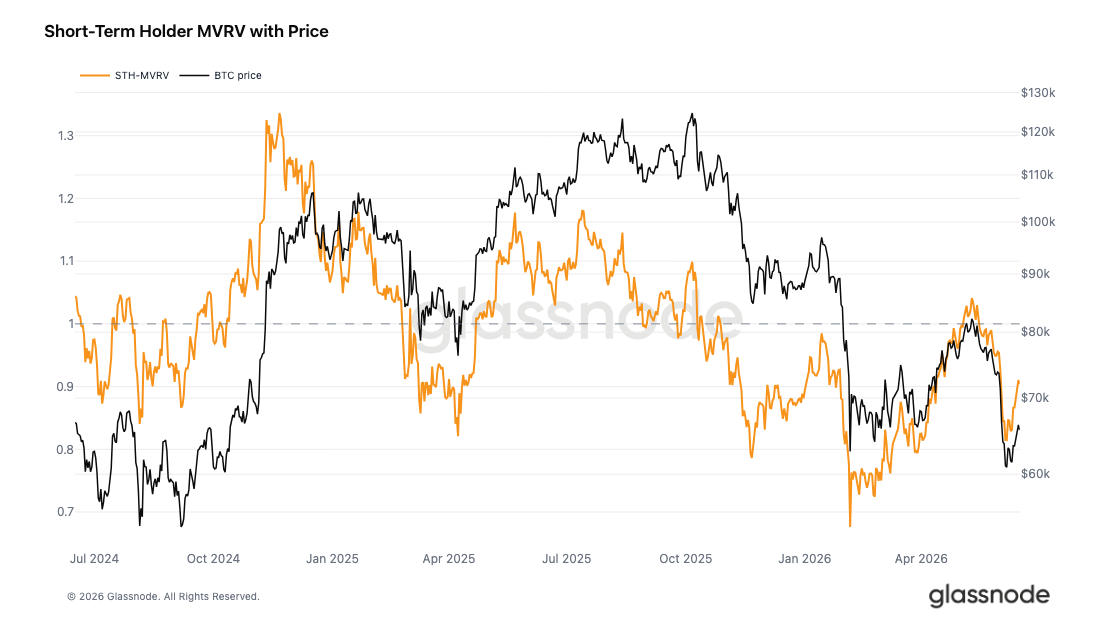
From a structural standpoint, BTC continues to trade beneath the active-investor cost basis, with the True Market Mean at $77,000 serving as the definitive bear-bull anchor. While the Short-Term Holder MVRV improved from 0.81 to 0.95, recent entrants with a cost basis of approximately $72,000 are still roughly 10 percent underwater. The $68,500–$72,000 zone remains the primary overhead supply band, especially following the rejection below the $68,266 quarterly open. We anticipate either further compression within the $62,000–$64,000 range, or broader oscillations between $60,000 and $70,000 as markets digest post-FOMC volatility and ongoing geopolitical shifts in the Middle East
The latest macro and crypto newsflow point to a market environment being reshaped by tighter policy expectations, resilient but fragile US domestic demand, and the continued institutionalisation of digital assets. The Federal Reserve’s decision to hold rates steady while signalling a stronger focus on price stability has shifted market expectations away from rate cuts and towards a potential tightening bias, lifting real yields and the US dollar while creating near-term pressure for gold and bitcoin. At the same time, US consumer spending remains firm, supported by stronger retail sales and core consumption, but this resilience is increasingly exposed to energy risk as crude inventories tighten, refinery utilisation rises, and fuel costs threaten to keep inflation pressures alive. Together, these forces suggest an economy that is still expanding in nominal terms, but one where persistent inflation and stronger energy demand limit the case for easier monetary policy.
Against this macro backdrop, there continues to be convergence between digital assets and traditional finance, with institutions increasingly seeking structured and regulated ways to gain crypto exposure. Franklin Templeton has filed for two exchange-traded funds that would reinvest equity dividends into bitcoin, blending traditional stock portfolios with systematic digital asset exposure. Meanwhile, BlackRock has expanded the bitcoin ETF market further with the launch of BITA, a covered-call product designed to generate income from bitcoin exposure by selling options on part of its portfolio. Together, these moves suggest that crypto is increasingly being integrated into conventional investment frameworks, not only as a speculative asset, but as a component of diversified portfolios, income strategies, and institutional allocation models. For now, though, these flows build slowly and do not offset the immediate macro pressure: until ETF demand turns and policy expectations ease, bitcoin stays range-bound and led by the macro tape rather than the institutional bid.

Market Signals
BTC Holds The Floor
A hawkish dot plot from the Federal Reserve and a fading Bitcoin Exchange Traded Fund (ETF) bid meant that even the current range for BTC remains unconfirmed. The positive news is that Bitcoin ended the week back inside the $62,500-$72,000 range, but this remains fragile. After dropping below $60,000 on 5 June, the subsequent 13.6 percent bounce, peaking at $67,259 on 15 June, saw the asset continue to test range lows for support, pressured by macro headwinds.
We have previously outlined two tests for the bulls for a potential sustained uptrend on lower timeframes: a sustained ETF bid, and a calming of the derivatives complex (neutral to negative funding, with lower premiums on downside protection in the options market). Both tests have failed, but the floor for BTC has held for now.

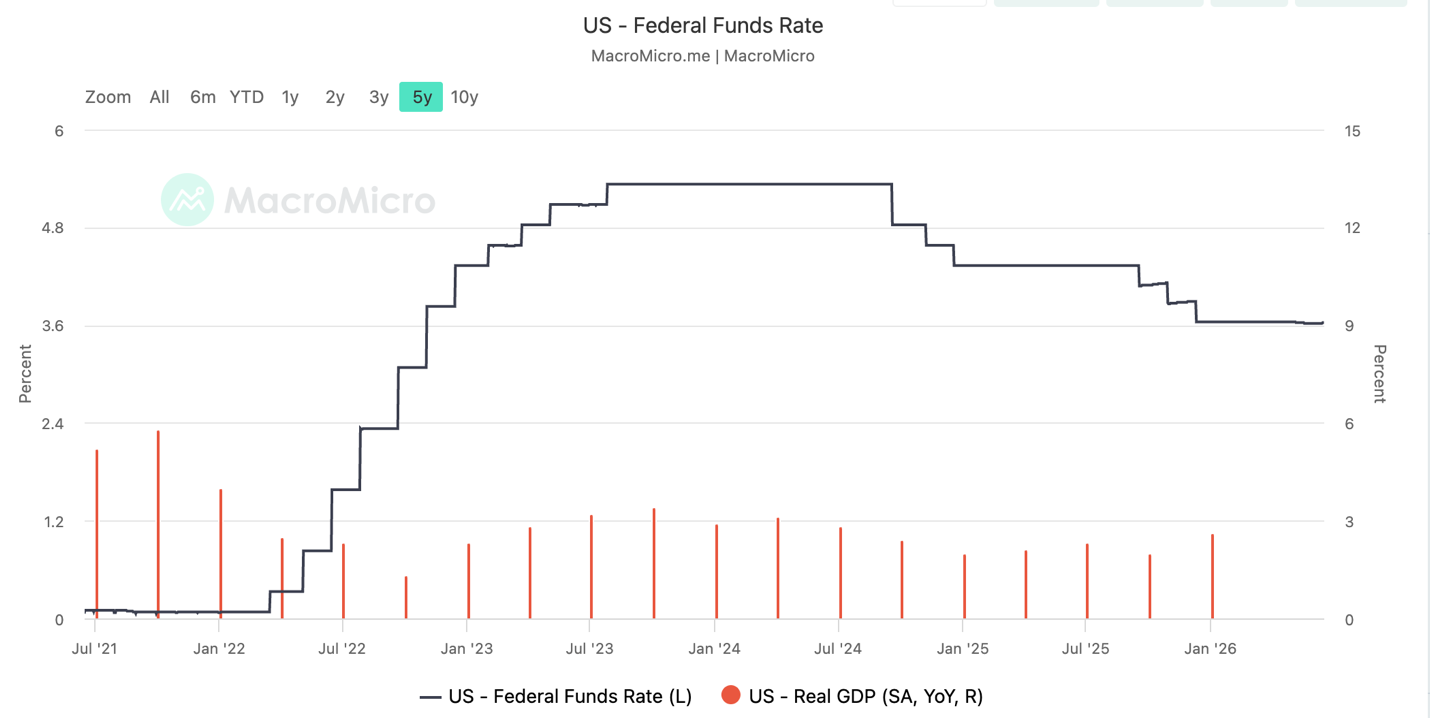
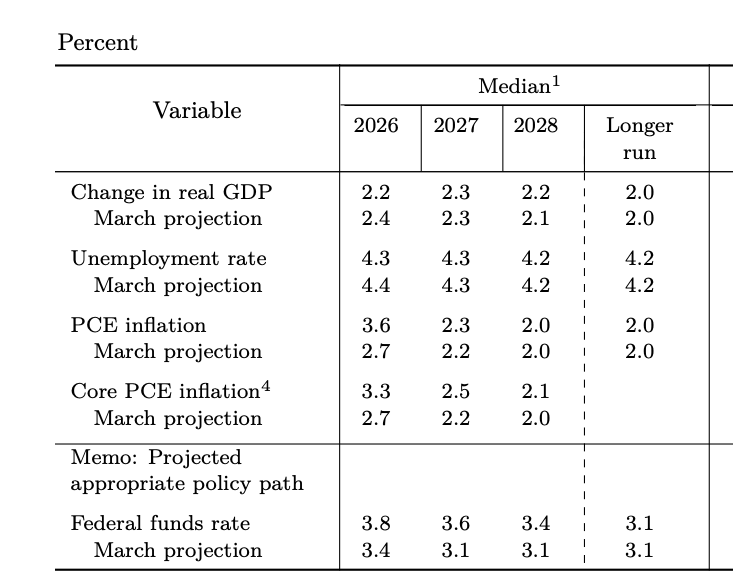
However, a sustained floor also requires a Federal Reserve willing to hold its nerve, and that has not quite happened. Any anticipated macro relief was effectively neutralised by the emergence of a hawkish dot plot (see Figure 8) at last week’s Fed policy meeting.
We now have two opposing forces pulling at market sentiment on inflation. Firstly there is the potential that energy risks could soften following a memorandum of understanding on a peace deal between the US and Iran. And secondly, a Fed which is focused on trailing inflationary heat rather than the immediate relief in crude prices, caused by the earlier spikes in prices.
BTC sits 9.3 percent higher than the -1 standard deviation band and 12 percent under the actual True Market Mean, keeping the on-chain environment in a bearish yet confined state. These rough extremities via the TMM bands also mark the Q1 range, which price was confined to for several months, and where it remains, despite a brief foray into the $80,000s, in mid-May. We expect price to respect these range extremes for the time being until the primary spot market participants, namely Treasury companies or ETFs, re-enter, and we see a decisive trend in their flows.
The ETFs currently provide the most definitive validation of this indecisiveness in the market currently. We had a solitary net inflow of $10.2 million on June 16, and prior to that, again a single day of inflows at $86 million on June 12 (see Figure 2). Both of these have failed to establish a trend.
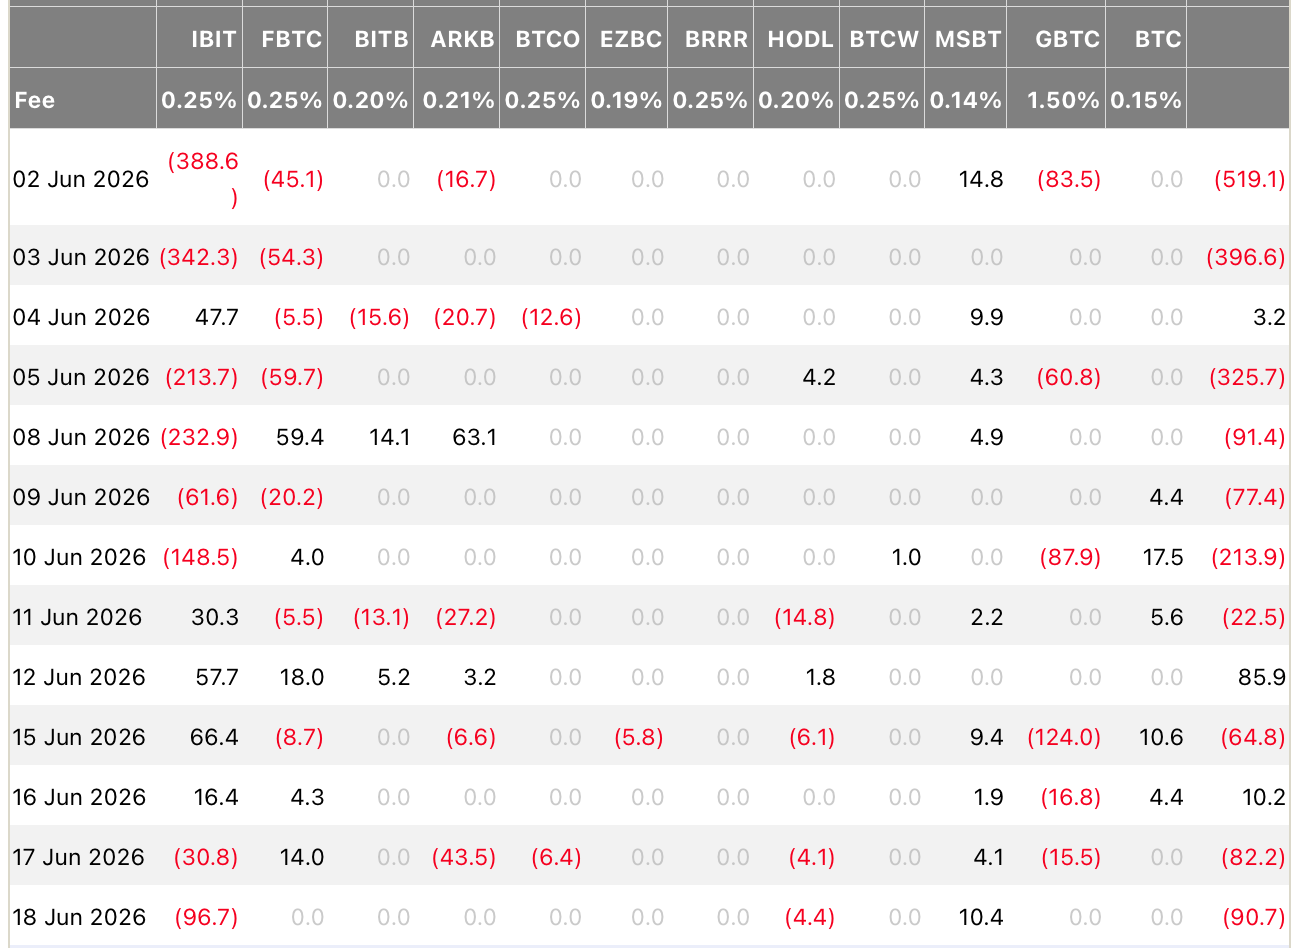
Instead, investment vehicles have reverted to net redemptions; cumulative monthly outflows are now at $2.1 billion, mostly driven by IBIT, which is an increasing cause for concern as the fund was the largest buyer within the ETF complex by a large margin throughout 2025.
Overall, the total volume traded across ETFs has also declined significantly, and in our view this means that the current ETF flow data does not support a bearish case. Indeed, the average daily outflows over the past week are still far below late May-early June’s $200 million per day average outflows, which is why we see the ETFs more in a state of limbo, than being in a bear market.
Sentiment among recent entrants is similarly strained: while the Short-Term Holder Market Value to Realised Value index climbed from 0.81 to 0.95 last week from the early-June lows, the implied cost basis of $72,000 means these holders remain nearly 10 percent underwater.
The price range between $68,500 and $72,000 is expected to act as a significant resistance level because many recent investors are currently holding their positions at a loss. As the market recovers toward their original entry prices, these holders are likely to sell as they reach a break-even point, creating natural downward pressure on the asset. Meanwhile, the aggregate Realised Price near $54,000 serves as a deeper floor that has yet to be tested.
This creates a technical map defined by three key levels: the $54,000 foundational floor, the $72,000 breakeven point for recent buyers, and the $77,200 hurdle for short-term holders. Throughout the last week, price action failed to recover even the lowest of these overhead resistance zones and we rejected from under the quarterly open at $68,266, near our lower end of the resistance band. For now, either prices compress further between the $62- $64,000 band or it oscillates within the larger $60-70,000 band, unless there is increased volatility, perhaps driven by more developments in the Middle East.

General Macro Update
Fed Signals a Hawkish Hold as Inflation Risk Builds
The Federal Reserve held interest rates steady at its policy meeting last week, but its latest decision sent a clear message: inflation now matters more than easing financial conditions. Markets responded by pricing in a higher chance of future rate increases, lifting the US dollar and real yields while weighing on gold and bitcoin.
In its latest Federal Open Market Committee (FOMC) policy decision, the Fed kept the federal funds rate in a range of 3.5 to 3.75 percent. The decision came alongside an updated Summary of Economic Projections (SEP), which showed a stronger inflation outlook and a higher expected path for interest rates.

The meeting marked Kevin Warsh’s first as Federal Reserve Chair. It also brought a clear change in tone. The Fed removed language that had previously pointed to possible future rate cuts. Instead, the committee said it would deliver price stability, meaning that it would aim to keep inflation low and predictable, so households, companies and investors can plan without expecting costs to rise too quickly.
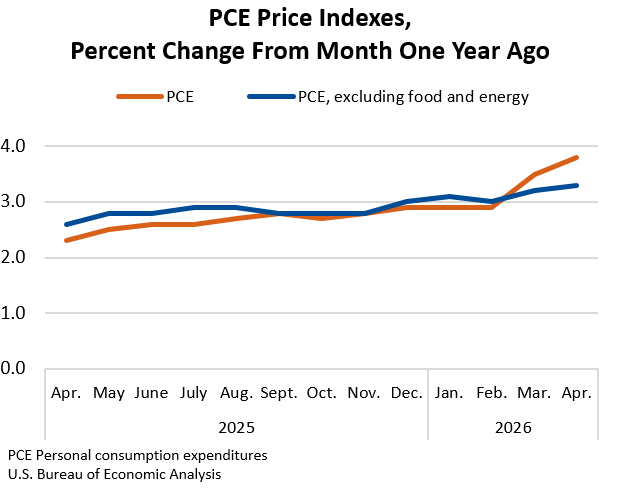
The shift came as inflation remained well above the Fed’s 2 percent target. The Personal Consumption Expenditures (PCE) price index, which is the Fed’s preferred inflation measure, rose to 3.8 percent in April. Other gauges, including the May Consumer Price Index (CPI), core CPI, the May Producer Price Index (PPI) and core PPI, also remain above the current policy rate and above the Fed’s target.
Persistent inflation can change behaviour. If investors, companies and households expect prices to keep rising, they may act in ways that make inflation harder to control. Companies raise prices earlier. Workers demand higher wages. Investors require higher returns to hold bonds. It is this kind of scenario that the Fed has a mandate to prevent.
The Fed’s updated projections reinforced the message. The central bank raised its 2026 PCE inflation forecast to 3.6 percent from 2.7 percent. It also raised its core PCE forecast for 2026 to 3.3 percent from 2.7 percent. Core PCE strips out food and energy prices, which tend to be volatile.

That does not make a rate hike certain. It shows that the Fed has moved away from a rate-cutting bias and towards a tightening bias: policymakers may raise rates if inflation fails to cool. Higher rates make borrowing more expensive, which can slow demand and reduce price pressure over time.
Warsh also changed how the Fed communicates. The policy statement was shorter and offered less guidance on the next move. Warsh said the Fed had dropped forward guidance from the statement, removing signals about possible future policy. The dot plot remains, so investors still have a window into policymakers’ rationale.
The Fed kept its balance sheet policy unchanged. The committee reaffirmed its ample reserves framework, meaning banks should continue to hold enough reserves to support smooth money-market conditions. No major changes to balance sheet management appear imminent. Market Reaction
Markets reacted quickly. Shorter-term Treasury yields rose as investors priced in a higher chance of rate hikes. Long-term yields followed, with the 10-year Treasury yield moving back towards the 4.48 percent area.
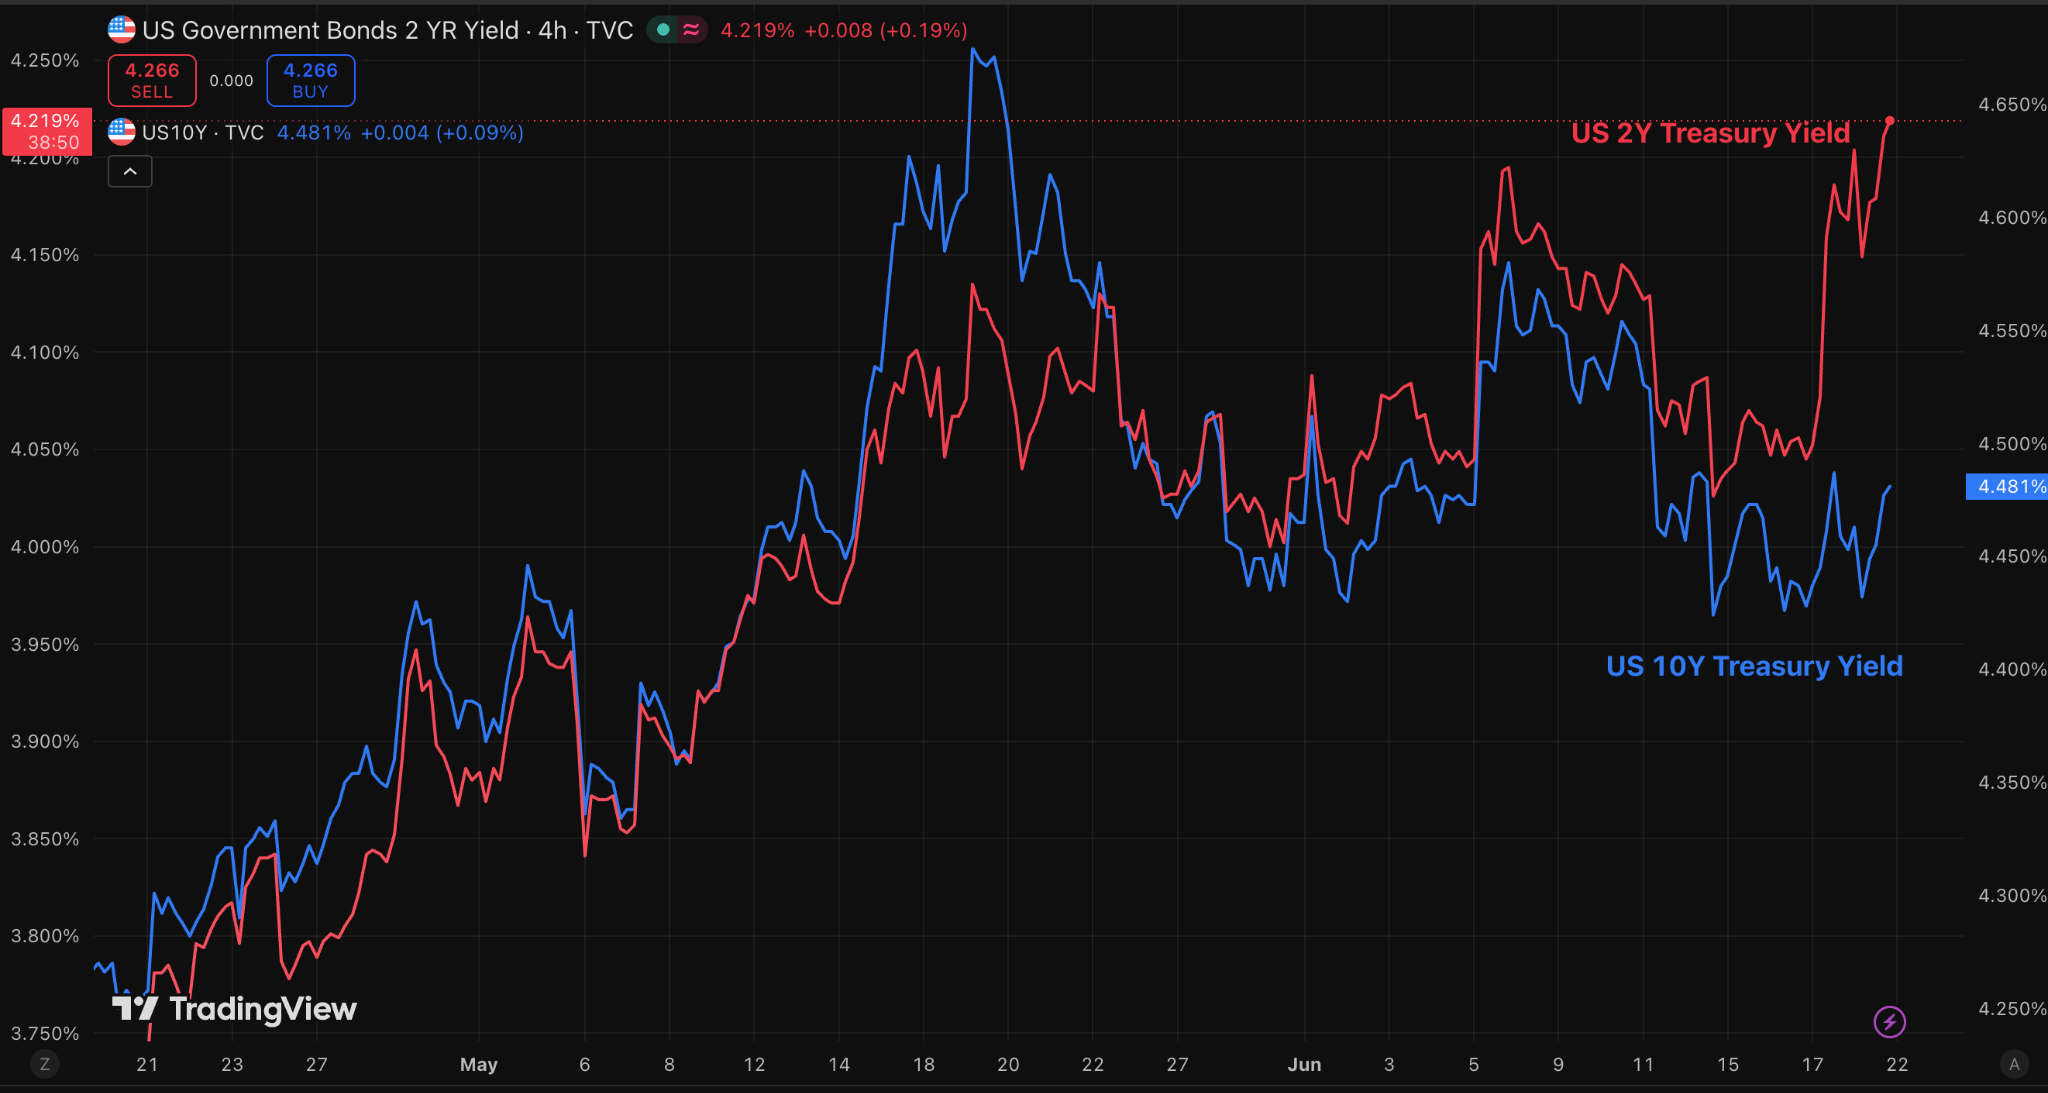
The bond market move matters because it came mainly from higher real yields rather than higher inflation expectations. A real yield is the return investors earn after adjusting for inflation. When real yields rise, safe assets such as US government bonds become more attractive, placing pressure on assets that offer no income, such as gold and bitcoin.
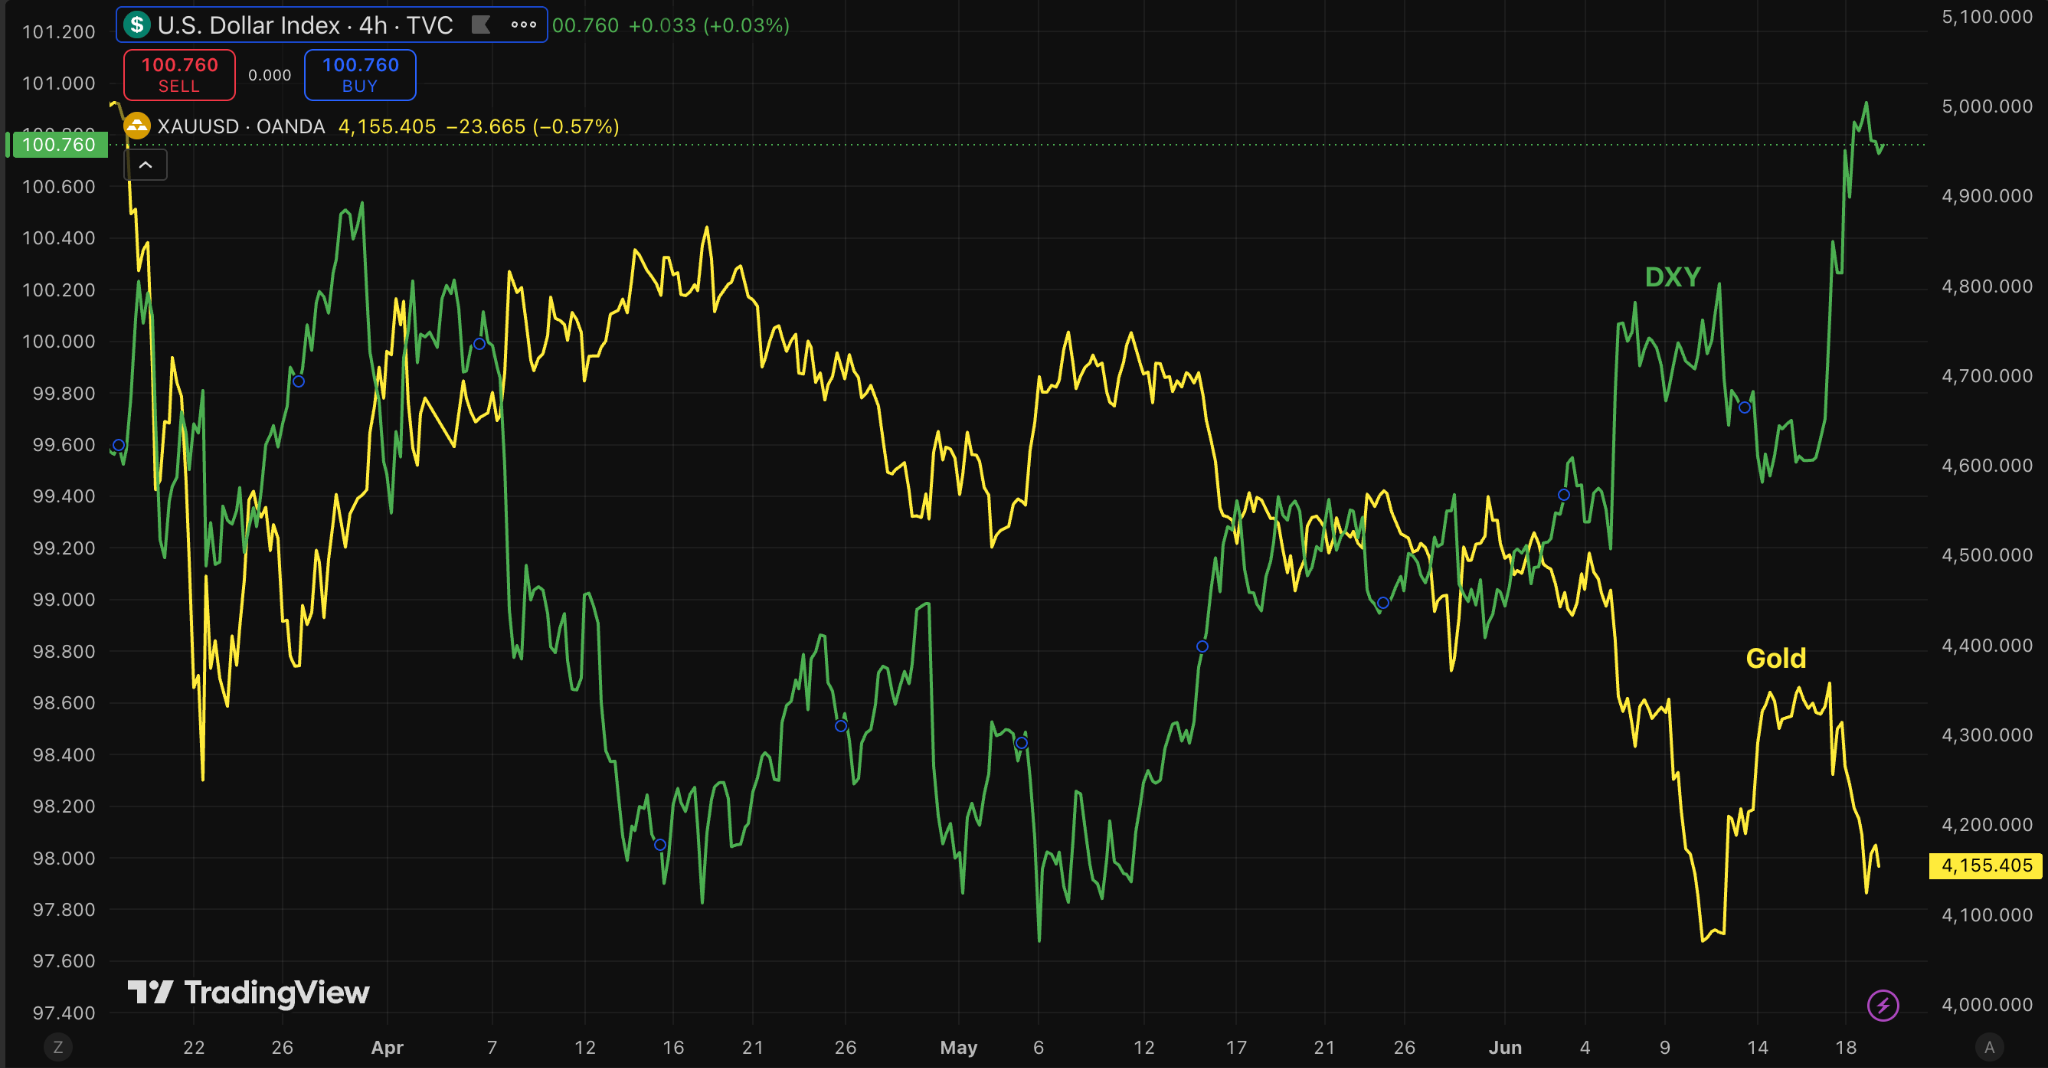
The US dollar strengthened after the decision. Higher expected rates can make US assets more attractive to global investors, and the Fed’s renewed focus on price stability also reduced demand for the dollar debasement trade. That trade had supported assets such as gold, bitcoin and the Swiss franc when investors believed the Fed could tolerate higher inflation.
Gold fell after the meeting. Bitcoin also faced a less supportive macro backdrop. Higher real yields and a stronger dollar often tighten financial conditions, which can reduce demand for risk assets and alternative stores of value. What hit Bitcoin was specific, not simply a broad risk-off move. Gold, Bitcoin and the Swiss franc had been bid as a single debasement trade, a bet that the Fed would tolerate above-target inflation and allow the dollar’s purchasing power to erode. Warsh’s recommitment to price stability removed the premise of that trade at the same moment that real yields rose and the dollar strengthened, so the basket sold off together rather than equities alone.
Bitcoin sits at the intersection of two channels, which is why the move landed on it directly. As a long-duration, liquidity-sensitive asset, it is pressured when real yields rise, because a positive real return on Treasuries raises the opportunity cost of holding an asset that pays no income. As a monetary hedge, its case depends on the Fed losing control of inflation or debasing the currency, the outcome Warsh’s credibility shift argued against. Equities felt the first channel and gold the second, but Bitcoin felt both at once. This explains the size of the reaction without overturning the longer-term case, which rests on adoption and supply rather than on any single Fed meeting.
The outlook now depends on incoming data. If inflation remains firm, the September FOMC meeting could become live for a rate increase. Recent declines in energy prices could help headline inflation ease in the near term, as lower oil and gasoline prices reduce transport costs and relieve household budgets. That decline mainly reflects the unwinding of the Middle East conflict risk premium rather than a looser physical oil market, so with crude inventories at a 40-year low the easing is fragile and the risk to energy prices stays skewed to the upside. But the Fed is unlikely to rely on energy alone: it may pause for longer if rent inflation slows, wage growth weakens and demand softens, yet policymakers will want evidence that underlying inflation is also cooling.
For markets, this creates a more complex environment. Bonds now reflect higher real-rate risk. The dollar has regained support from policy credibility. Gold and bitcoin face near-term pressure from tighter financial conditions. Unless inflation data improves meaningfully, the Fed’s next move looks more likely to be a hike than a cut.

US Consumers Keep Spending While Oil Inventories Tighten
US economic data showed that household demand remained strong in May, even as the energy shock from the Middle East conflict tightened oil supply and kept inflation risks alive. Strong retail sales and falling crude inventories point to an economy that still has momentum, but one facing rising pressure from fuel costs, lower savings and a more cautious Federal Reserve.
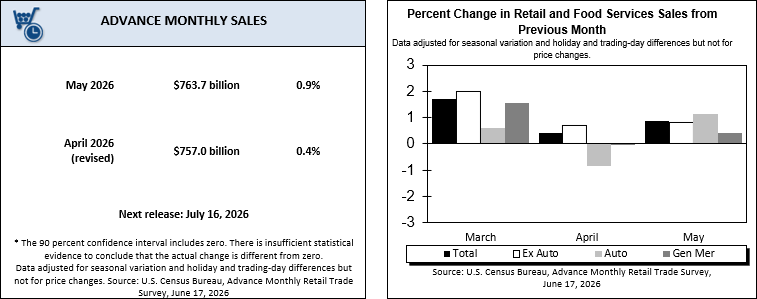
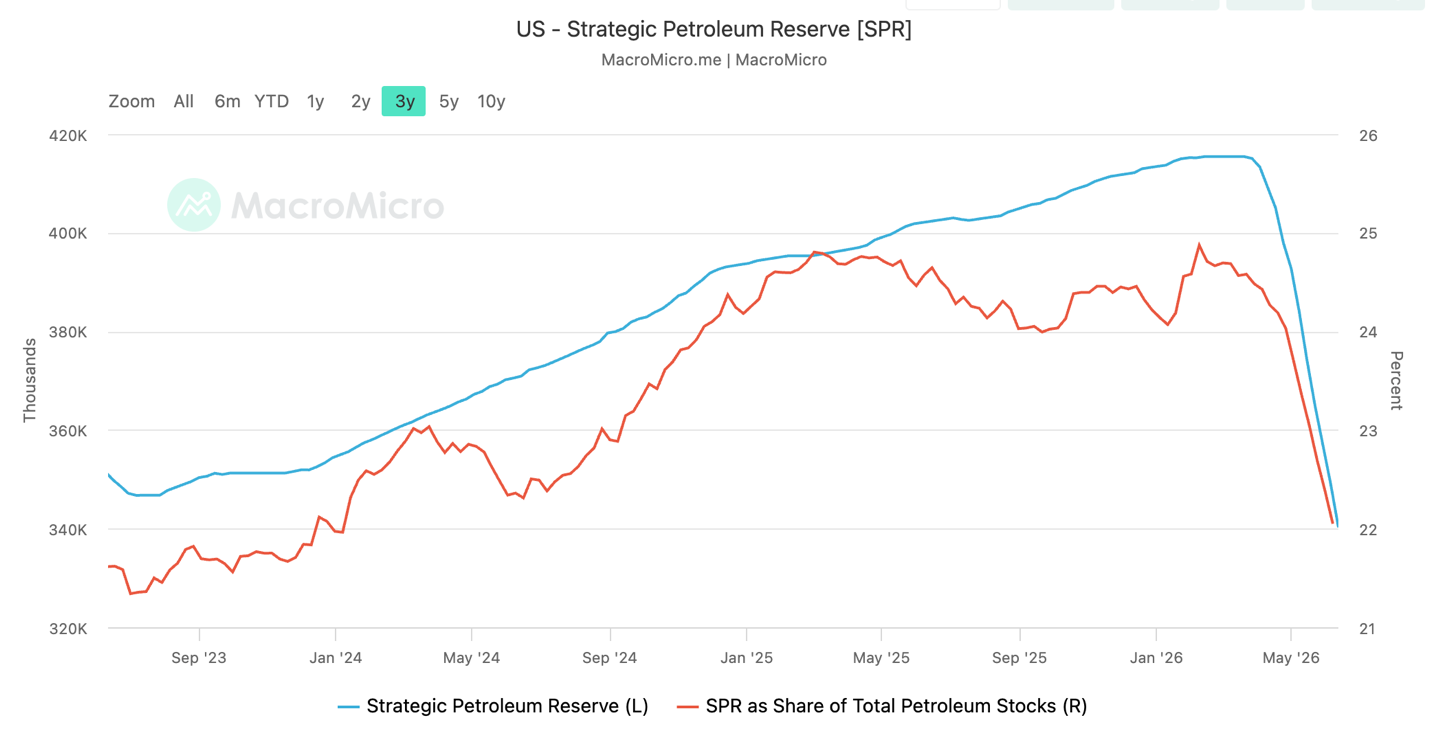
The US Census Bureau’s Advance Monthly Sales For Retail And Food Services showed that retail sales rose 0.9 percent in May, above expectations of a 0.5 percent increase. The US Energy Information Administration’s Weekly Petroleum Status Report showed that total crude oil inventories, including commercial stocks and the Strategic Petroleum Reserve (SPR), fell by 17.2 million barrels to 758.5 million barrels in the week ending 12 June, the lowest level since March 1985.
The two reports describe the same economy from different angles: consumers kept spending, while the energy system drew down supply to meet stronger domestic and foreign demand. Oil is a core input for transport, logistics and consumer prices, not just another commodity.
Retail sales were helped by a rebound in motor vehicle purchases, stronger online spending and higher receipts at service stations. Petrol station sales rose because fuel prices had climbed after the conflict disrupted energy markets. This means part of the retail sales gain came from higher prices, not only from stronger real demand.
The oil data showed deeper supply stress. Commercial crude inventories fell by 8.3 million barrels to 418.2 million barrels, while stocks at Cushing, Oklahoma dropped to about 20 million barrels. Cushing is a key delivery and storage hub for West Texas Intermediate crude. When inventories there approach operational lows, pipelines and storage systems have less flexibility to move oil smoothly through the market.
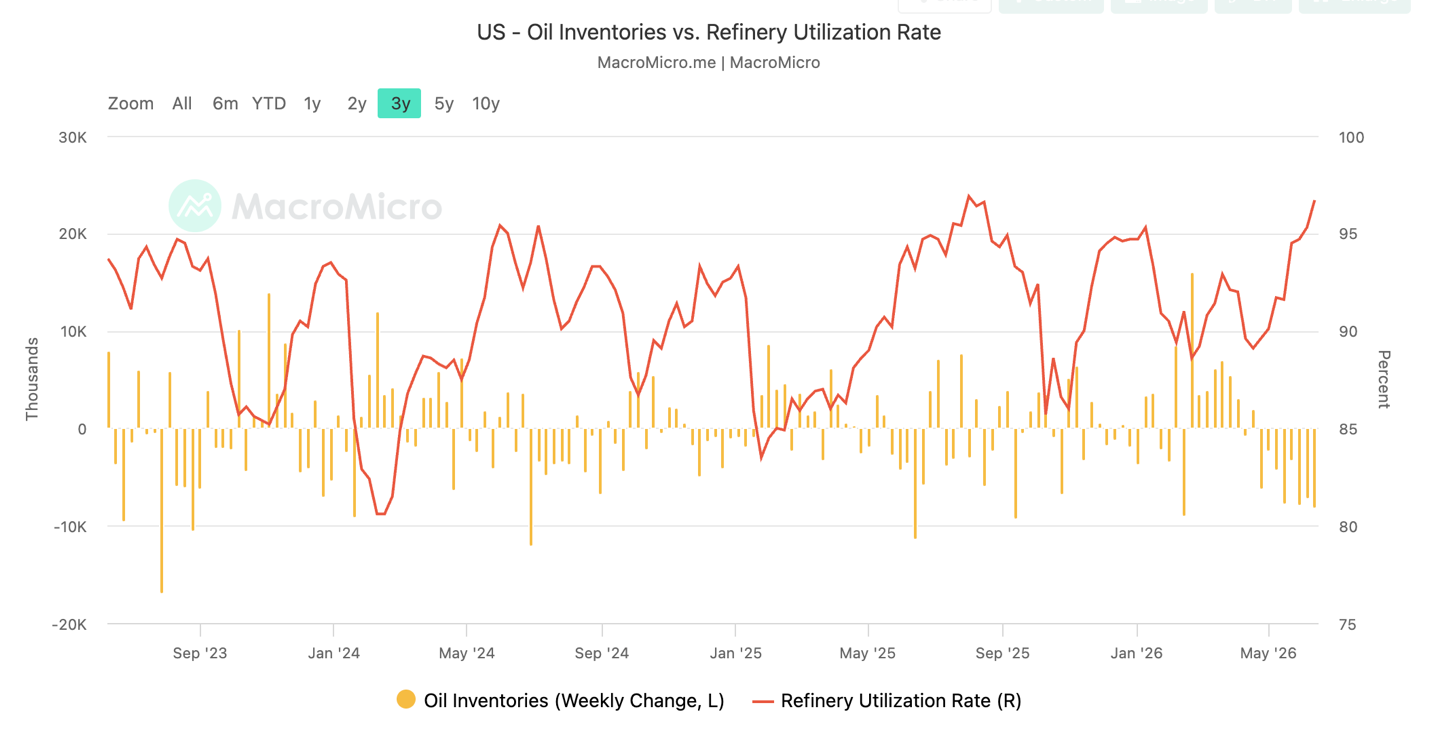
The inventory decline also reflected external demand for US crude. Supply disruptions linked to the Strait of Hormuz pushed more countries to seek US oil and refined products. At the same time, US refineries increased crude processing by 230,000 barrels per day and operated at 96.7 percent of capacity. That helped meet fuel demand, but it also accelerated the drawdown in crude stocks.
The two sides connect through demand: stronger consumer activity lifts demand for transport, delivery, travel and fuel. When foreign buyers compete for US crude simultaneously, inventories can fall faster even as oil prices ease from their highs.
Petrol demand reinforced this connection. Product supplied, a proxy for demand, rose to 20.68 million barrels per day, while petrol consumption increased to 9.21 million barrels per day. Petrol stocks still fell by 906,000 barrels. Refiners lifted output, but demand absorbed much of the extra supply.
The consumer picture is constructive, but not without weakness. The headline retail sales gain was supported by tax refunds, a stock market rally and higher spending by wealthier households. Those supports may fade. Inflation has also outpaced wage growth in recent months, while savings have fallen. Spending growth may slow if consumers rely more on credit or cut back in response to higher living costs.
The Federal Reserve kept its benchmark overnight interest rate in the 3.5 to 3.75 percent range, but policymakers signalled concern about inflation. Higher energy prices can feed through transport costs, production costs and household budgets. If inflation remains firm, the Fed may keep higher rates for longer, making borrowing more expensive for households and companies.
Core retail sales, which exclude automobiles, petrol, building materials and food services, rose 0.7 percent in May. This measure matters because it tracks the part of retail activity that feeds more directly into gross domestic product (GDP). When core retail sales rise, it suggests consumer spending can still support growth.
The US economy remains resilient, but that resilience is becoming more fragile. Consumers are still spending, refineries are running hard and global buyers still need US energy. Yet tight oil inventories and high fuel sensitivity mean inflation risks can return quickly if the Middle East situation worsens or supply is slow to replenish. Strong retail sales reduce near-term recession fears, while low crude inventories keep energy risk elevated. Crude prices themselves have eased recently as the conflict premium unwound, which is cooling headline inflation, but with inventories at a 40-year low that relief is fragile and energy remains an upside risk rather than a settled disinflationary trend. That mix supports nominal growth but limits the case for easier policy. Unless energy supply improves and spending broadens beyond temporary supports, the economy could face stronger growth and stronger inflation together.

Franklin Templeton has submitted filings for two new exchange-traded funds that would use equity dividends to build exposure to bitcoin.
According to the filing, the asset manager is seeking to register the Franklin US Equity Bitcoin DRIP Index ETF and the Franklin US Innovation Bitcoin DRIP Index ETF. The funds could become effective as early as 01/09/2026.
The proposed ETFs would track the VettaFi US Large-Cap 500 Bitcoin DRIP Index and a related innovation-focused version. Rather than paying out or reinvesting dividends back into the same equities, the strategy would direct dividends from the underlying stock holdings into Bitcoin exposure.
The filing states that this Bitcoin exposure may be obtained through Bitcoin exchange-traded products, futures, options, or other eligible instruments.
The index is expected to begin with a 95 percent allocation to US large-cap equities and a five percent allocation to Bitcoin. During quarterly rebalancing, Bitcoin exposure above five percent would be reduced to 4.5 percent. Between rebalances, Bitcoin exposure would be subject to a 20 percent overall cap.
The proposed structure reflects a growing effort among asset managers to integrate Bitcoin exposure into traditional equity products, allowing investors to participate in digital asset markets through familiar portfolio frameworks.

News From the Cryptosphere
BlackRock Launches BITA, Engineering Income From A Non-Yielding Asset

BlackRock has launched the iShares Bitcoin Premium Income ETF (BITA) on Nasdaq, extending its bitcoin product line beyond simple price exposure. Unlike a traditional spot Bitcoin Exchange Traded Fund (ETF), BITA is designed to pay investors regular income through a covered-call strategy while maintaining exposure to Bitcoin. The fund builds on BlackRock’s existing spot bitcoin ETF, IBIT, one of the largest BTC investment vehicles in the world.
BITA gains Bitcoin exposure through a combination of direct Bitcoin holdings and shares of IBIT, and it generates income by selling call options on roughly 25 percent to 35 percent of its portfolio. A covered call is the sale of an option that gives the buyer the right to purchase an asset at a set strike price, with the seller keeping the premium in exchange for capping its upside. Investors receive those premiums as income, typically distributed on a monthly basis. The approach is common in equity income funds but relatively new in the Bitcoin ETF market. BlackRock has set the expense ratio at 0.65 percent, below several competing Bitcoin covered-call funds such as Roundhill’s YBTC (0.95 percent), NEOS’s BTCI (0.99 percent), Global X’s BCCC (0.75 percent), and Grayscale’s BTCC (0.66 percent).
The central appeal of BITA is that it attempts to turn a non-yielding asset into an income-producing one, with BlackRock indicating that the strategy aims to deliver meaningful cash distributions while still capturing a substantial portion of Bitcoin’s price appreciation. The trade-off is that if Bitcoin rises sharply above the option strike prices, BITA may underperform a pure spot fund because part of the gains are sold away for premium income, while investors still bear the full downside if Bitcoin falls. Some industry estimates point to potential yields in the mid-teens, though payouts depend on volatility and option premiums and are not guaranteed.
The launch reflects the maturation of the crypto ETF market and the institutionalisation of Bitcoin exposure, as issuers move from products that rely solely on capital appreciation towards those engineered to generate cash flow for income-focused investors, retirees and portfolio managers.

Franklin Templeton Files For ETFs That Reinvest Stock Dividends Into BTC

Franklin Templeton has submitted filings for two new exchange-traded funds that would use equity dividends to build exposure to bitcoin.
According to the filing, the asset manager is seeking to register the Franklin US Equity Bitcoin DRIP Index ETF and the Franklin US Innovation Bitcoin DRIP Index ETF. The funds could become effective as early as 01/09/2026.
The proposed ETFs would track the VettaFi US Large-Cap 500 Bitcoin DRIP Index and a related innovation-focused version. Rather than paying out or reinvesting dividends back into the same equities, the strategy would direct dividends from the underlying stock holdings into Bitcoin exposure.
The filing states that this Bitcoin exposure may be obtained through Bitcoin exchange-traded products, futures, options, or other eligible instruments.
The index is expected to begin with a 95 percent allocation to US large-cap equities and a five percent allocation to Bitcoin. During quarterly rebalancing, Bitcoin exposure above five percent would be reduced to 4.5 percent. Between rebalances, Bitcoin exposure would be subject to a 20 percent overall cap.
The proposed structure reflects a growing effort among asset managers to integrate Bitcoin exposure into traditional equity products, allowing investors to participate in digital asset markets through familiar portfolio frameworks.