

Issue #217:
ETFs Buy, Treasuries Sell, The Range Holds
The Bid Is Back
Bitcoin’s bid has returned, but the recovery remains dependent on macroeconomic relief rather than an independent crypto catalyst. Institutional demand is strengthening just as weaker US employment data reduces the likelihood of a September rate increase, yet corporate treasury selling and stubbornly high long-term yields continue to limit the upside.
BTC advanced towards the top of its $62,000–$65,000 range as risk assets rallied on geopolitical de-escalation, lower oil prices and softer US labour data. Spot bitcoin exchange-traded funds attracted $865.3 million across five consecutive positive sessions, absorbing approximately 13,300 BTC against only 3,150 BTC issued by the network.
However, Strategy’s sale of 1,638 BTC last week and the estimated 1.79 million BTC that is sitting on-chain at at $62,000-$65,000 cost basis, continue to provide substantial overhead supply pressure, helping explain why bitcoin’s price response remains modest. Ether funds also extended their positive inflow streak, indicating that institutional demand is returning but becoming more selective across crypto assets.
The macroeconomic catalyst for BTC has come from the latest July employment figures, showing a decline in US nonfarm payrolls, with previous months also revised lower, even as average job creation has slowed. Unemployment has also fallen to 4.1 percent because fewer people are participating in the workforce.
Low layoffs and falling jobless claims point to a labour market that is cooling rather than breaking, even as weakening wages, declining participation and narrowing hiring breadth confirm a clear loss of momentum.
Markets have responded by reducing the probability of a September interest rate increase to 43.9 percent, pulling short-term Treasury yields and the US dollar lower while supporting equities and cryptocurrencies. Long-term yields however have refused to follow, with the 30-year Treasury yield remaining above 5.2 percent as investors continued to price persistent inflation and heavy government borrowing. This divergence means that a September hold would represent patience rather than a pivot towards monetary easing.
Bitcoin remains supported, thanks to the current macro environment. A sustained breakout requires ETF demand to keep exceeding the overhead supply and an inflation print soft enough to let long-term yields fall. Until both arrive, we expect the range to hold.

Market Signals
One Bid Returns, The Other Reverses
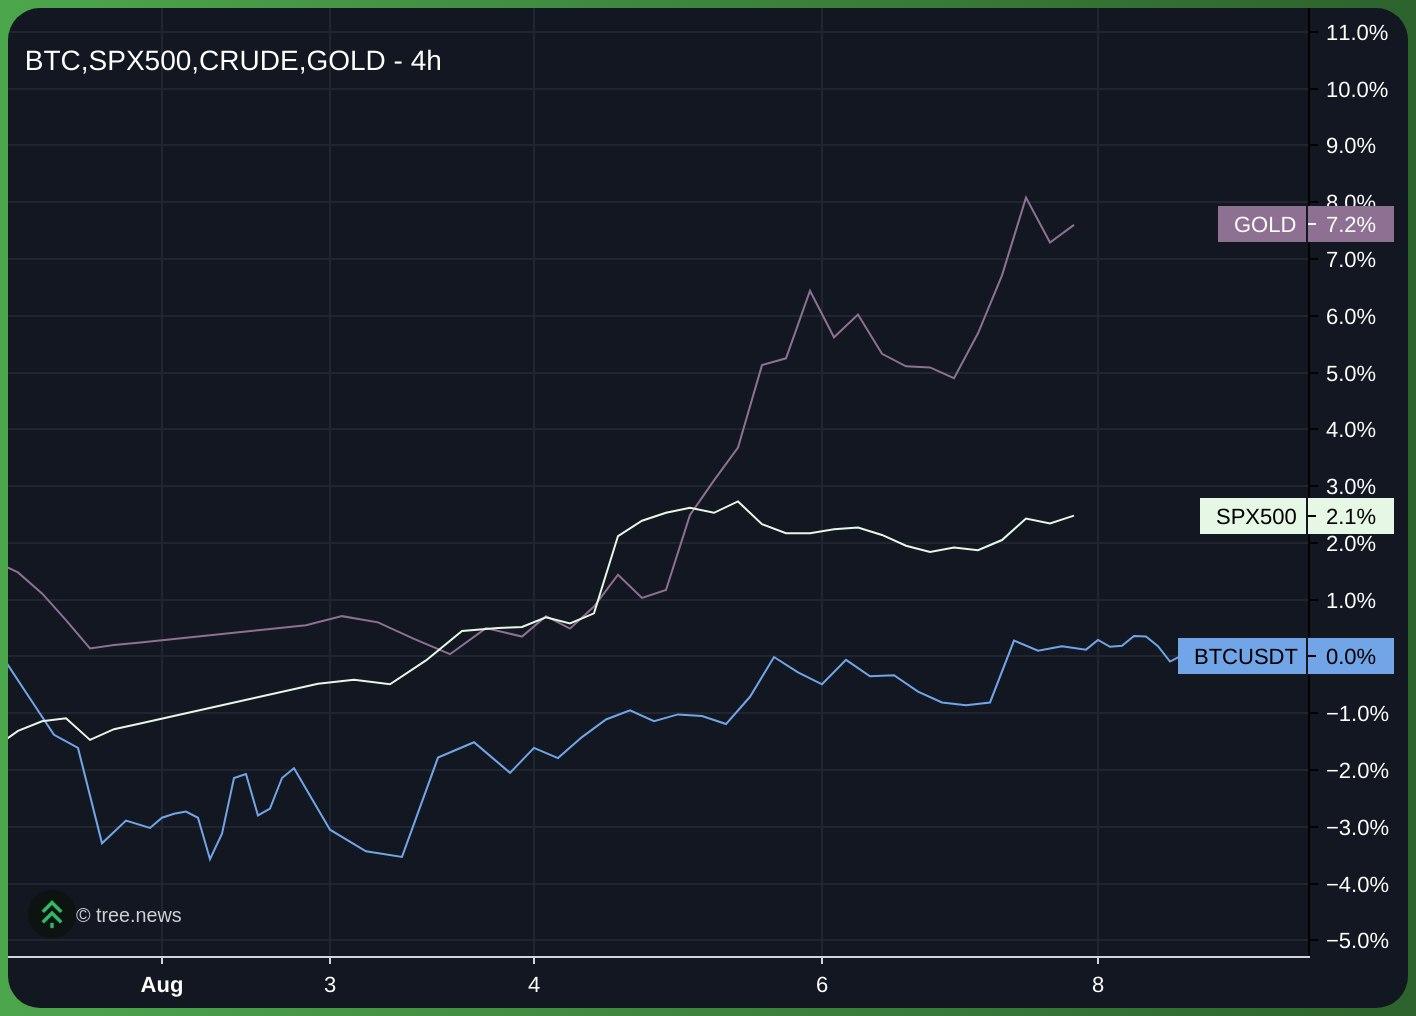
Bitcoin’s spot bid has returned but it’s split in two. ETFs delivered their strongest week since April while corporate treasury sell pressure continued. Bitcoin drifted from its $62,000 range lows towards $65,000 as favourable macro headlines pushed risk assets higher: the Euro Stoxx and the S&P 500 reached new highs on Middle East de-escalation and declining oil prices. The S&P 500 closed the week 3.58 percent higher while BTC closed 2.082 percent up. Gold mirrored the rally across risk assets, while crude gapped lower as the geopolitical risk premium faded.
Flows Split The Spot Bid In Two
The Exchange Traded Fund (ETF) complex netted $865.3 million over five consecutive green sessions last week, its strongest week since April. BlackRock’s IBIT took $693.5 million and Fidelity’s FBTC $116.5 million, collectively supplying 93.6 percent of the week’s demand, with the heaviest single day landing before the weaker July payrolls data was released, indicating that the bid built through the week rather than spiking on the event.
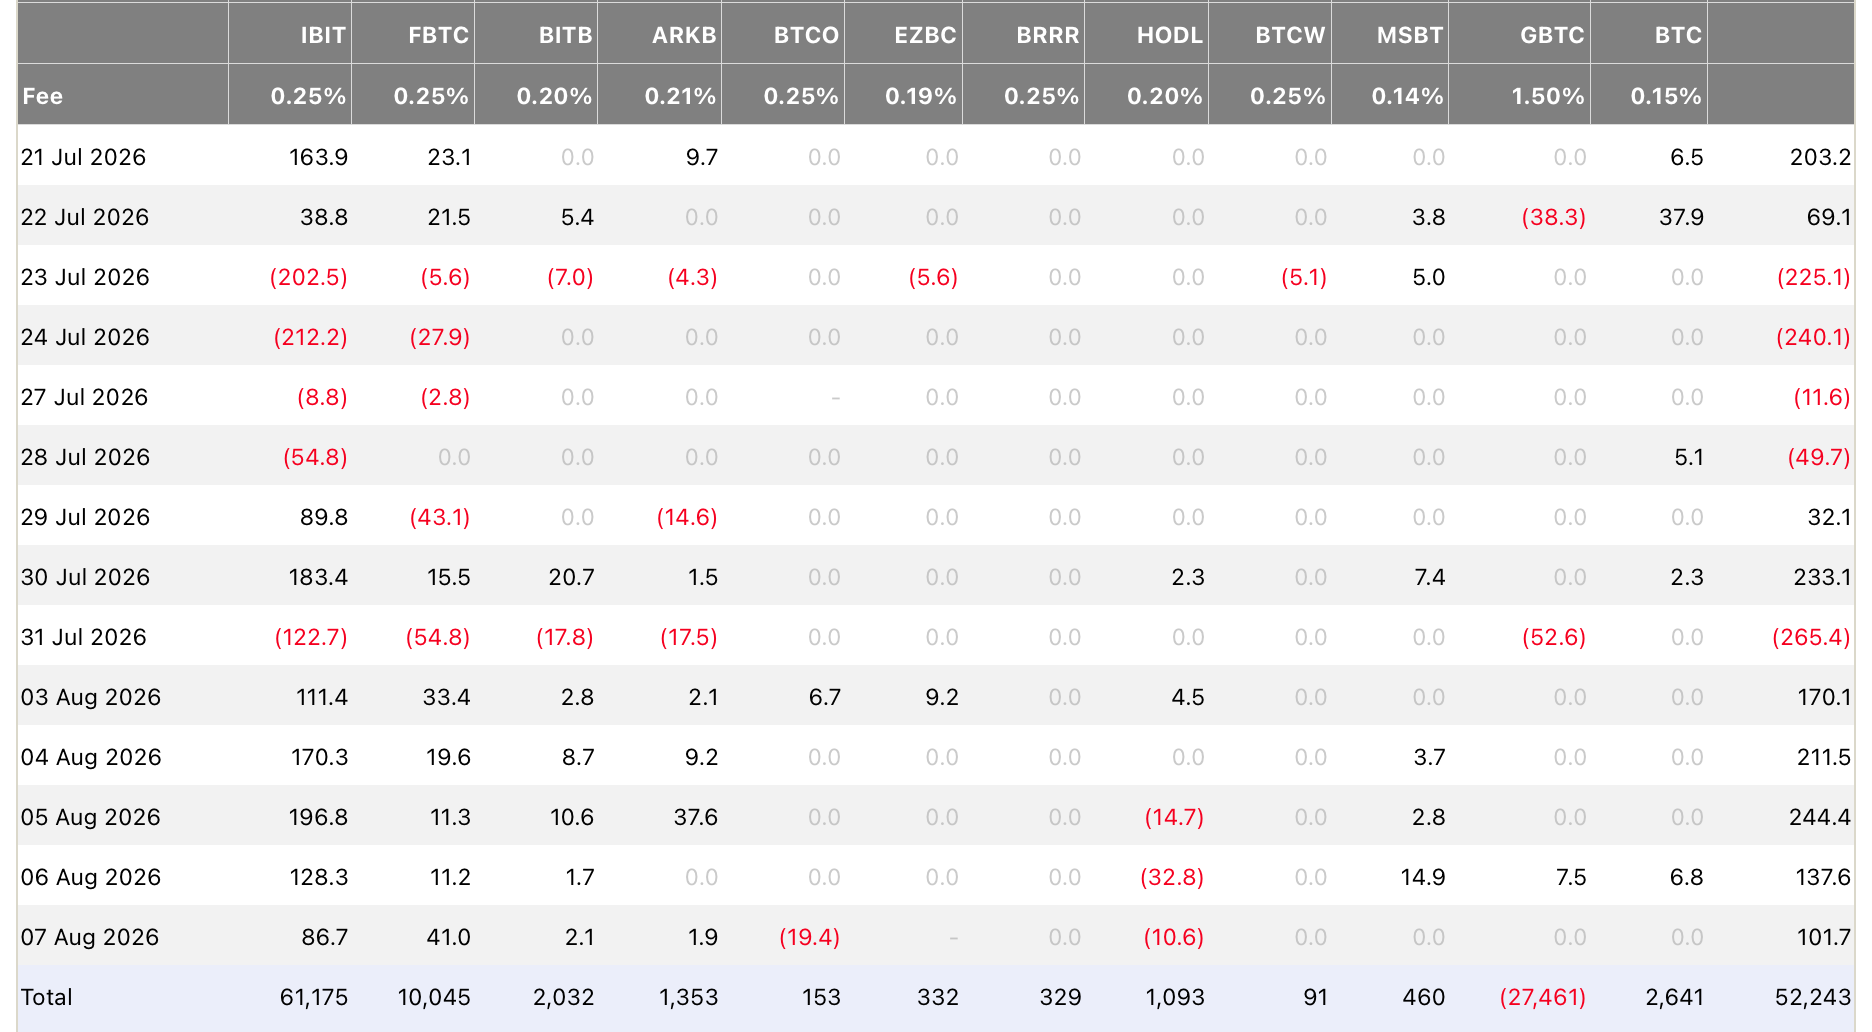
The flows represent absorption of approximately 13,300 BTC, more than four times the roughly 3,150 BTC the network issued over the same period.
The secondary market remains illiquid on very low spot volumes and follows a June where the ETF complex shed approximately 65,800 BTC, marking its most severe monthly outflow since BTC ETFs were launched in January 2024. The pivot from peak capital exodus to relatively strong demand within six weeks is the most notable trend shift in spot flows this year.
The two potentially price agnostic and aggressive demand engines we have consistently seen for bitcoin have been the ETF complex and the accumulation flows from Bitcoin Treasury companies, in particular Strategy. While last week’s inflow into ETFs suggests strong demand, BTC’s 2.08 percent price increase was relatively modest compared to broader risk assets.
This performance discrepancy can be explained by examining offsetting selling pressure from corporate treasury activity.
The marginal seller is no longer the bitcoin miner: it is the overhang from holders with a cost basis in the $62,000-$65,000 range, which amounts to 1.79 million BTC.That overhead sell pressure is exacerbated by Strategy, whose continued selling is also weighing on the market.
The landscape has shifted; the most potent source of depressed market sentiment is Strategy’s potential $5 billion liquidation authorisation, while ETF flows demonstrate heightened volatility. Meanwhile, the relative impact of miner sell-side activity has become negligible in the immediate term.
Strategy’s most recent 31 July 8-K filing revealed the liquidation of 1,638 BTC for $104.7 million, executed at a $63,957 average between 27 July and 2 August. This second week of selling reduced Strategy’s total holdings to 842,138 BTC held at a $75,419 average cost basis and directed capital toward preferred dividends and an $81.2 million repurchase of STRC at a 13 percent discount to par. We estimate that the total worth of BTC that Strategy is currently authorised to sell will eventually find its way into the market.
We identify these opposing forces as the primary influence on price action: strong institutional demand through ETFs set against the overhead supply and the corporate selling drawn from it.
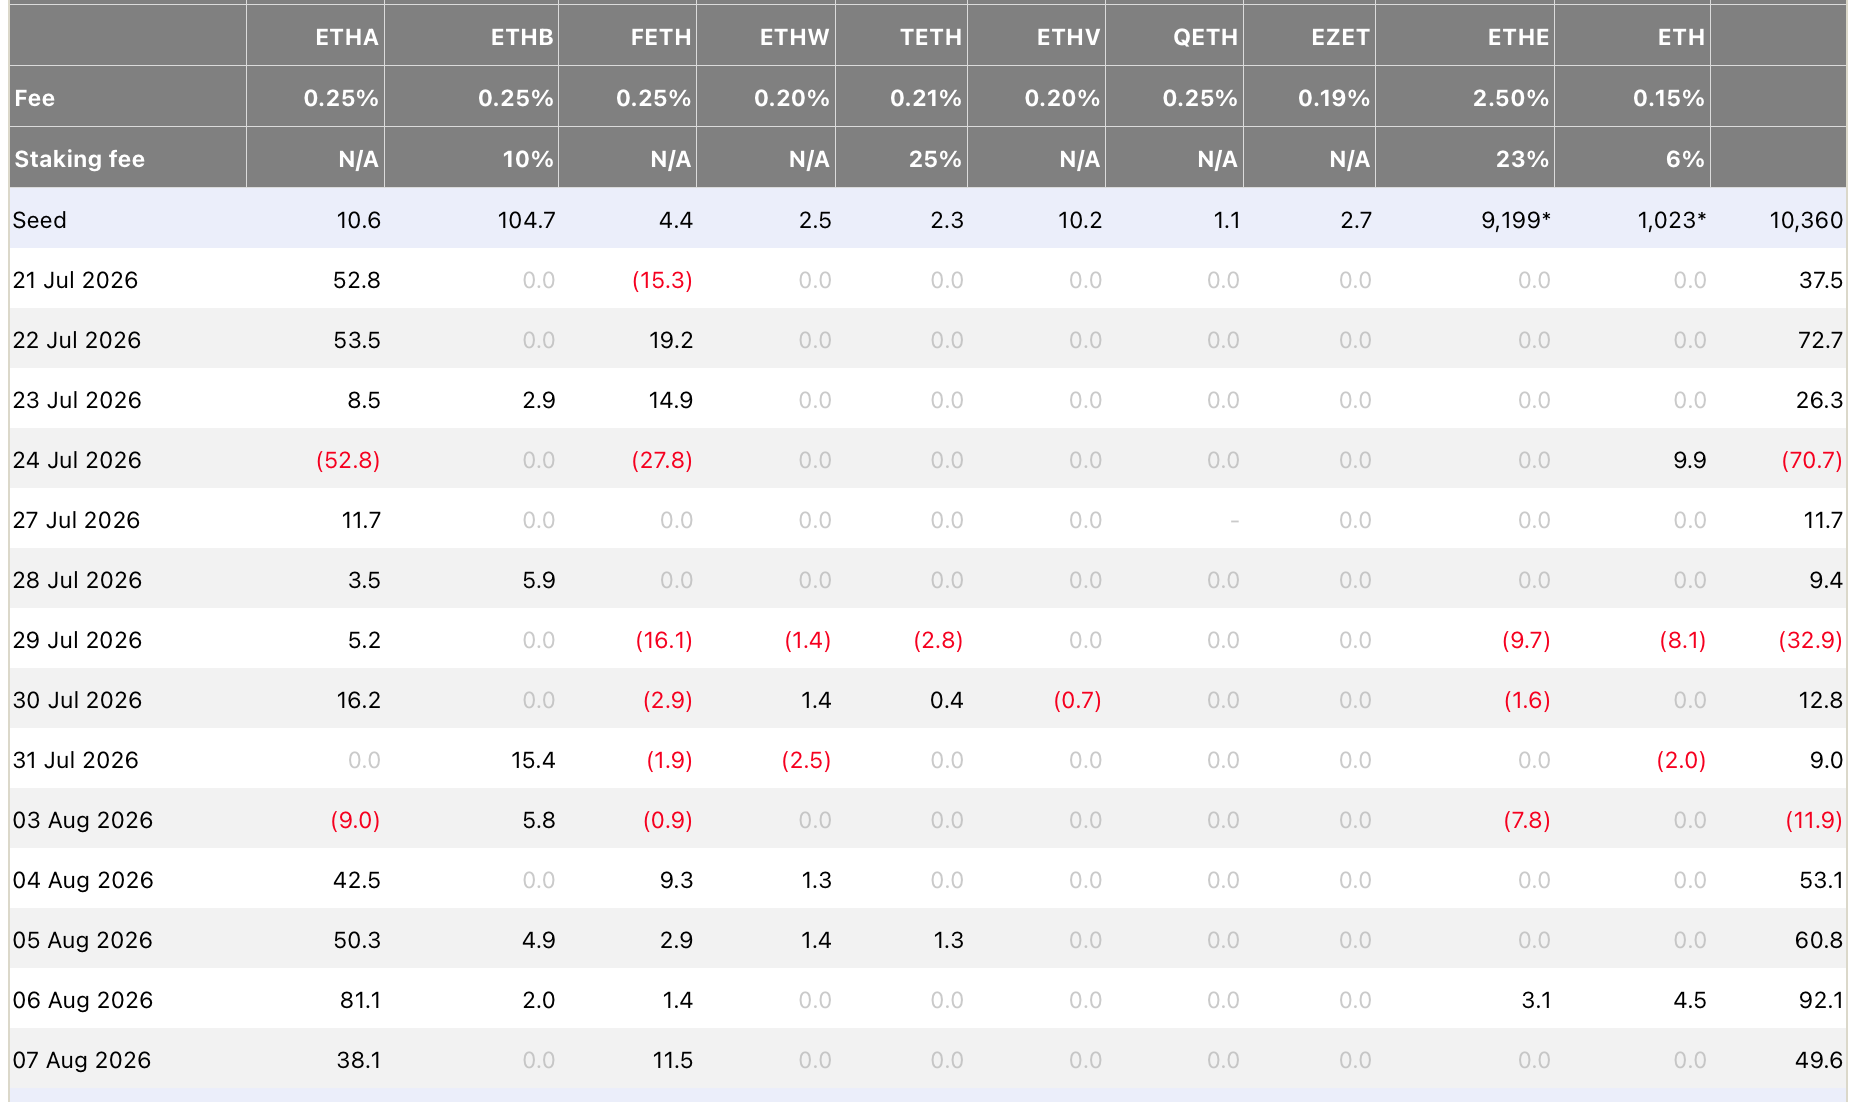
The returning capital is also selective. Ether ETFs secured $243.7 million last week, a fifth straight week of positive intake, and through July outpaced BTC funds $365.2 million to $172.4 million. This suggests that institutional demand is back, and it is choosing between crypto assets rather than buying the complex wholesale.

General Macro Update
A Smaller Workforce Complicates the Labour Market
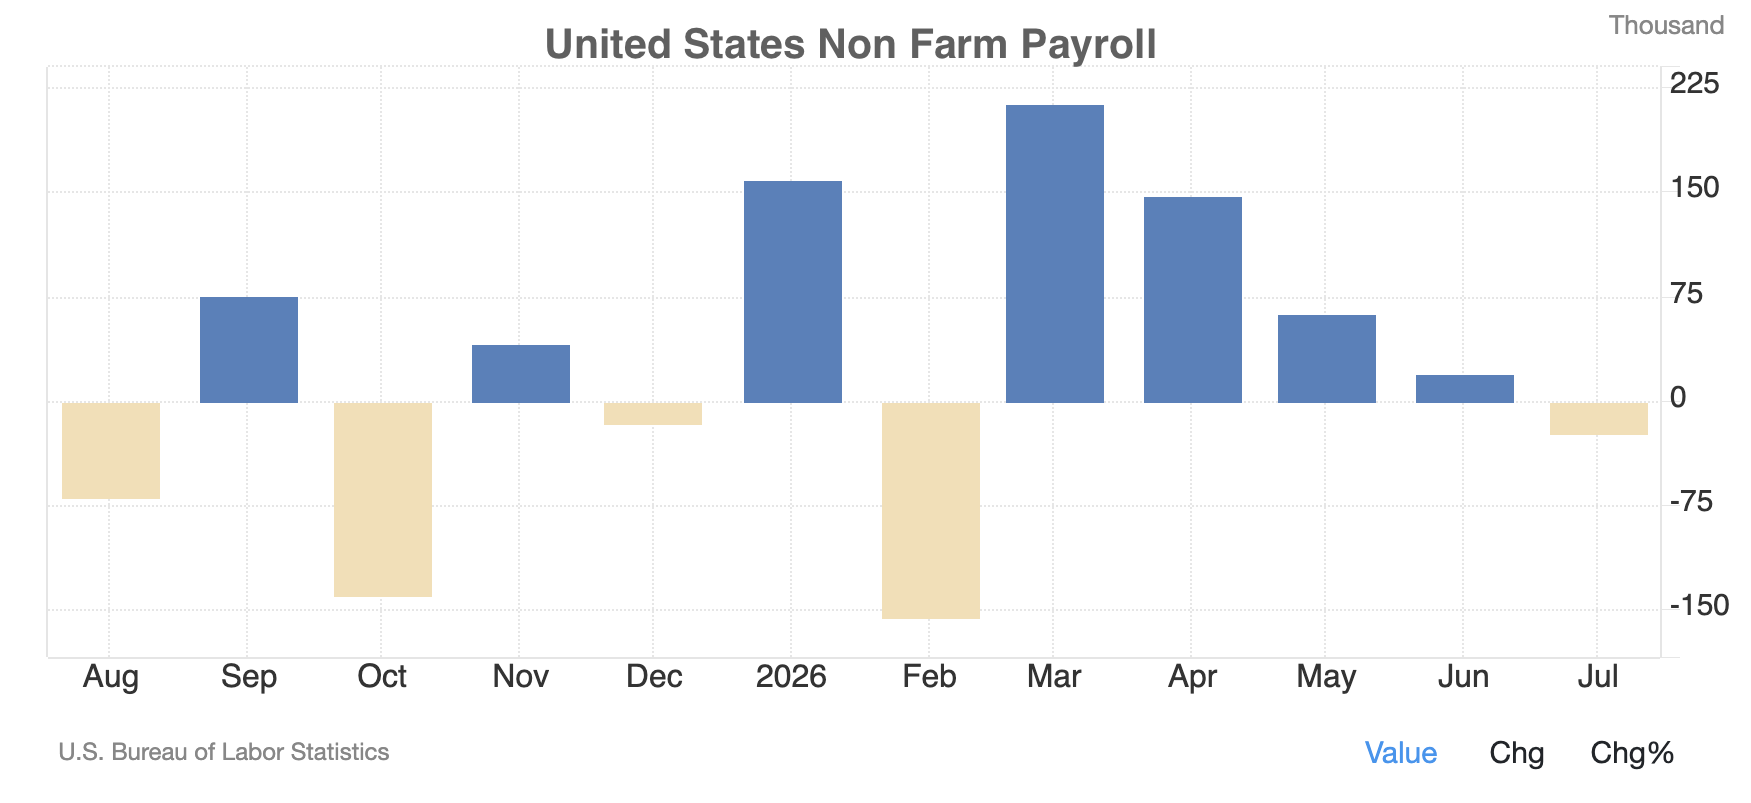
Nonfarm payroll employment fell by 23,000 in July and markets responded by pricing out a September rate increase. The figure appears weak but it masks the fact that the US workforce is shrinking, which has lowered the number of new jobs required to keep unemployment stable. The Federal Reserve must now determine whether weaker job growth reflects cooling demand for workers or simply a shrinking supply of available labour.
The Employment Situation report for July 2026, painted a picture of weakness across the labour market. Payrolls fell against expectations for a gain of roughly 70,000-80,000 jobs, while May and June growth was also revised down by a combined 103,000, and the average monthly gain over the past three months now stands at just 20,000 jobs. The unemployment rate fell to 4.1 percent, but this was not a sign of strength: it declined because fewer people were looking for work, not because more people found jobs.
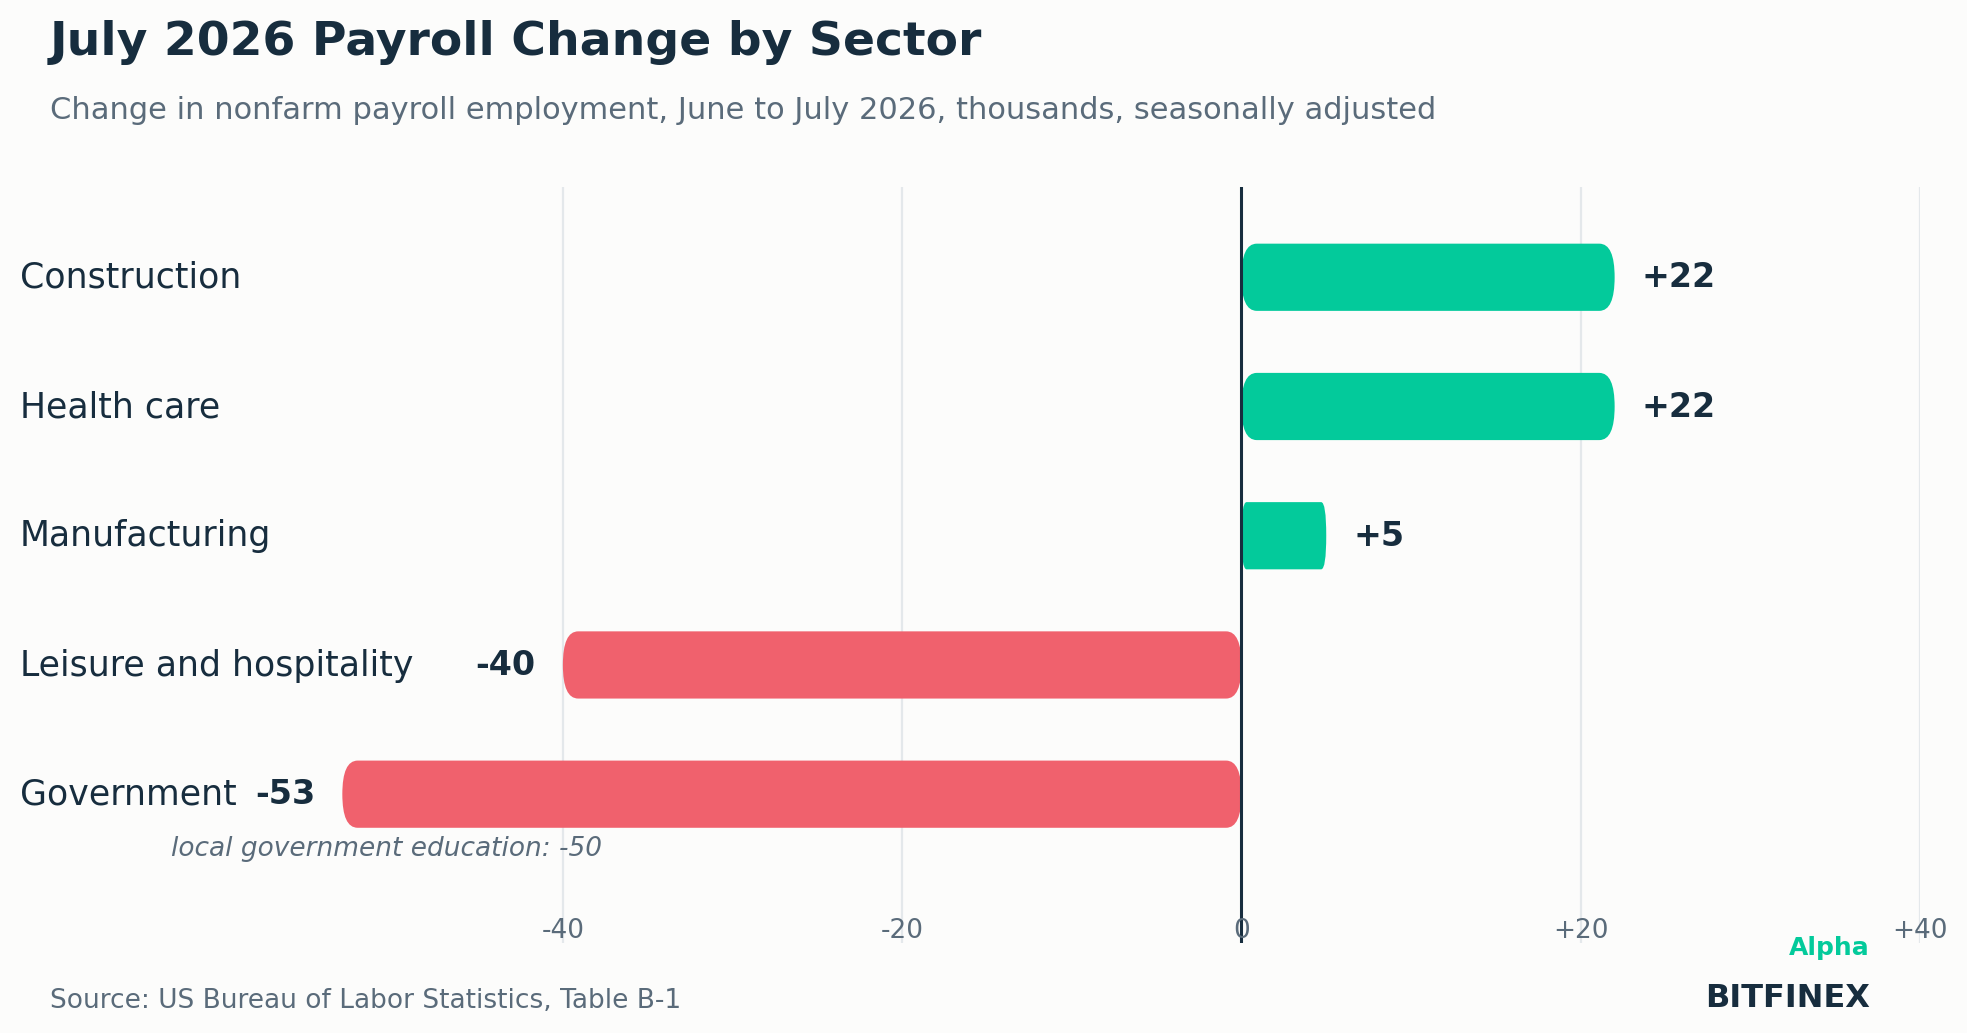
The report tested the low-hire, low-fire pattern we have tracked since March, and certainly the low-fire half held: the June Job Openings and Labor Turnover Survey (JOLTS) showed layoffs still low and quits steady, and initial jobless claims were 199,000 in the week ending 1 August, still below 200,000. The low-hire half however, deteriorated. Private payrolls rose just 30,000, government employment fell by 53,000 on local education cuts, and leisure and hospitality lost 40,000 positions.
Job creation is also narrowing to a handful of sectors. Healthcare added 22,000 positions on demand from an ageing population that does not fade when growth slows, and construction added 22,000, supported in part by investment in artificial intelligence infrastructure. Beyond those pockets, breadth is thinning: the share of manufacturing industries adding jobs fell to 50 percent from 56.9 percent in June, and the private-sector diffusion index fell to 51.8, indicating that jobs being added were only marginally greater than jobs being cut.

The labour force contracted in July, and the labour force participation rate, the share of working-age people who either have a job or are actively looking for one, stood at 61.4 percent, down 0.7 percentage points since January.
A person who stops looking for work is no longer counted as unemployed, so the headline rate can fall even as underlying conditions soften.
The shrinking workforce is structural. An ageing population is reducing the pool of available workers, while tighter immigration policy is limiting the other main source of labour-force growth. This is why estimates of the break-even employment rate, the number of new jobs needed each month to absorb workforce growth, have fallen sharply: the Federal Reserve Bank of St. Louis puts 2026 break-even growth between roughly 15,000 and 87,000 jobs per month being added, depending on immigration flows, while the Federal Reserve Bank of Dallas estimates it fell to near zero around the turn of the year. Payroll growth can therefore look weak by historical standards without pushing unemployment up, because the supply of workers is slowing alongside demand for them.
Wage Growth Is Cooling But The Cost Of Living Remains High
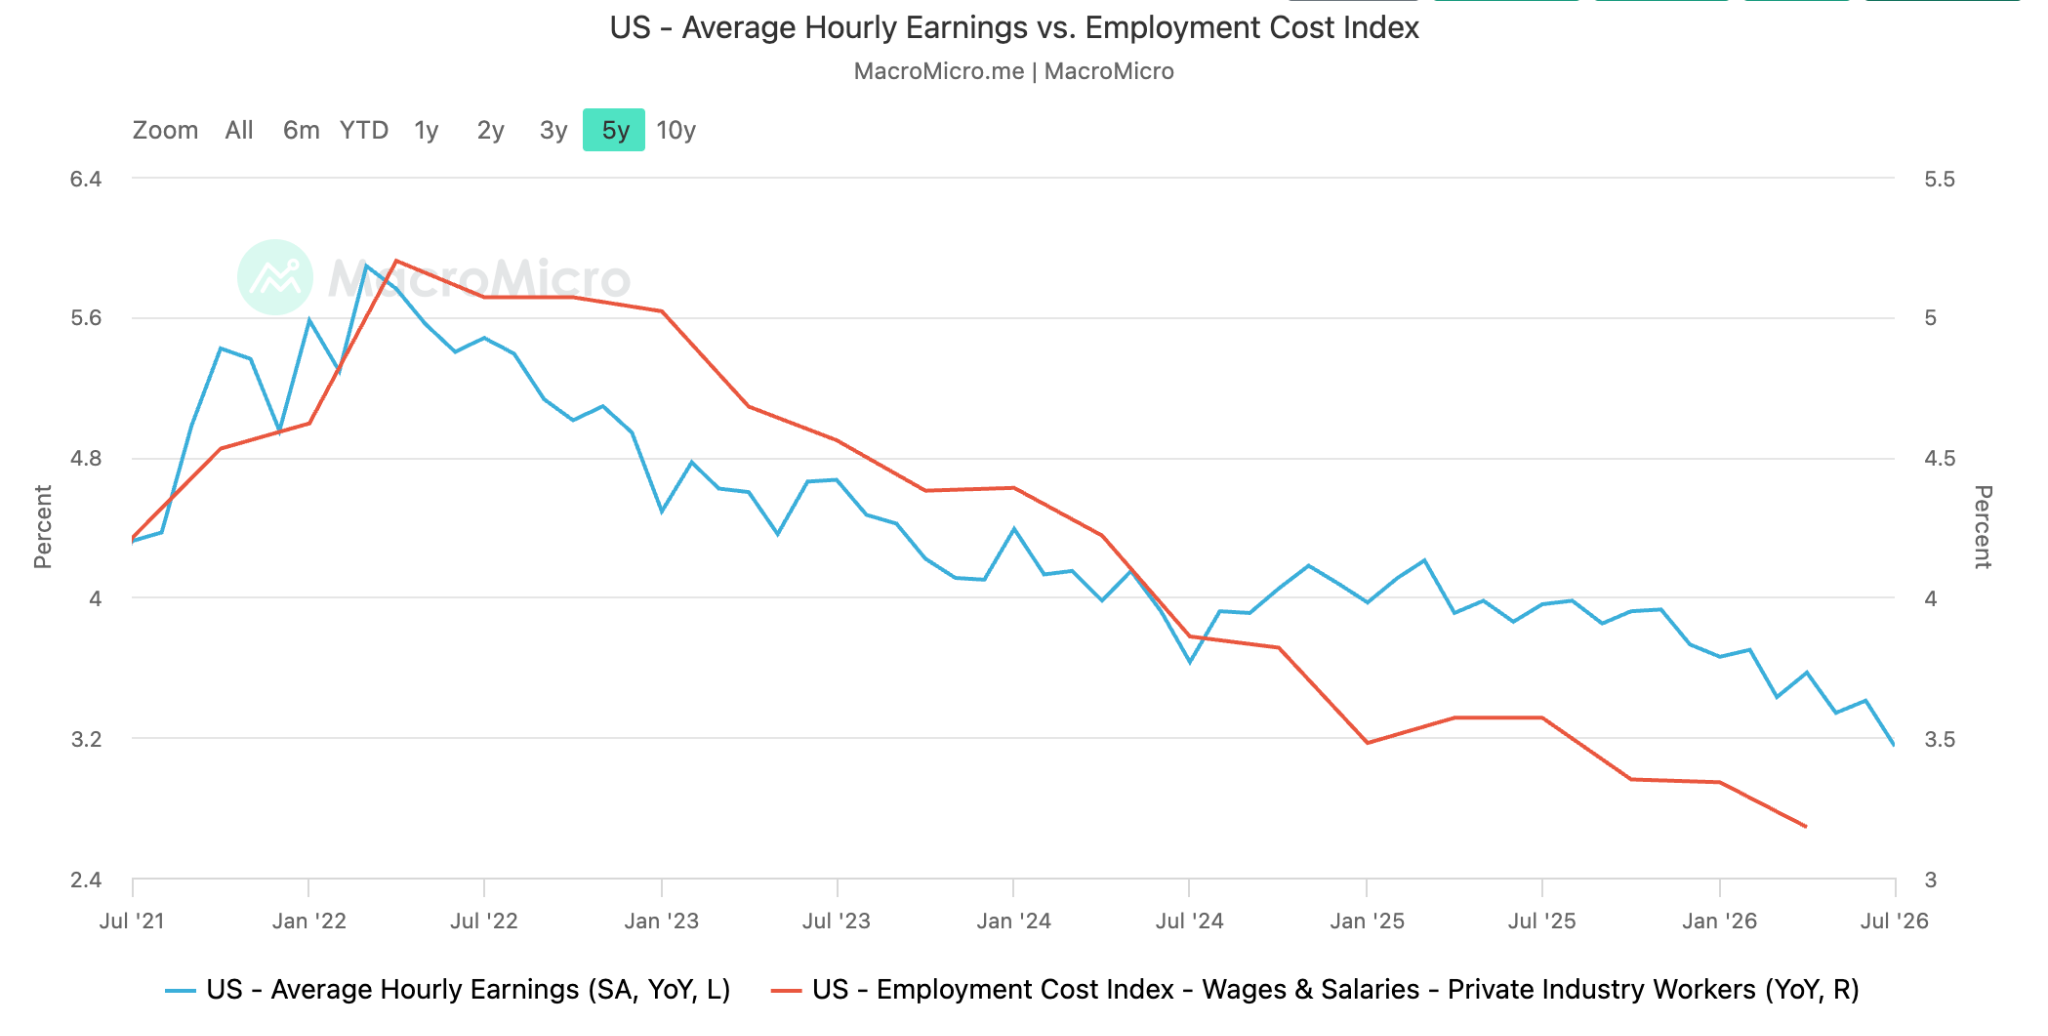
Wages confirm the cooling. Average hourly earnings rose 3.2 percent from a year earlier in July, down from 3.5 percent in June, and the broader Employment Cost Index (ECI) showed total compensation up 3.4 percent over the year to June.
Slower wage growth removes one source of inflation pressure, but it does not solve the problem for households: prices remain elevated after the tariff-driven repricing of goods and the 2026 energy shock, and inflation-adjusted private-sector wages fell 0.4 percent over the year to June. Pay is rising more slowly while essential costs stay high.
Employers face the same squeeze from the other side. A smaller labour pool makes suitable workers harder to find in shortage sectors, while artificial intelligence and other
productivity investment reduces the labour required for some tasks. The result is likely to be an uneven employment market rather than a clean economy-wide shortage or surplus of workers.
The Signal For September
For the Fed, the drop in employment cuts two ways. It weakens the immediate case for tightening, with futures markets putting the probability of a rates increase at the 15-16 September meeting at 43,9 percent. But because part of the payroll slowdown reflects shrinking labour supply rather than collapsing demand, the Fed cannot take the weak headline at face value, and inflation that has not returned to target still argues against easing.
The labour market is not simply strong or weak: it is narrower, slower and more supply-constrained. This makes the unemployment rate less informative on its own and puts more weight on wages, participation and hiring breadth.
What settles the September question is the next inflation reading. We expect the Fed to hold, reading the weaker labour market as a reason to wait rather than as an acceptable price for finishing the inflation fight. July consumer price data released on 12 August , is what would change that.

A September Hike is Unlikely, But Long Bond Yields Remain High
The July employment report did in one morning what three weeks of Federal Reserve communication could not: it moved markets off a September rate increase. But the more telling reaction came from the long end of the Treasury curve, which barely moved. Investors have become less concerned about the next meeting, but continue to worry about levels of inflation and debt supply on a 10-year view, and that split perspective is the story in the bond market.
The Front End Reprices The Fed
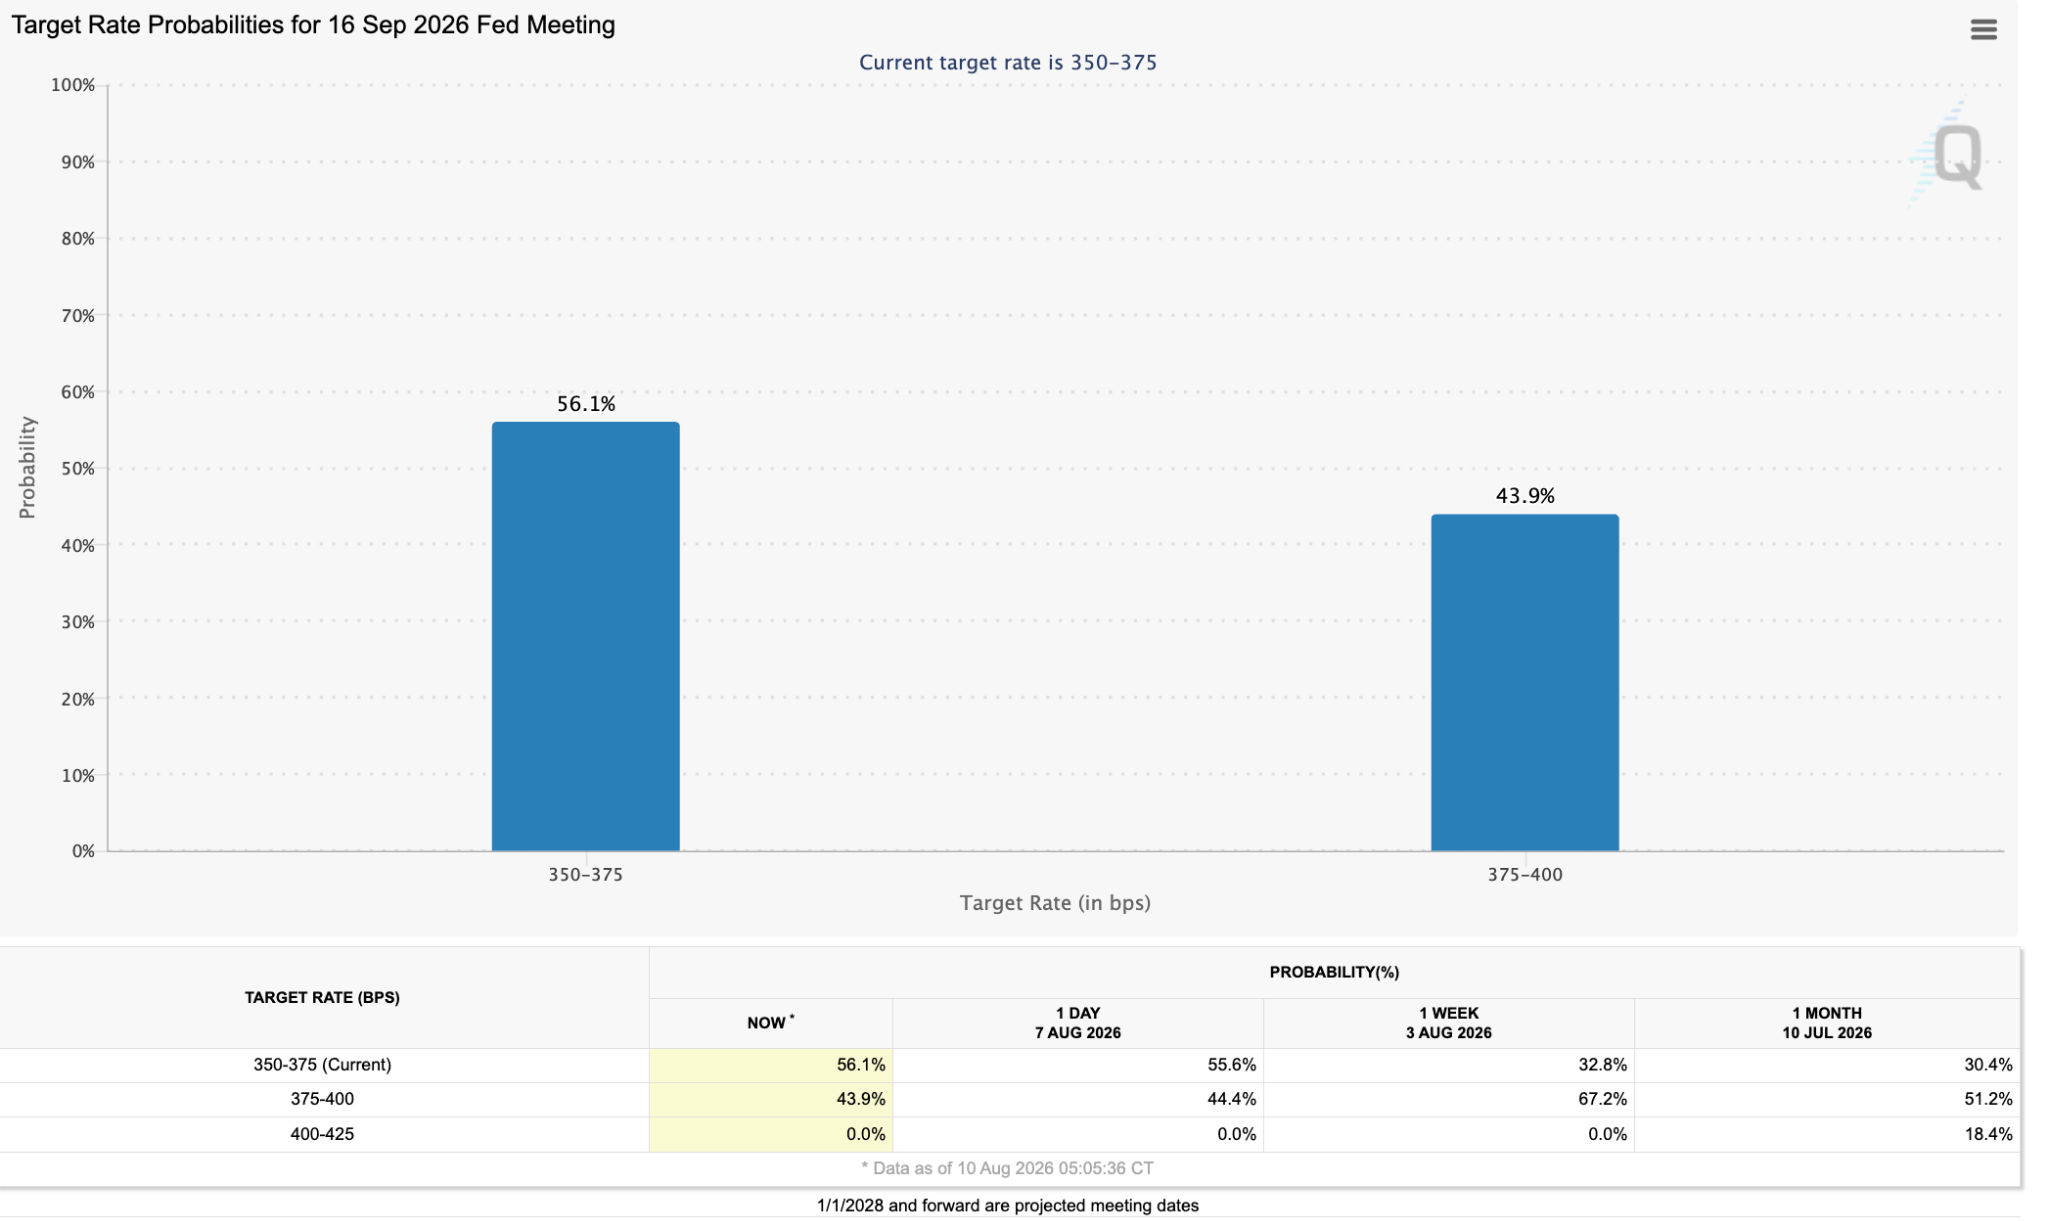
Rate expectations swung within minutes of the release. CME FedWatch put the probability of an increase at the 15-16 September meeting at 43.9 percent after the report, down from 57 percent immediately before the release and from around 67.2 percent last week. For the first time since the July meeting, a September increase is priced as less likely than not. That validates the position presented in Bitfinex Alpha, issue 216, when we argued the Fed would hold through year-end even as markets leaned the other way.
The 2-Year Treasury yield, the maturity most sensitive to policy expectations, told the same story. It had already eased from 4.28 percent on 31 July to 4.21 percent on 10 August as the week’s softer data accumulated, and it fell further after the payrolls release. The US dollar weakened alongside it.
The repricing travelled quickly down the chain into equities. The companies that suffer most from high interest rates gained the most on 7 August: the Russell 2000 rose 1.1 percent and the Nasdaq Composite 1.3 percent, against 0.6 percent for the S&P 500 and 0.3 percent for the Dow Jones Industrial Average. Smaller companies borrow more at floating rates, so their interest costs fall as soon as the market decides the Fed will not raise rates again. The burden of proof has now shifted. With labour data arguing for patience and the equity market already positioned for a hold, only a strong July inflation print on 12 August can put the September increase back on the table.
The Long End Keeps Its Own Counsel
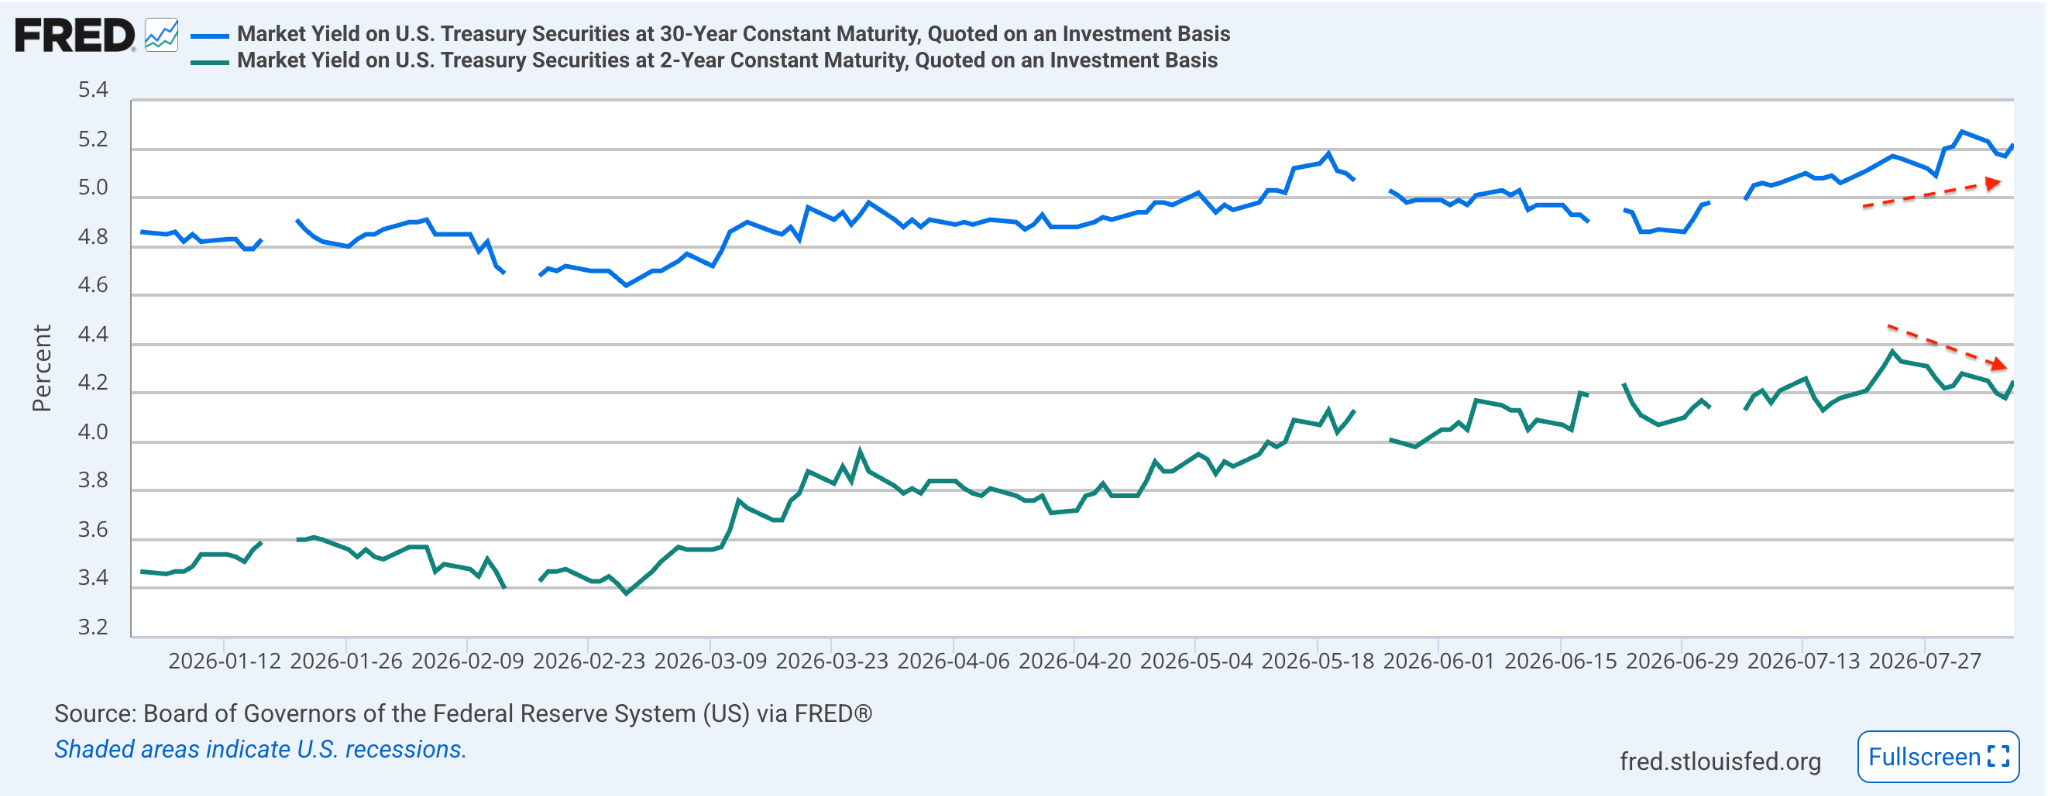
Long maturities sent a different message. The 30-year Treasury yield ended July at 5.27 percent, its highest since 2007, and still stood at 5.20 percent on 10 August. The gap between 2-year and 30-year yields has widened to around a full percentage point, extending the twist we described last week, when short yields fell after the Fed’s July meeting while long yields rose
Two forces are holding the long end up. The first is inflation: the July Fed policy statement reiterated that inflation “remains elevated” relative to its 2 percent goal, reflecting the energy supply shocks. The result is that anyone lending for 30 years wants a higher yield as insurance against inflation staying that way. The second force keeping long bond yields high, is that the Treasury is borrowing heavily, so investors are being asked to buy more long-dated debt at exactly the moment they are least confident about inflation, and the market is indicating that they will only do so at higher yields.
Long-end investors are looking past the Fed’s next move to price doubt that the inflation era is over. The practical consequence is that the borrowing costs that matter most for mortgages and corporate investment stay high even as hike odds fade. A hold is not the same as easing.
A September hold should not be read as a pivot, either. Three committee members dissented in July in favour of an increase and the Jackson Hole symposium on 27-29 August is the next scheduled opportunity for Chair Kevin Warsh to describe how the Fed
will weigh a cooling labour market against inflation that has not returned to target. The most likely path into September is a narrowing one: the hike is being priced out, but easing is not being priced in. If front-end odds keep falling while the 30-year yield holds above 5 percent, the divergence between the Fed’s patience and the bond market’s doubt will keep widening, and that divergence will set the tone for risk assets into the autumn.
Why This Matters for Crypto This week’s data reaches crypto through three connected steps: what markets now expect from the Fed, what that does to the dollar, and how easily money can flow into riskier investments. Softer hiring cut the market-implied chance of a September rate increase to 43.9 percent and pushed the dollar lower, and both have supported bitcoin in past cycles.
The more durable support is the availability of credit. The Chicago Fed’s National Financial Conditions Index stood at -0.53 in the week ending 31 July, meaning credit was easier to obtain than the historical average even after a year of higher interest rates. That matters more than the policy rate itself, because it measures whether money is actually reaching riskier assets. A labour market that cools without tipping into recession keeps that credit available, which is the better of the two outcomes for bitcoin.
Long-term yields are the caveat. The 30-year Treasury yield is still near two-decade highs, and long-term rates are what investors use to value assets whose payoff lies far in the future, bitcoin among them. Short-term yields falling on their own delivers only half the benefit.
Our view is that the support under bitcoin is real, but it does not come from demand for crypto itself. It comes from three macro conditions: falling expectations for rates, a weaker dollar, and credit that remains easy to obtain. That means the support lasts only as long as those three conditions do, and we expect them to hold through September.
What Would Prove This Wrong Our read: the labour market is cooling but the economy remains resilient; the Fed holds through year-end; and long-end yields ease only when inflation falls.
These observable developments however would overturn this view:
A rate increase at the 15-16 September Federal Open Market Committee (FOMC) meeting, or market-implied odds of a September increase sustained back above 60 percent on CME FedWatch (43.9 percent on 10 August).
Initial jobless claims above 230,000 for two consecutive weekly prints (199,000 in the week ending 1 August).
Private payrolls turning negative for two consecutive months alongside a rising unemployment rate, which would mark the shift from low hiring to active firing.
The 30-year Treasury yield rising above its July peak of 5.27 percent even as hike odds fall, which would signal the long end is pricing fiscal risk rather than Fed policy and would undercut the view that a hold eases financial conditions.
