

Issue #218:
Late Stage Bear Market Signals?
Equities Take The Rally, Crypto Waits On Liquidity
Bitcoin remains caught in a narrow range as volatility, trading activity and liquidity compress to levels associated with late-stage bear market conditions. BTC continues to hold near the Median Realised Price at $63,200, while $67,176 remains the key level for restoring profitability among short-term holders. However, demand has weakened: US spot bitcoin Exchange Traded Funds (ETFs) recorded around $385 million in weekly net outflows, corporate treasury activity also turned negative, spot volumes have fallen towards multi-year lows and Bitcoin transfer velocity has reached a seven-year low. In such a thin market, relatively small changes in flows could produce an outsized move in either direction.
The macro backdrop has meanwhile become more supportive. Softer July consumer and producer inflation reduced expectations for another Federal Reserve rate increase, pushed short-term Treasury yields lower and helped the S&P 500 reach record highs. Yet the details remain less benign than the headline data suggest. Falling energy prices accounted for much of the inflation relief, while services remained firm and rising costs across computing hardware and artificial intelligence infrastructure introduced a separate source of supply-driven inflation. At the same time, weaker retail activity, falling real earnings and deteriorating consumer sentiment point to growing pressure on household demand.
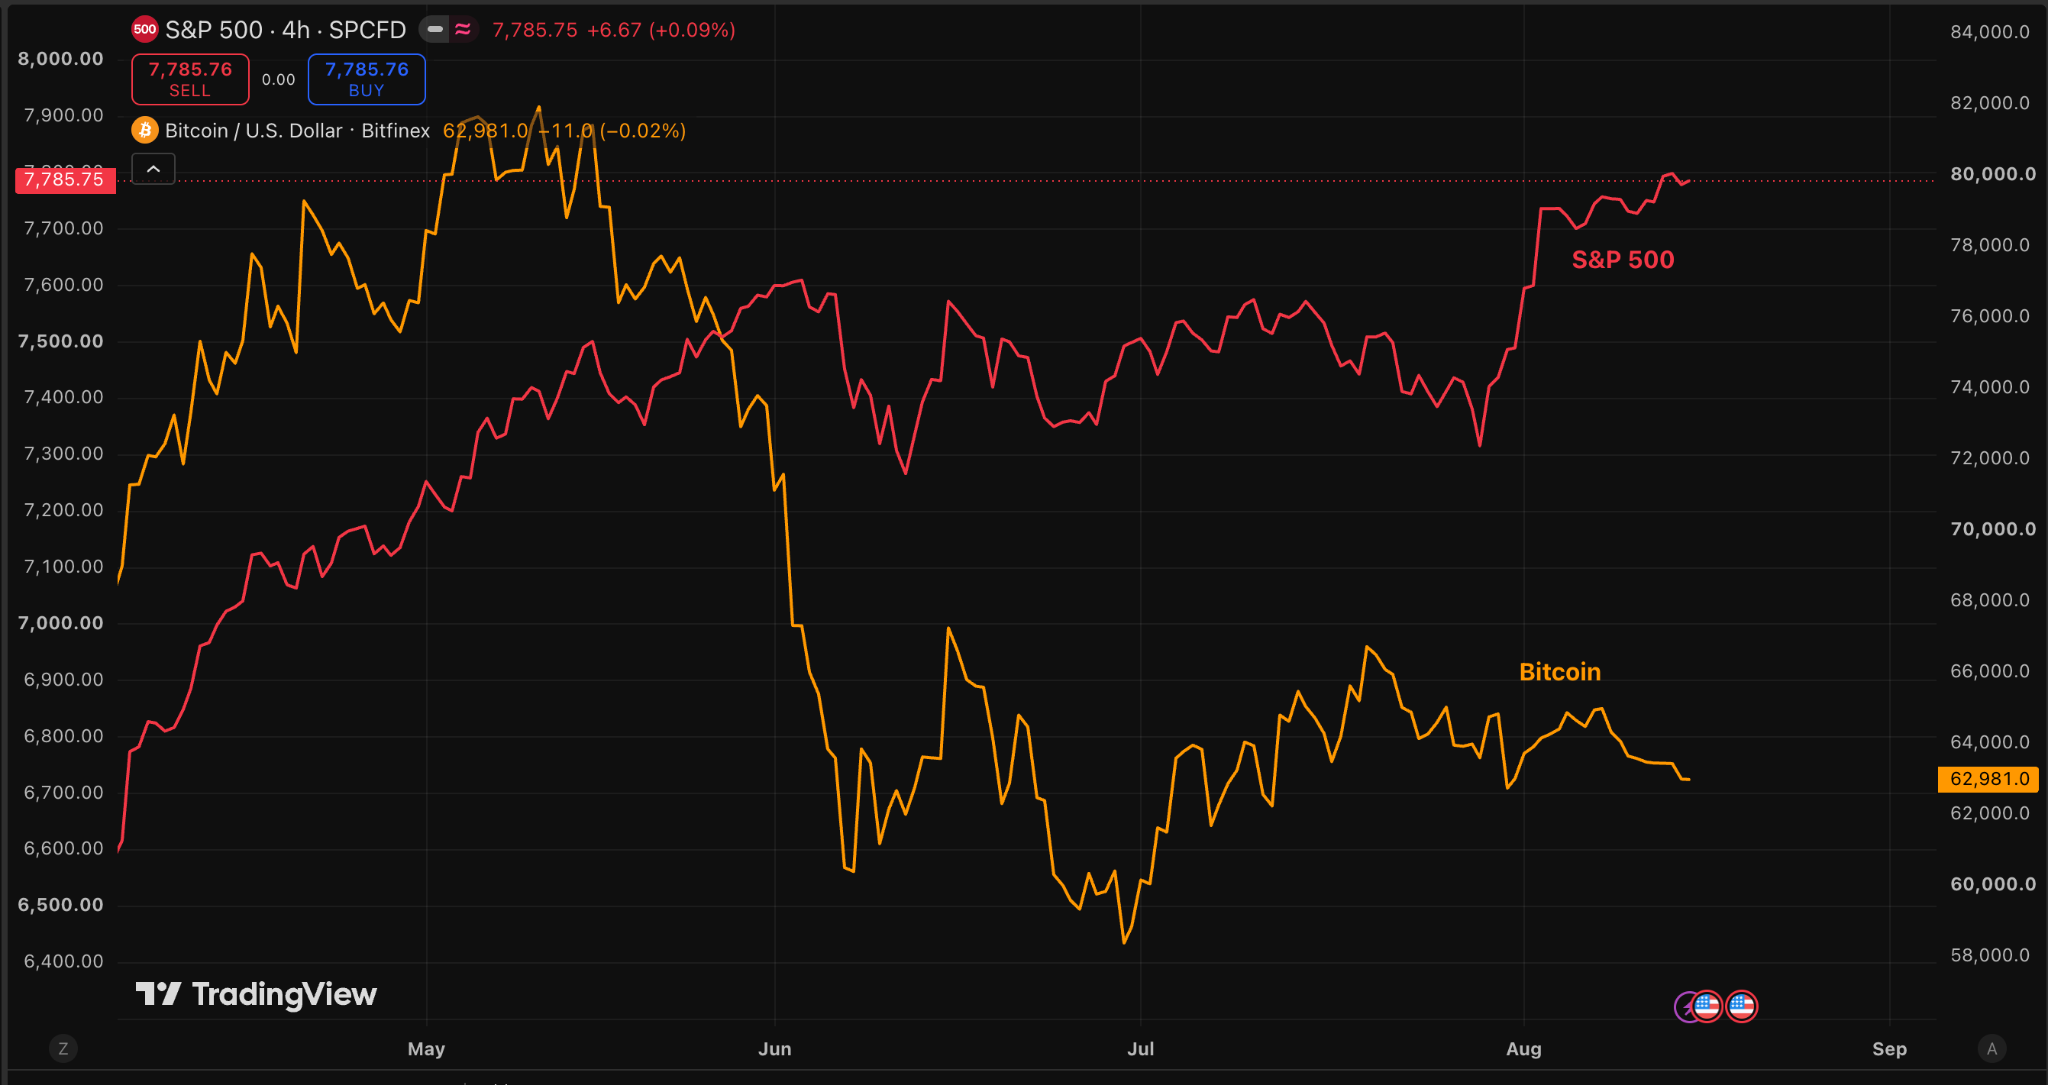
The key divergence is that easier financial conditions have lifted traditional risk assets without generating a comparable response in crypto. Lower expected rates and already-loose financial conditions represent two of the three conditions that would normally support digital assets. The final transmission into crypto liquidity, however, has not occurred. Stablecoin supply has declined from its May peak, while spot bitcoin ETFs experienced net outflows during the same week that equities reached new highs. This suggests that markets are pricing future liquidity, while crypto continues to depend on capital that has yet to arrive on-chain.
The central question is therefore shifting from whether monetary conditions are improving to whether that improvement begins producing actual crypto inflows. A return to sustained spot bitcoin ETF inflows alongside expanding stablecoin supply would indicate that the transmission mechanism has reconnected and could provide the catalyst for Bitcoin to break from its prolonged volatility compression. Until then, the macro environment is increasingly constructive, but the crypto rally remains unfunded. With participation exceptionally low and BTC continuing to defend key realised-price support, the eventual return of liquidity could produce a sharp volatility expansion, with the current market structure favouring an upside resolution if demand begins to recover.

Market Signals
Late Bear Market Signals
Bitcoin is currently stalled between higher timeframe support and levels whilst volume and liquidity remain unusually low, marking the quietest tape since 2019.
A higher timeframe stalemate exists between the bear market floor (Overall Realised Price at $52,699) and the Short-Term Holder Realised at $67,176, signalling the mid-timeframe trend. The Median Realised Price, reflecting the average realised price across holders who have moved coins, currently sits at $63,200. This has acted as consistent support over the past two weeks.
The last week was the first negative week in three for BTC, accompanied by net negative ETF flows. Situations combining low liquidity, reduced volume and stalling price action typically precede late bear market conditions.
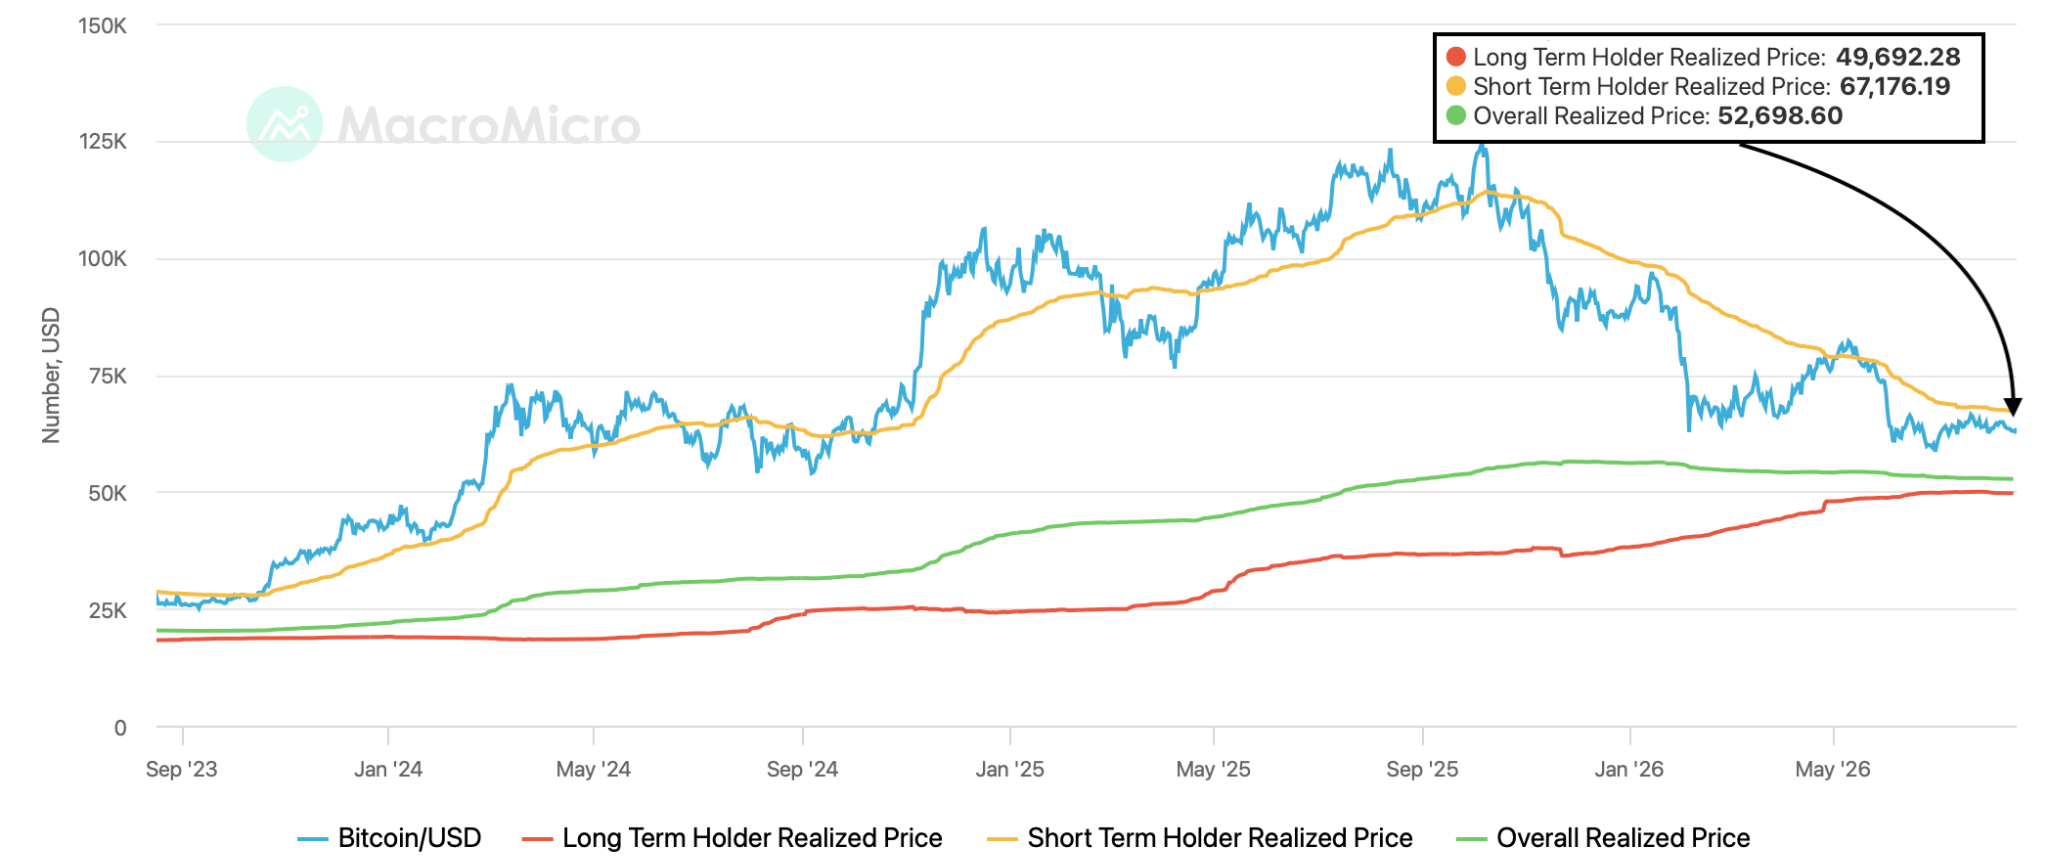
BTC has remained in this narrow range for nearly a quarter as volatility continues to contract, forcing primary trend boundaries to converge. The broad market remains supported by the Aggregate Realised Price at $52,699, suggesting the longer-term holder base has avoided underwater positions. Reclaiming the $67,176 level would restore profitability for recent buyers and test overhead resistance. Breaking below the median level risks a retest of the June lows and bear market lows at $57,803.
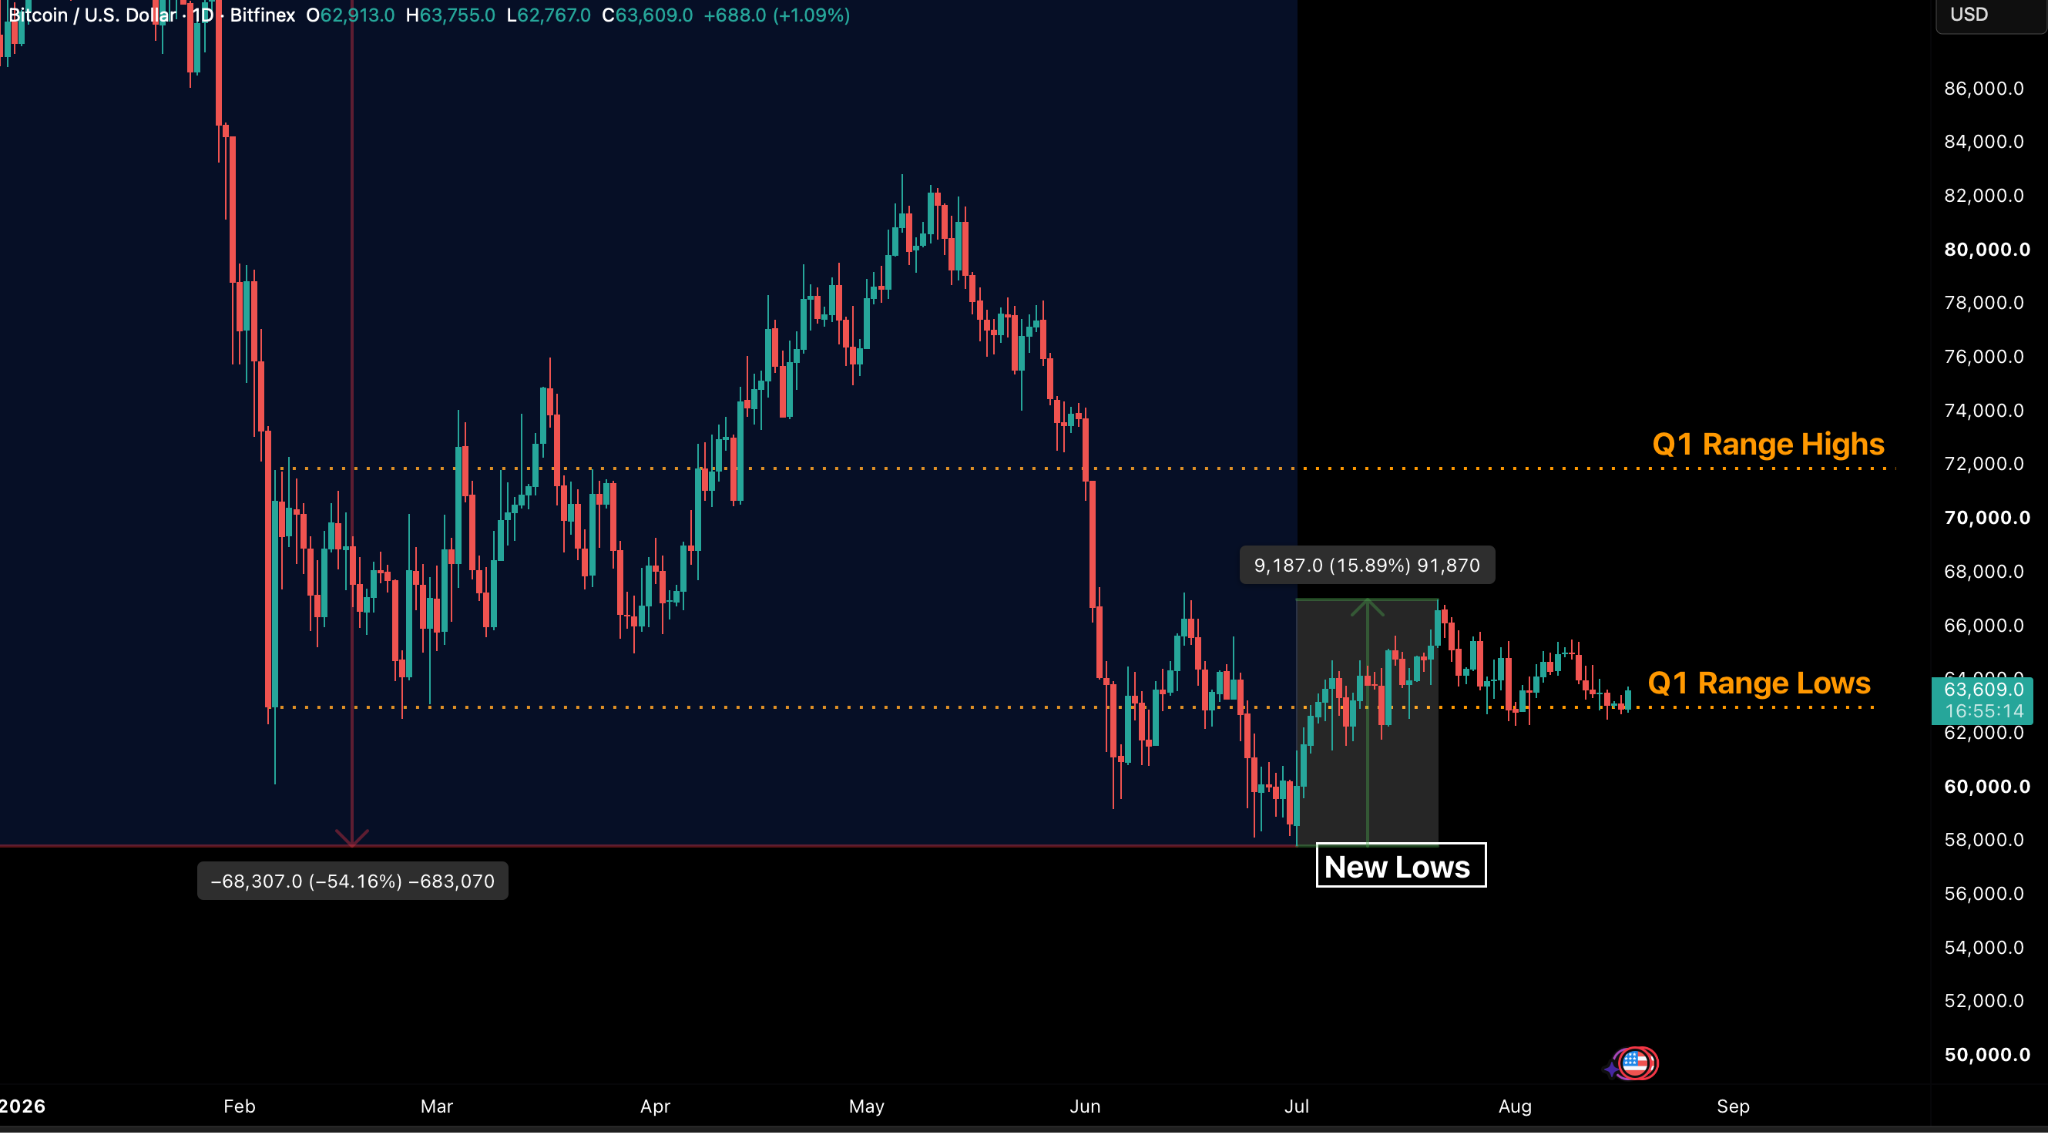
BTC closed the week down 3.1 percent at $62,921. The macro backdrop turned favourable that very week. Inflation cooled, producer prices stayed flat and weakening consumer demand pushed the September rate hike probability below 50 percent for the first time in 22 days. Bitcoin failed to capitalise on the shift.
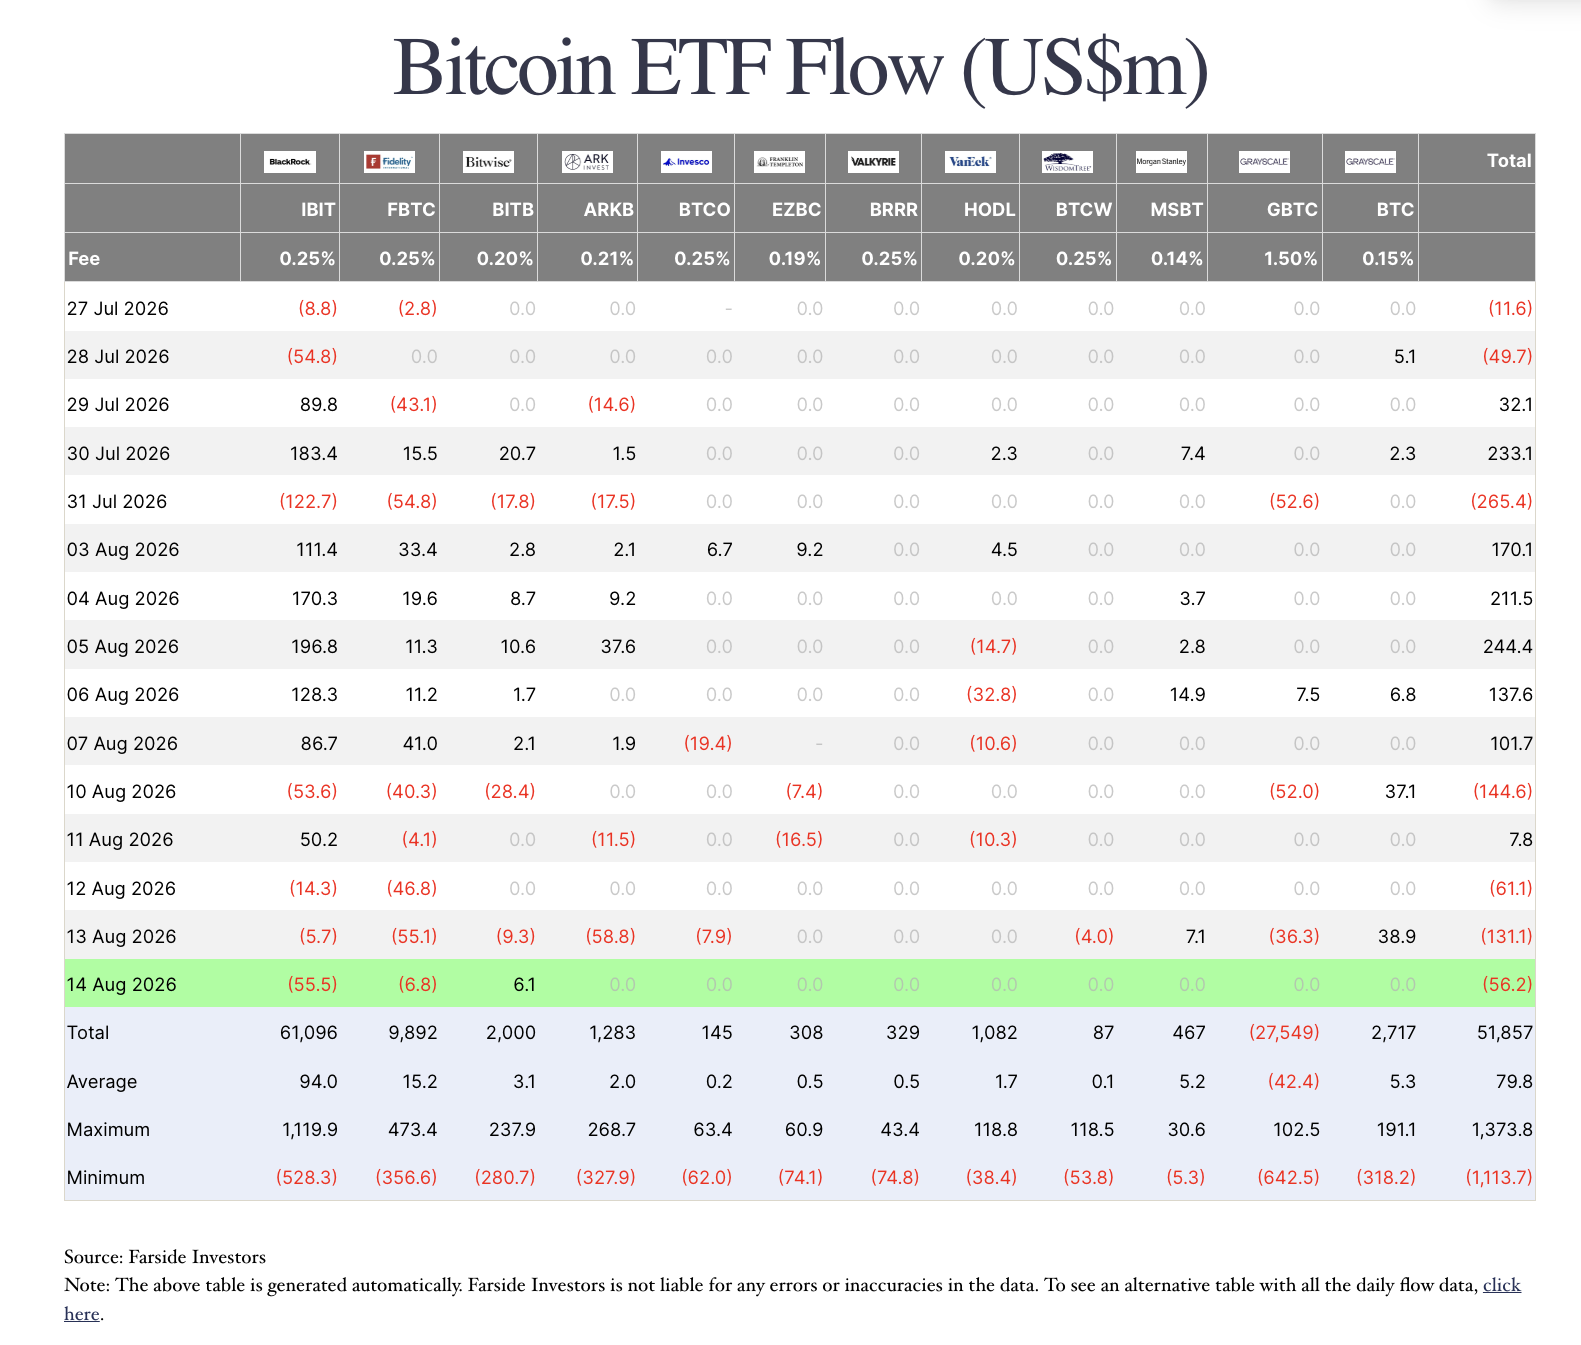
Demand-side exhaustion was the culprit. US spot ETFs saw their first net-negative week in three, shedding $385.2 million in total, while Strategy added to the selling pressure with a third consecutive weekly divestment.
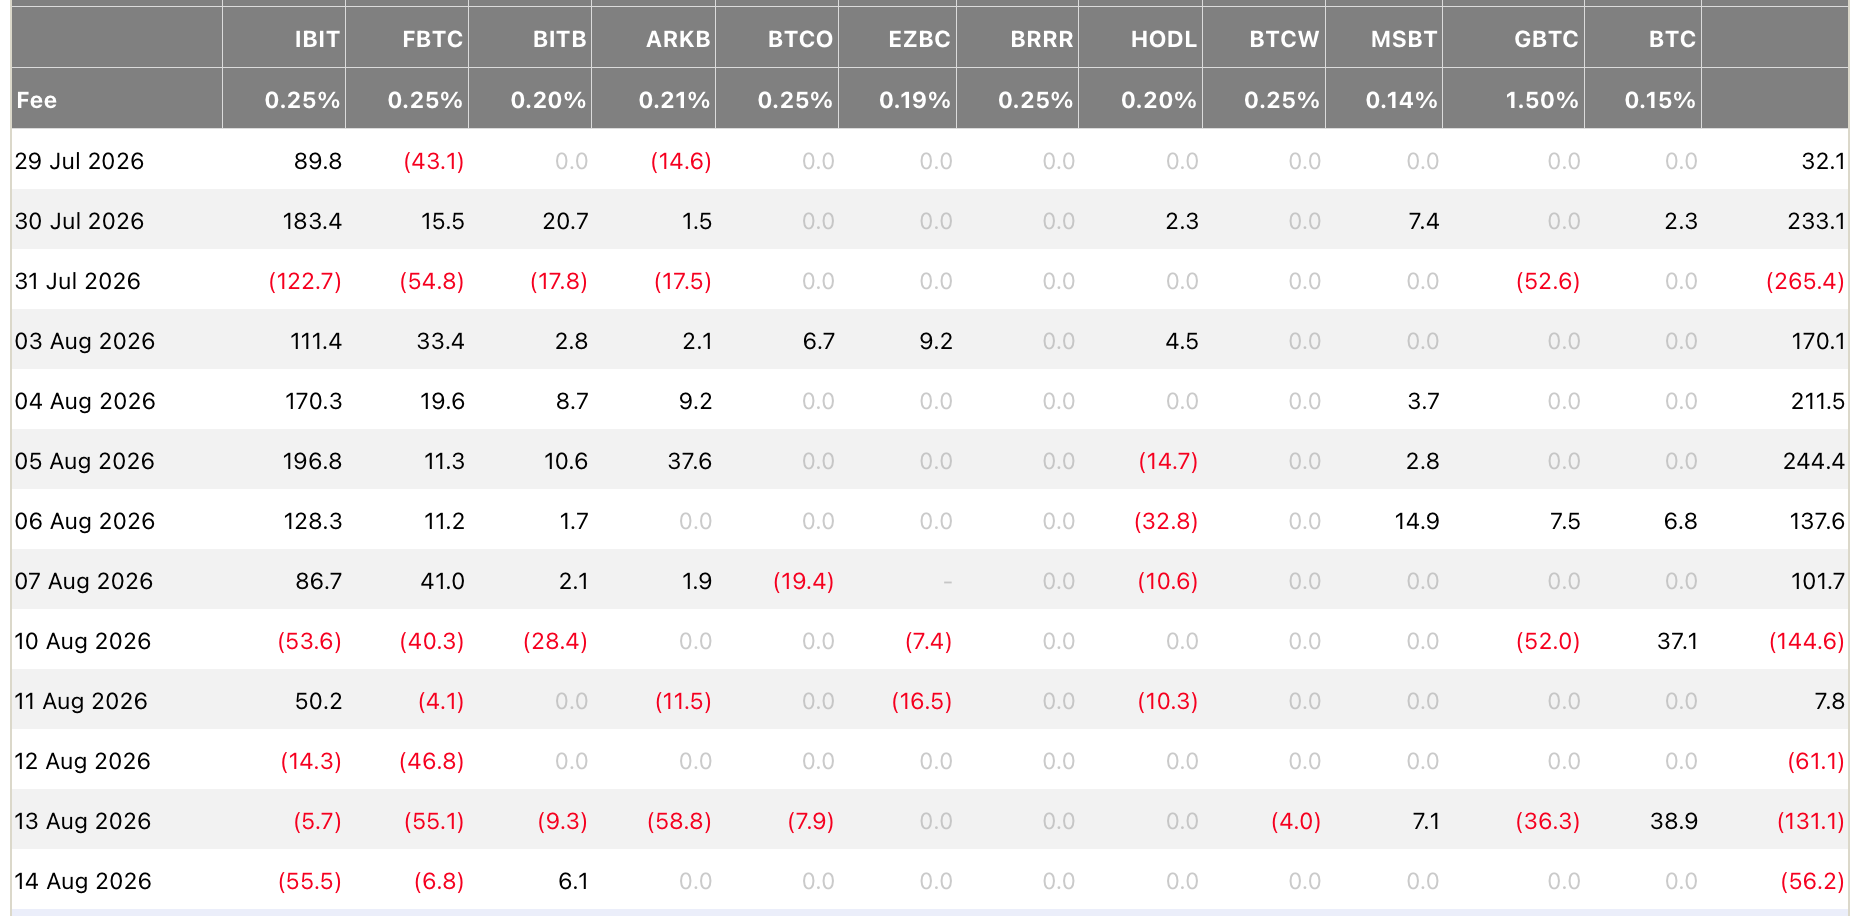
The ‘Two-Complex Spot Bid,’ which tracks the market’s two marginal spot buyers, printed its first entirely red reading since inception. Both ETF outflows and treasury companies pulled a net negative week following Strategy’s 1690 BTC sale. This rare alignment saw both the ETF complex and corporate treasuries act as sellers simultaneously.
The lack of momentum shows clearly in network activity. Spot exchange volume, when adjusted for coin count rather than USD figures, has fallen to levels not seen since early 2019 in aggregated terms. Binance introduced zero-fee trading in mid 2022 during the prior bear market, creating measurement discrepancies.
When filtered for Binance alone, the metric is testing 2023 bear market depths. Bitcoin transfers velocity has hit a seven-year low, providing a clear gauge of market apathy.
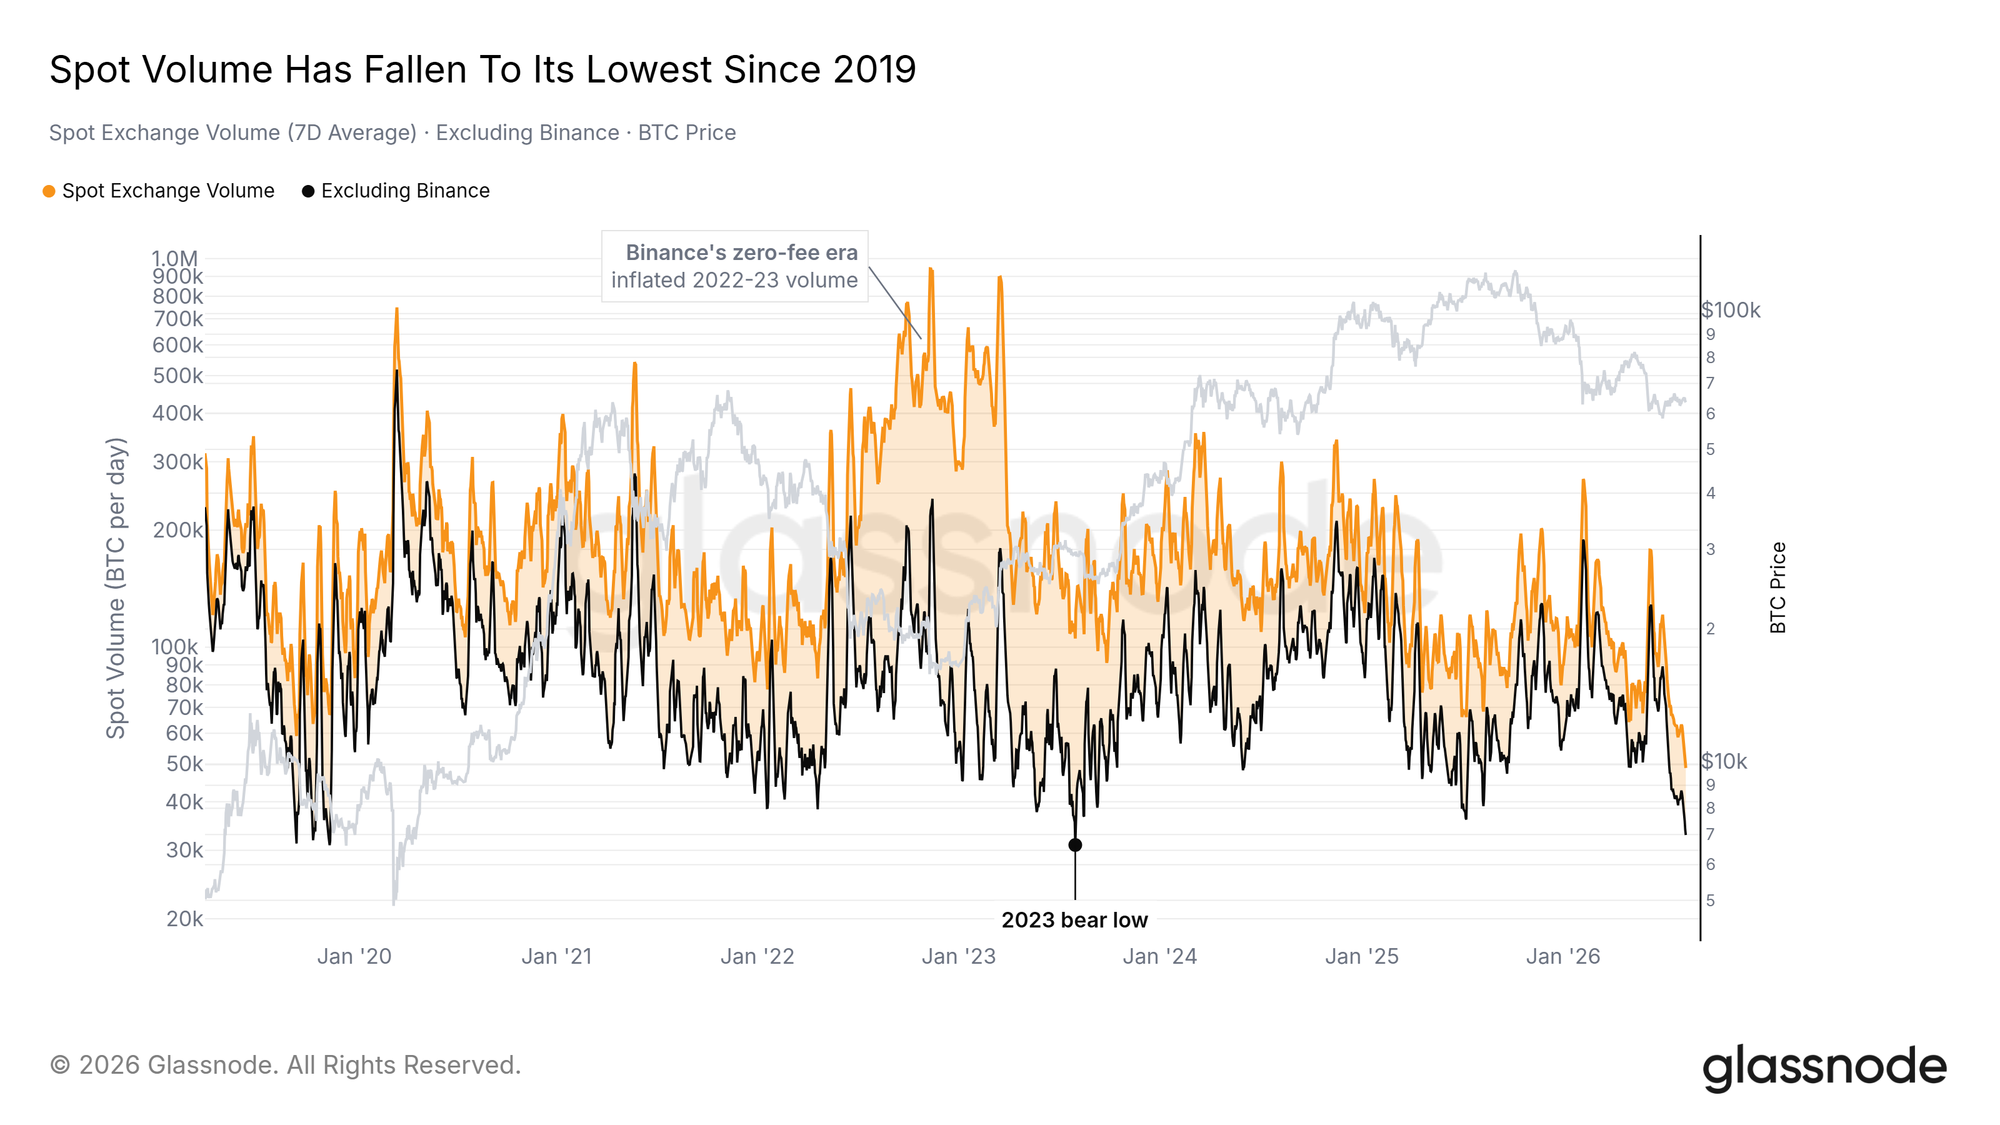
Thin tape mechanics reward outsized moves. Minimal flows exert disproportionate influence on price action. Modest bidding can spark a rally just as readily as minor selling triggers a breakdown. Historical precedent suggests that such depressed participation levels are unsustainable, marking a typical precursor to sharp volatility expansion.
This aligns with our analysis suggesting volatility expansion likely follows extended compression. Price has sustained over the Median Realised Price despite repeated tests and signals hinting at late bear market conditions. This combination suggests higher odds that volatility expansion breaks to the upside.

General Macro Updates
Crypto Still Awaits Liquidity Tailwind
July’s consumer and producer price data strengthened the case against a September rate increase, which eased financial conditions and lifted equities to record highs. The underlying inflation picture remains mixed: falling energy prices drove much of the monthly improvement, services inflation stayed sticky and goods price pressures are building in computing hardware. Crypto did not participate in the rally, which suggests the improvement in the macro backdrop has yet to translate into fresh liquidity for digital assets. The improvement is real but unfunded.
Crypto Stalled on Final Liquidity Rush
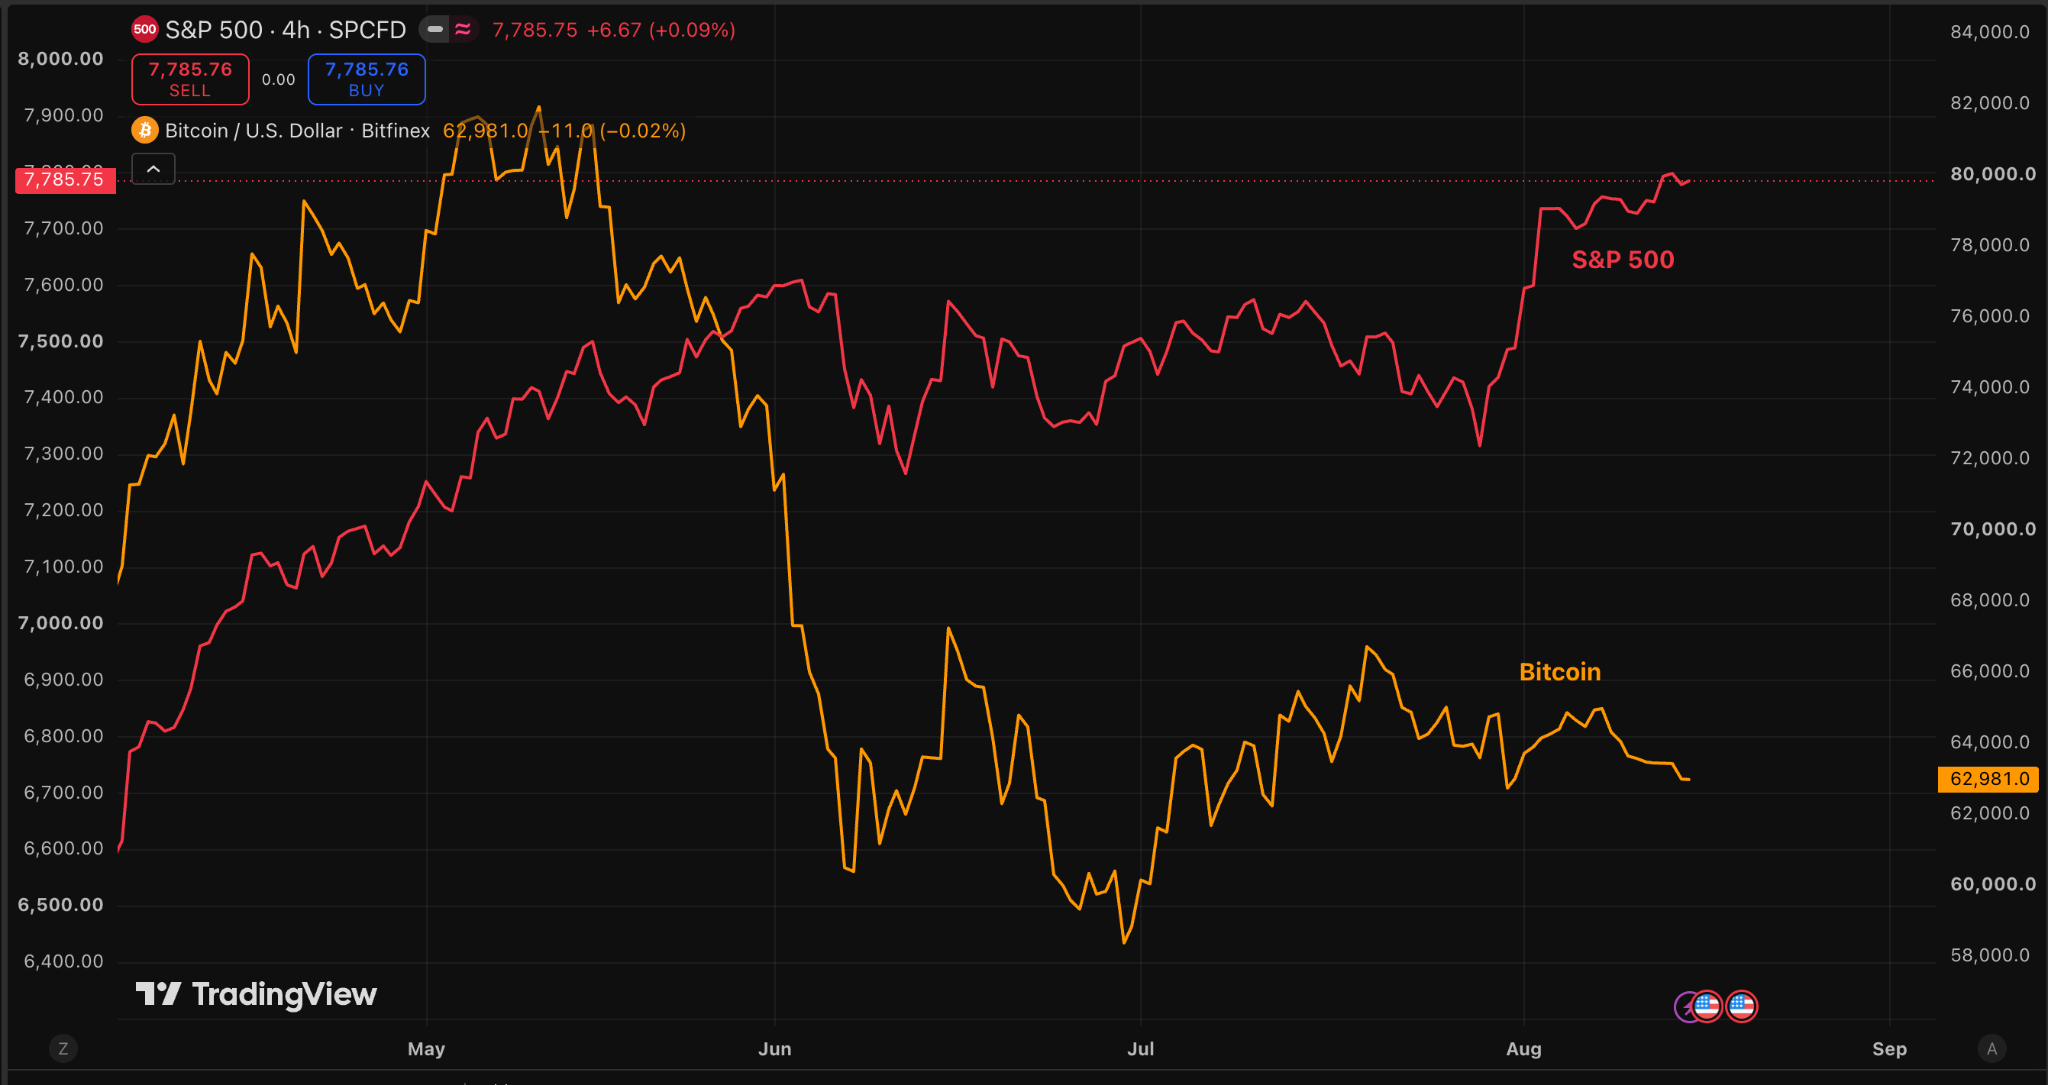
Soft inflation data caused the S&P 500 to close at record highs on both 12 and 13 August, while bitcoin did not participate. The cryptocurrency traded near $62,900 late in the week, roughly 1.3 percent lower over seven days. US spot bitcoin exchange-traded funds (ETFs) recorded net outflows on four of five sessions between 10 and 14 August, totalling around $385 million for the week, according to Farside Investors. Ether ETFs were close to flat.
Where The Chain Breaks
The divergence matters more than the size of the move. Softer data leads to lower expected rates and loosens financial conditions, which should support risk appetite and ultimately drive capital on-chain. That transmission appears to be stalling at the final step.
Lower expected policy rates lift assets that discount future cash flows, which is why equities responded first and fastest. Crypto has no cash flows to discount. It responds to realised liquidity rather than to expected liquidity — and realised liquidity has not moved. Stablecoin supply peaked at $315 billion in mid-May and stands roughly 4.5 percent lower at $300.7 billion. The rate relief delivered through equity valuations does not automatically arrive as new capital on-chain. Until that changes, softer inflation prints improve the backdrop for crypto without yet funding it.

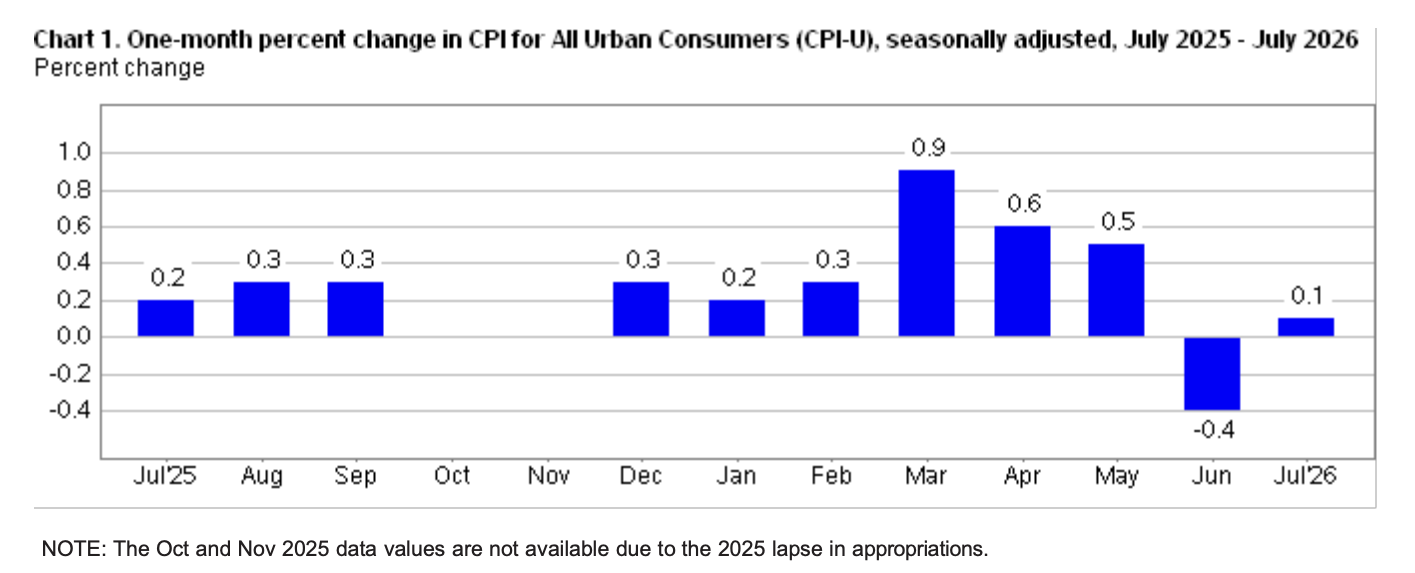
Falling fuel prices combined with broad-based cooling produced July’s restrained reading, released by the US Bureau of Labor Statistics on 12 August. Consumer prices rose by 0.1 percent during the month after falling by 0.4 percent in June, leaving annual headline inflation at 3.4 percent. Core inflation, which removes food and energy, rose by 0.2 percent in the month and 2.5 percent over the year. The energy index fell by 1.5 percent, with gasoline down by 2.9 percent. That single category is the difference between a soft print and an uncomfortable one.

Housing delivered additional relief. Shelter prices rose by just 0.1 percent and were 3.2 percent higher than a year earlier. Owners’ equivalent rent, which estimates what homeowners would pay to rent a similar property, rose by 0.3 percent. Shelter has been the dominant source of US inflation for three years, so a deceleration here matters more than any other line in the release. Energy tells two stories depending on the window. Within July, falling energy prices produced a soft monthly reading. Over the year, energy has remained sharply elevated. That annual strength is what is holding headline inflation at 3.4 percent above core at 2.5 percent, a gap that has narrowed from 1.3 points in May.
Services Did Not Cooperate
Strip away the energy relief and the picture becomes far less settled. Services, excluding energy services, were 3.0 percent higher than a year earlier. Medical care rose by 0.4 percent during the month, and airline fares by 2.2 percent on a seasonally adjusted basis. These categories do not respond quickly to interest rates, which is the underlying problem.
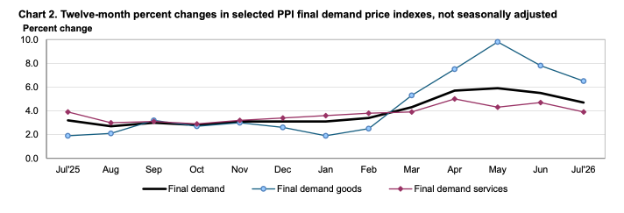
Figure 10. Twelve month change in selected PPI final demand (Source: US Bureau of Labor Statistics)
Producer price data told the same story. Final demand prices were unchanged in July after falling by 0.1 percent in June, with annual growth slowing to 4.7 percent. Goods fell by 0.7 percent and energy and services rose by 0.2 percent. The measure that matters is the narrower one that excludes food, energy and trade services. That rose by 0.4 percent in the month and remained 4.7 percent higher than a year earlier, the same annual rate as headline final demand but on a different measure
Several of its components feed directly into the Personal Consumption Expenditures (PCE) price index the Fed uses to judge progress towards its 2 percent target. Soft headline producer prices with a firm core is not a report that forces a hike, but it is not one that closes the question either.
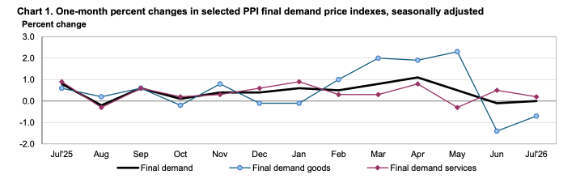
Figure 12. US Producer Price Index: Machinery and Equipment – Electronic Component and Accessories (Source: US Bureau of Labor Statistics)
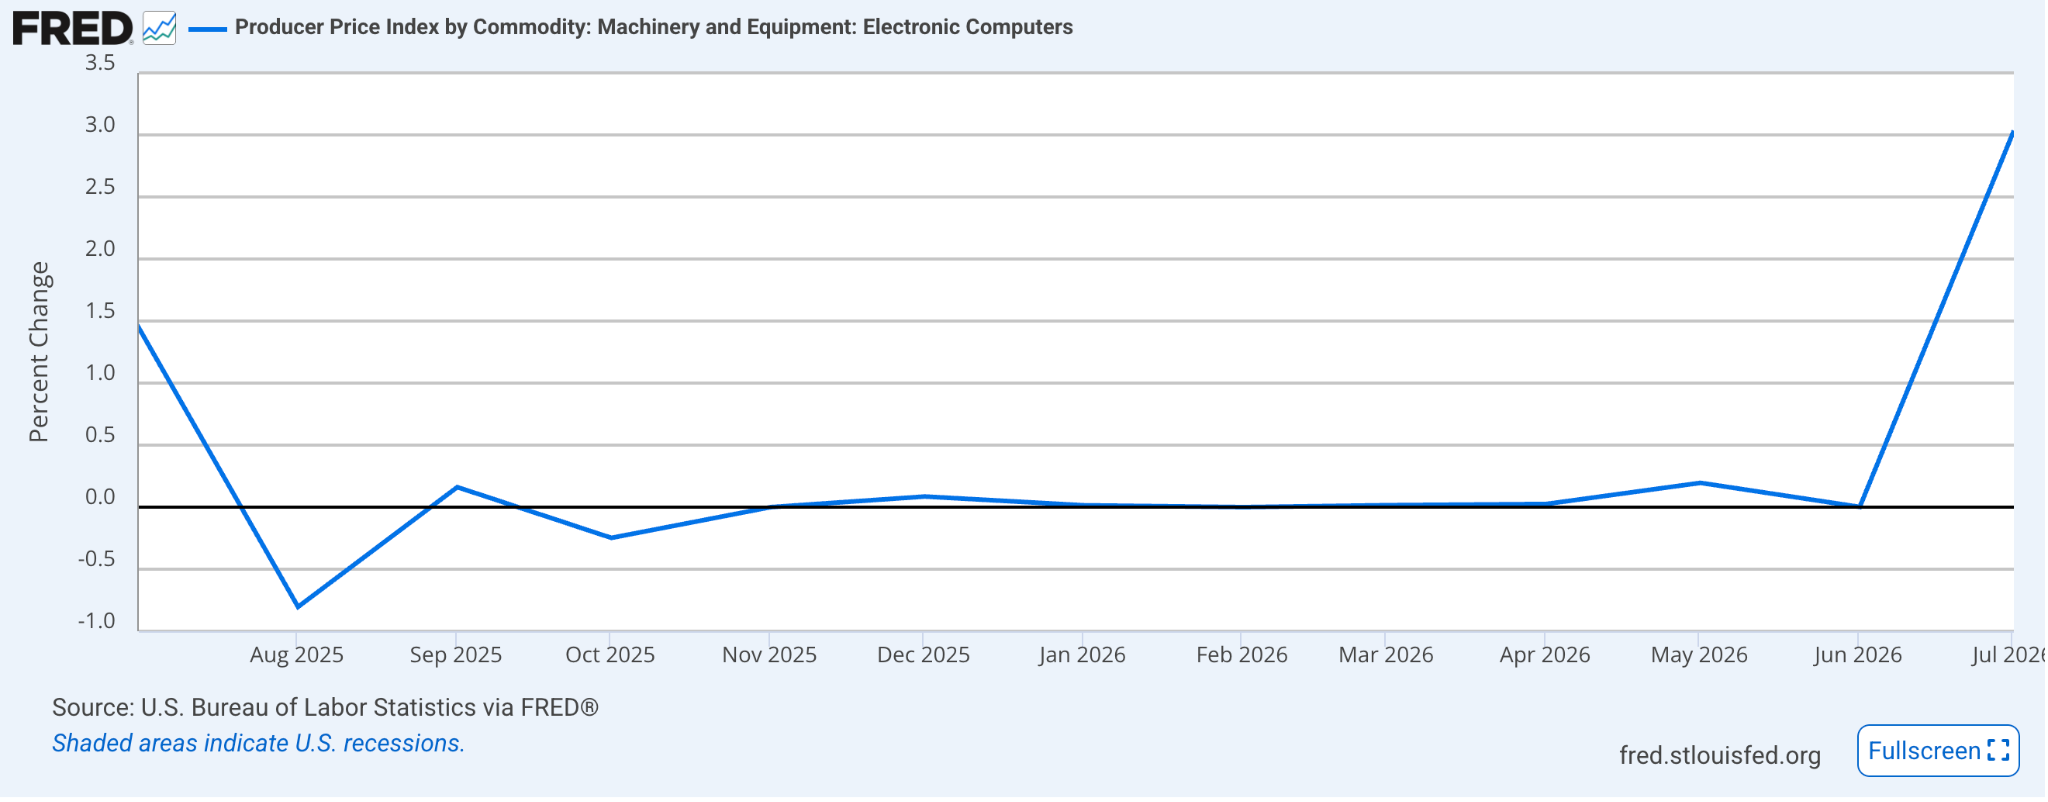
The impact of artificial Intelligence infrastructure buildouts is now visible in producer prices. Producer prices for electronic components and accessories were 28 percent higher in July than a year earlier, though they fell by 0.7 percent during the month on a seasonally adjusted basis. Prices for electronic computers rose by 3.0 percent in July alone after eight months of roughly flat readings. This marks a break in a series that had barely moved since early 2023.
The Fed’s own regional reporting explains the mechanism. The July Beige Book recorded sharp price increases for memory and storage components driven by elevated demand from data center buildouts in the New York district. In the Atlanta district, the Fed found that the accelerated build-out of the infrastructure for emerging AI technologies contributed to supply constraints and higher prices for steel, transformers, and other machinery. Computing capacity competes for the same components that businesses and households buy, so the cost pressure does not stay inside the data centres. This is a supply constraint rather than excess household demand, which is why the Fed is unlikely to raise rates in response, and also why it will not fade on the Fed’s schedule.
The Consumer Stopped Spending
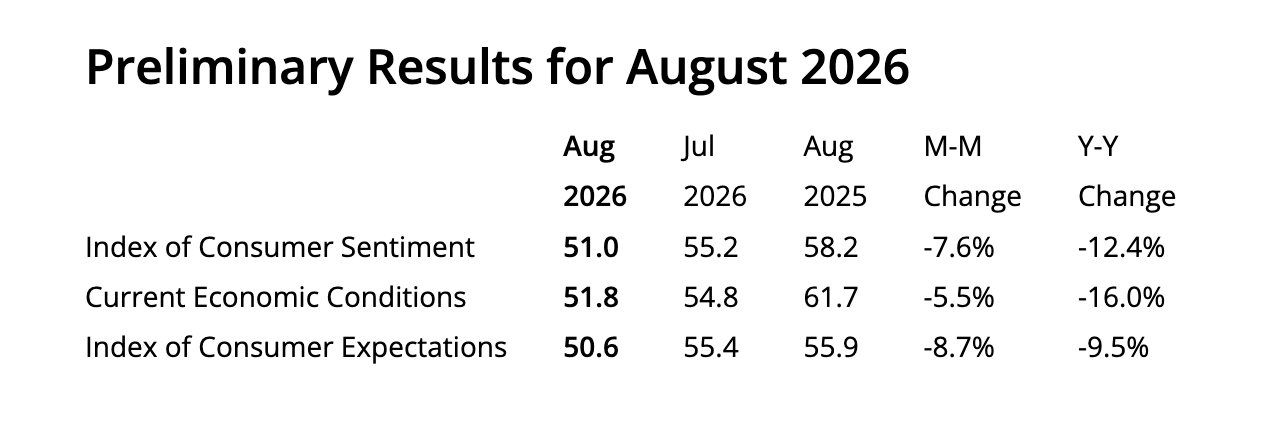
Sentiment deteriorated alongside spending. The University of Michigan Index of Consumer Sentiment fell to 51 in the preliminary August reading from 55.2 in July, a drop of 7.6 percent in one month and 12.4 percent over the year, ending two consecutive months of improvement. Expected inflation one year ahead rose to 4.3 percent from 4.2 percent, while the five to ten year measure held at 3.3 percent for a third month. Households are reporting weaker conditions and expecting firmer inflation at the same time. This is the combination that leaves the Fed the least room to manoeuvre.
Energy explains much of the gap between the official data and household experience. Headline inflation was held down by falling energy prices in July, yet regular gasoline still cost $4 per gallon in the week ending 7 August, 89 cents more than a year earlier. A slower rate of increase does not undo the level. Real average earnings fell by 0.2 percent between July 2025 to July 2026. Households are still paying more for food, housing and energy than they did a year ago. This is why the same data that reads as relief to markets does not read as a relief to consumers and why the Fed is judging a hold against a household backdrop that has not improved.
Households Are Not Feeling It
Slower inflation has not translated into improving household finances. Real average hourly earnings, which measure pay after accounting for consumer prices, fell by 0.2 percent between July 2025 and July 2026. Pay has not kept pace with prices over the year. Disinflation means prices are still rising, but at a slower pace. This is why softer inflation data looks positive to markets but does not read as relief to consumers.
The Signal For September
July’s data have raised the bar for another increase without resolving the Fed’s core question: Does remaining inflation reflect persistent demand (which higher rates can address) or supply constraints in energy, tariffed goods and computing hardware (which they cannot)?
July favoured the second interpretation. That argues for holding rather than tightening and it also means the disinflation on display is more fragile than the headline suggests.
The Federal Open Market Committee holds the federal funds target range at 3.50-3.75 percent and next meets on 15-16 September, with one more round of employment and inflation data to come first. For crypto, the meeting matters less than the transmission: rate relief has already reached financial conditions. The next article takes up why it has not yet reached digital assets.

Soft Inflation Sparked A Risk Rally
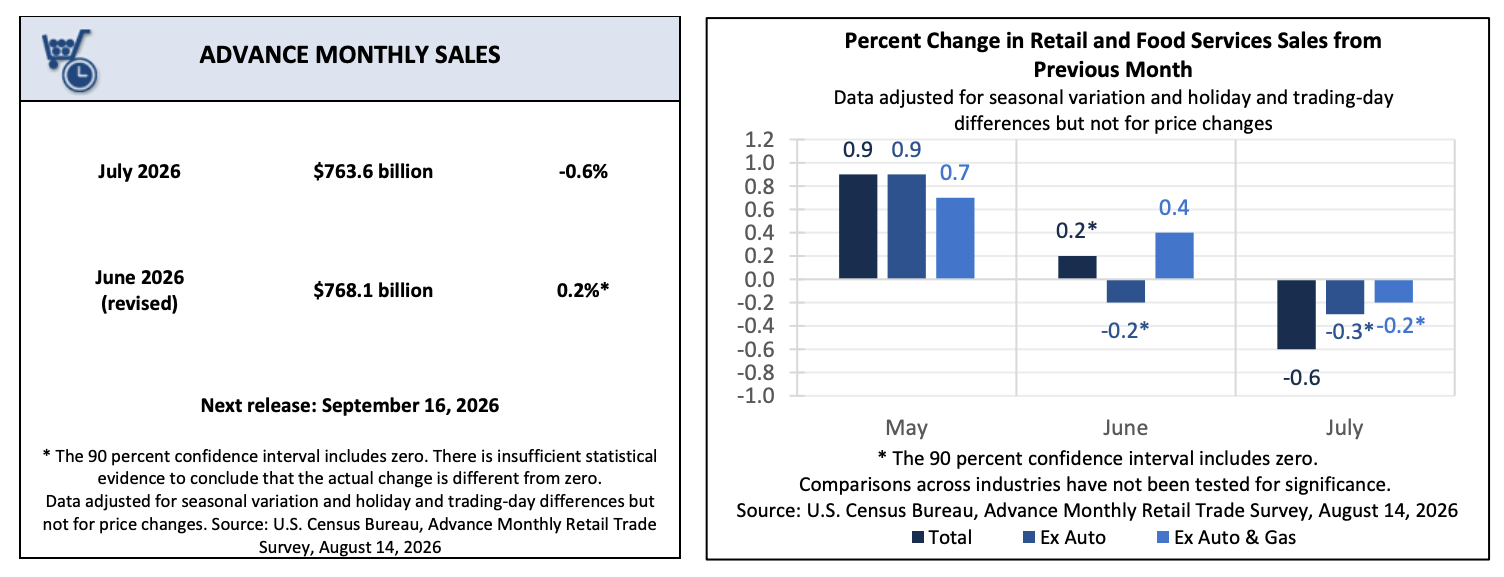
The inflation relief reached financial markets within hours. Traders cut the probability of a September rate increase, the front end of the Treasury curve rallied and the S&P 500 closed at record highs on both consumer and producer price days. Households moved the other way. Retail sales fell, consumer sentiment dropped by 7.6 percent in a month and bitcoin finished the week lower than it started.
Rate Expectations Repriced, The Long End Did Not
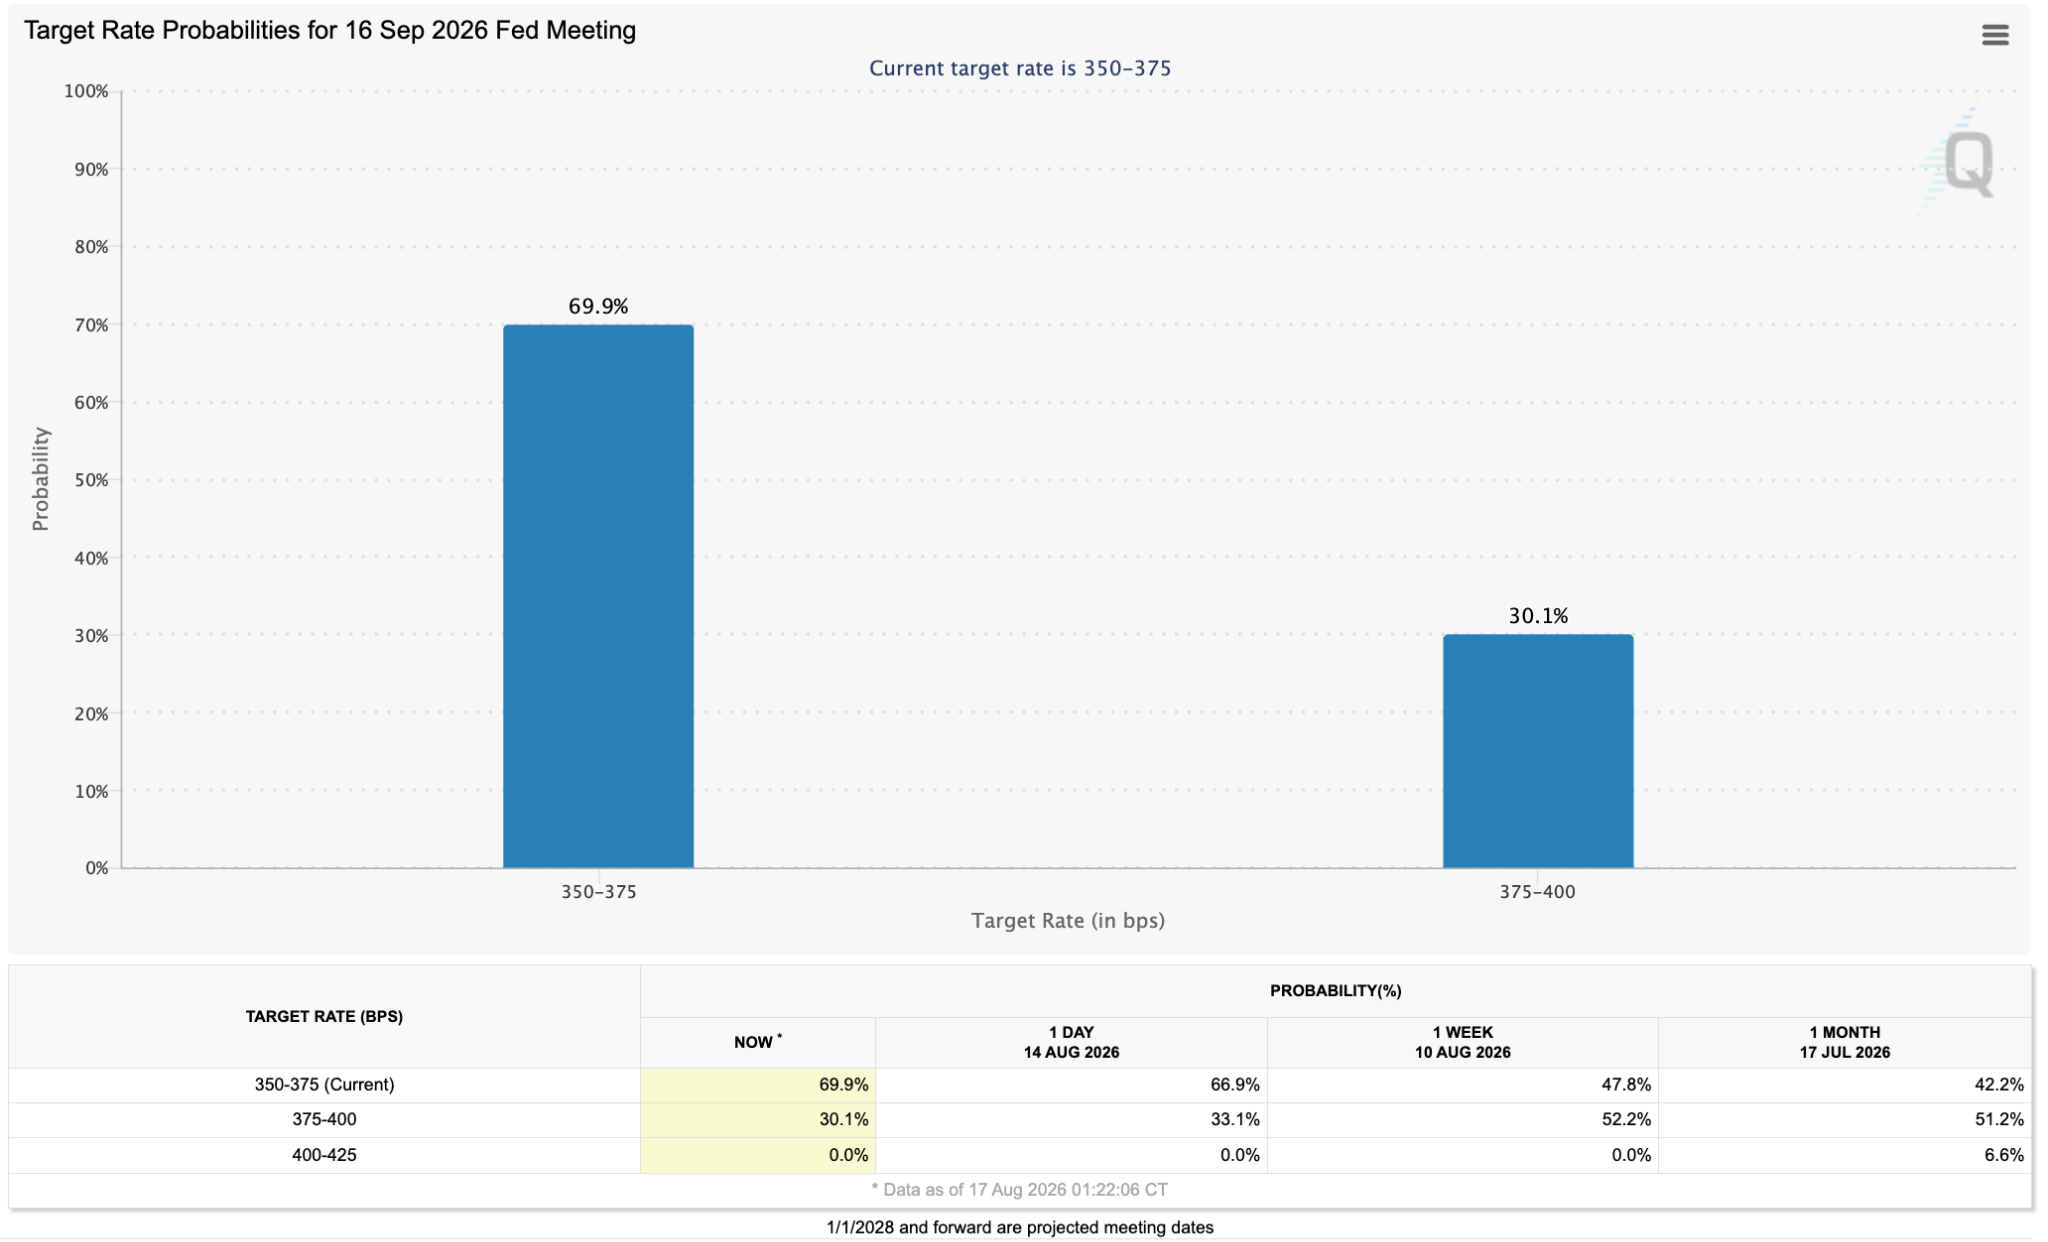
Markets traded the price data and ignored the demand data. The implied probability of a September increase in the federal funds target fell from roughly 52.2 percent the week before the consumer price release to the low 30.1 percent after the producer price release, extending the repricing that began with the July payrolls miss. Two-year Treasury yields fell to 4.15 percent on 13 August (PPI release date) from 4.25 percent on 10 August, with five basis points of that move on producer price day alone. The 10-year yield fell to 4.64 percent on 13 August, from 4.70 on 10 August.
The long end refused to follow. The 30-year yield closed at 5.21 percent on 13 August after setting a higher local high of 5.25 percent on 10 August, leaving it within six basis points of its July peak. A curve that steepens while policy expectations soften is pricing duration and fiscal risk, not disinflation.
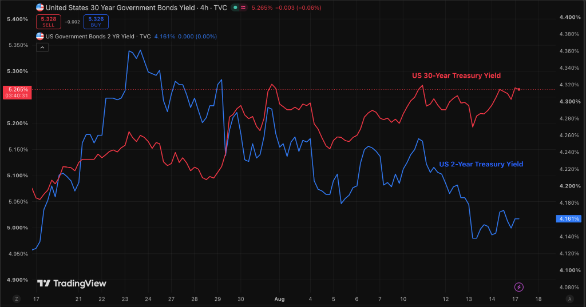
Figure 16. US 2-Year and 30-Year Treasury Yields (Source: TradingView)
The Treasury’s quarterly refunding statement on 5 August, which held nominal coupon auction sizes unchanged for at least several more quarters, gave the long end no reason to rally. Financial conditions were loose before any of this: the Chicago Fed National Financial Conditions Index printed -0.549 for the week ending 7 August, the loosest reading of the current run and a fifth consecutive weekly loosening. That index does not yet capture the post-release moves. The next print, on 19 August, will. The 30-year is the single test we are watching into September: if it takes out its July peak while hike odds keep falling, the long end is pricing something other than the Fed.
What Decides The Next Move
The July data have made a September increase unlikely without settling what the Fed is actually worried about. Weak demand and firmer household inflation expectations point in opposite directions, and the committee’s own reasoning will become visible when the minutes of the 28-29 July meeting are published on 19 August. The larger test is the Kansas City Fed’s Jackson Hole symposium from 27 to 29 August, whose announced theme is financial innovation and its implications for payments and policy.
For a market that has priced out the hike but has not yet seen liquidity respond, what Chair Kevin Warsh says about the path from here will matter more than the next monthly print.
Why This Matters for Crypto
Two of the three conditions crypto needs (lower policy rate expectations, looser financial conditions and actual liquidity reaching digital assets) are now in place. Policy rate expectations have fallen, and financial conditions are loose at -0.549 on the Chicago Fed index. The third, actual liquidity reaching digital assets, has not arrived: spot bitcoin funds shed roughly $385 million in the week the S&P 500 set two record closes. That gap is the thing to watch, not the inflation prints themselves. The transmission runs from softer data to lower expected rates to looser financial conditions to risk appetite, and it is currently stalling at the final step because stablecoin supply, the clearest measure of capital actually entering the crypto market, has been shrinking since May. The marker to track is straightforward: a week of net inflows into US spot bitcoin ETFs alongside a rising stablecoin float would confirm the chain has reconnected. Until then, that improvement is still unfunded.
What Would Prove This Wrong
The house view is that the Fed stays on hold through September, that the pressure on the long end is fiscal rather than inflationary and that crypto is waiting on liquidity rather than on rate expectations. None of the falsifiers listed last week triggered, though one moved closer. These are the conditions that would break the call.
The implied probability of a September rate increase returns above 60 percent and holds there. It sat at 30.1 percent on 17 August, down from 52.2 percent a week earlier.
Initial jobless claims exceed 230,000 for two consecutive prints. Claims were 209,000 in the week ending 8 August, up 9,000 but with a four-week average of 199,000. The next print lands on 20 August.
Private payrolls turn negative for a second consecutive month with a rising unemployment rate. The next employment report is due on 4 September, before the meeting.
The 30-year yield takes out its July peak while hike odds keep falling. The 30-year closed at 5.21 percent on 13 August after a higher high of 5.25 percent on 10 August.
The 10-year TIPS real yield holds above 2.5 percent for two consecutive weeks. It fell to 2.39 percent on 13 August, moving away from the line rather than towards it.
Computing hardware prices flatten for a second consecutive month while artificial intelligence capital expenditure guidance holds, which would break the AI inflation channel. July import prices, released on 18 August, are the next read.
The clean test of the crypto argument is the inverse of the divergence described above: if spot bitcoin funds post a week of net inflows while hike odds fall further, liquidity is following rates after all and the lag explanation was wrong.