

Issue #226:
What Bitcoin Needs to Reclaim $84,500
Wednesday’s CPI Decides Whether Bitcoin Gets Room
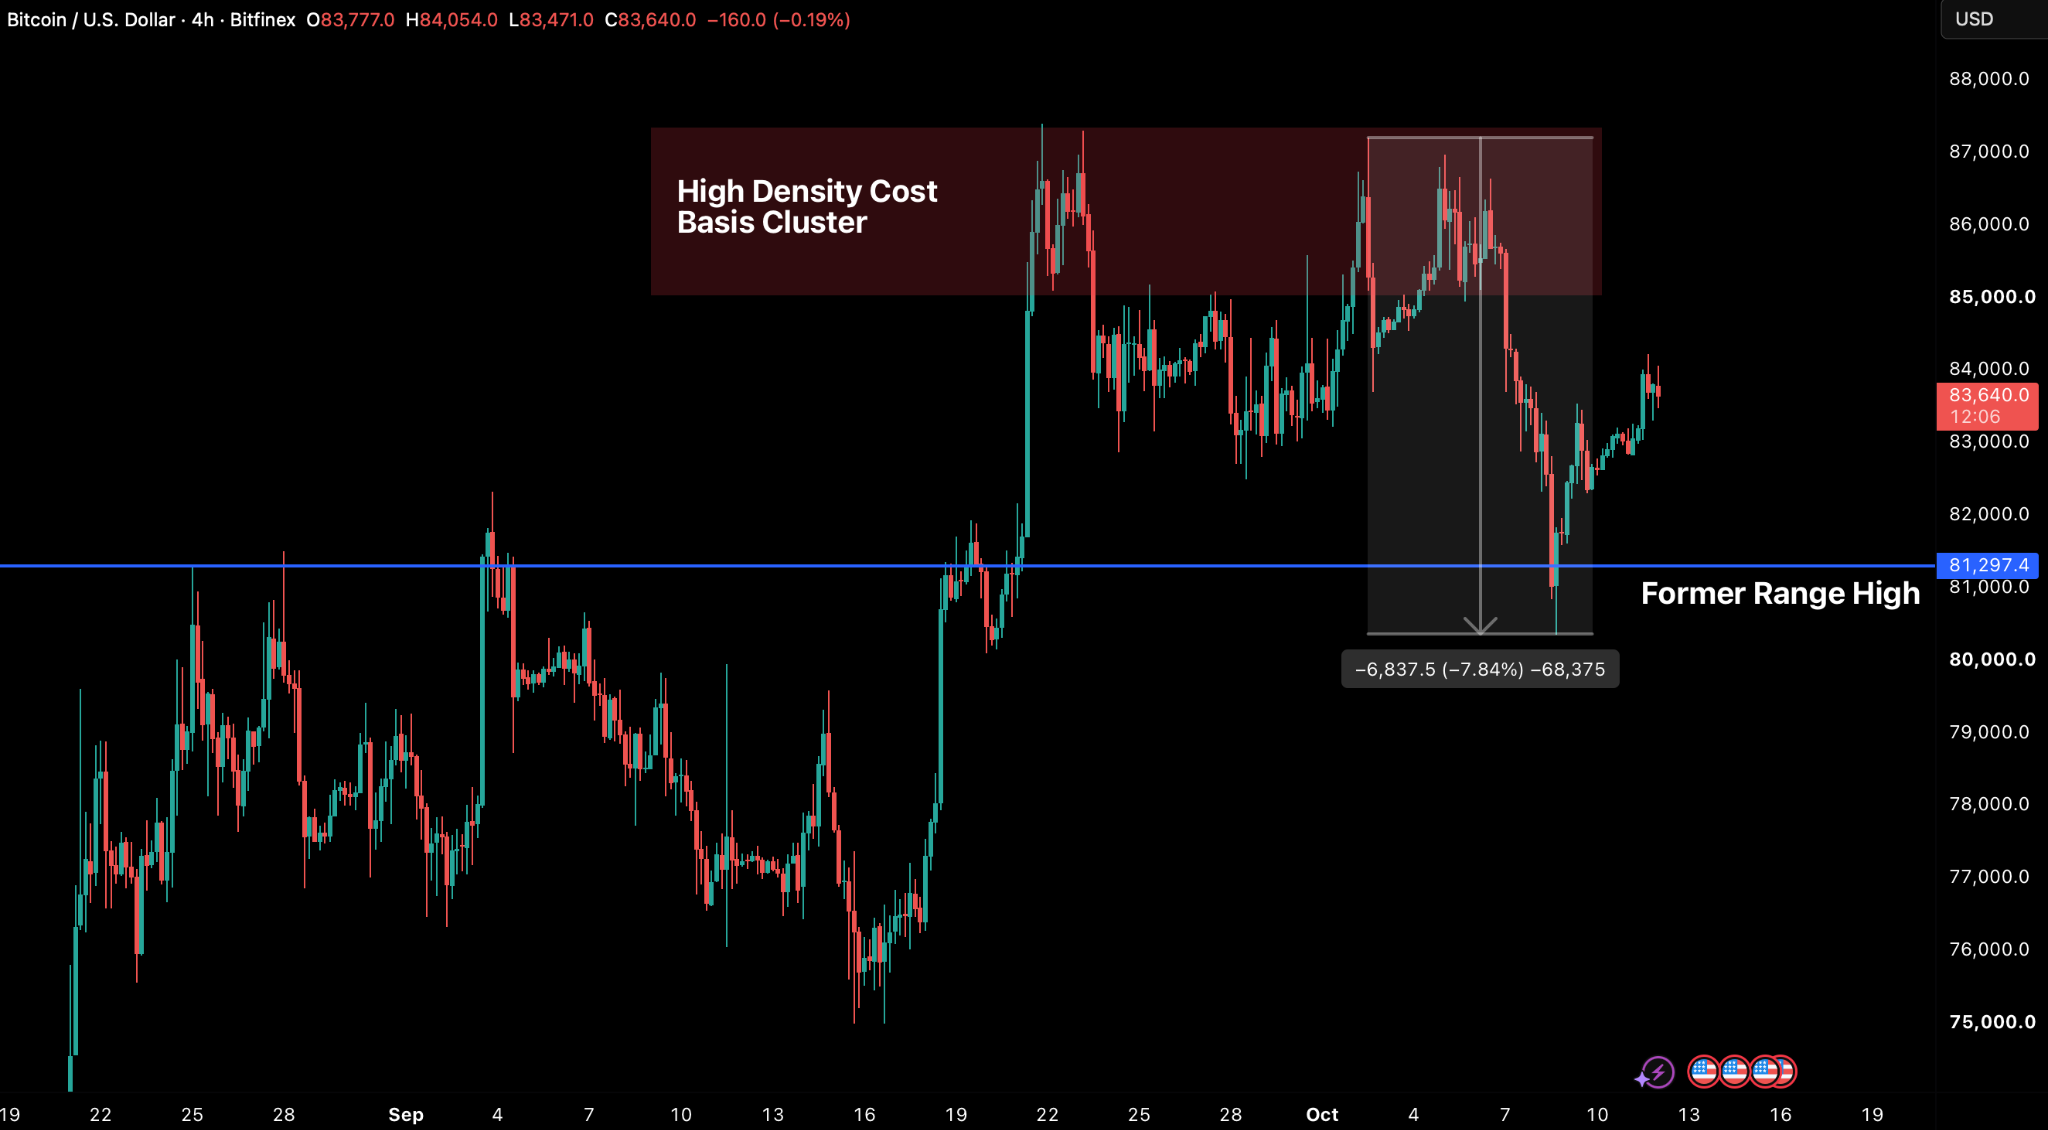
Bitcoin enters the week having passed an important test. It fell 7.9 percent from its 2 October high of $87,197 to $80,347 on 8 October, breaking briefly below the $81,300 former range high before recovering it within the session. The question for this week is whether Wednesday’s US Consumer Price Index (CPI) report changes the rate and yield outlook enough to give bitcoin room to move, and whether spot demand is there to carry it.
The level held constructively. The decline was in line with the five earlier pullbacks of this recovery. Investors whose cost basis sits inside the former range showed little sign of selling, while the losses realised by recent buyers were a fraction of those seen in the sell-offs earlier this year. Leverage has also been cleared, with $1.18 billion in positions liquidated across the crypto market on 8 October and open interest not rebuilt since, leaving the next move to the spot market. Spot demand is where the evidence is weakest. The average ETF investor is now marginally underwater, with the aggregate cost basis at $84,340, which allows holders to sell into rallies without a loss.
The macro backdrop has not eased either. Core PCE inflation is at 3 percent, most Federal Reserve officials expect another rate increase this year and the 10-year inflation-adjusted Treasury yield, the low-risk return that bitcoin competes with, stands at 2.91 percent. A core CPI reading of 0.2 percent or less would lower rate expectations and pull that yield down, while a reading of 0.3 percent or more would keep the burden on spot buying.
Our base case is that bitcoin trades between $81,300 and $84,500 into the release. With price sitting between defended support and the cost basis of ETF investors, we will look to ETF flows and the market’s reaction to CPI as the next directional signal. Acceptance above $84,500 on positive ETF flows would bring the $87,722 yearly open back into view. Sustained trading below $81,300 with renewed outflows would change our view and bring the True Market Mean near $77,400 into play.

Market Signals
The $81,300 Retest: Former Range High Held as Support
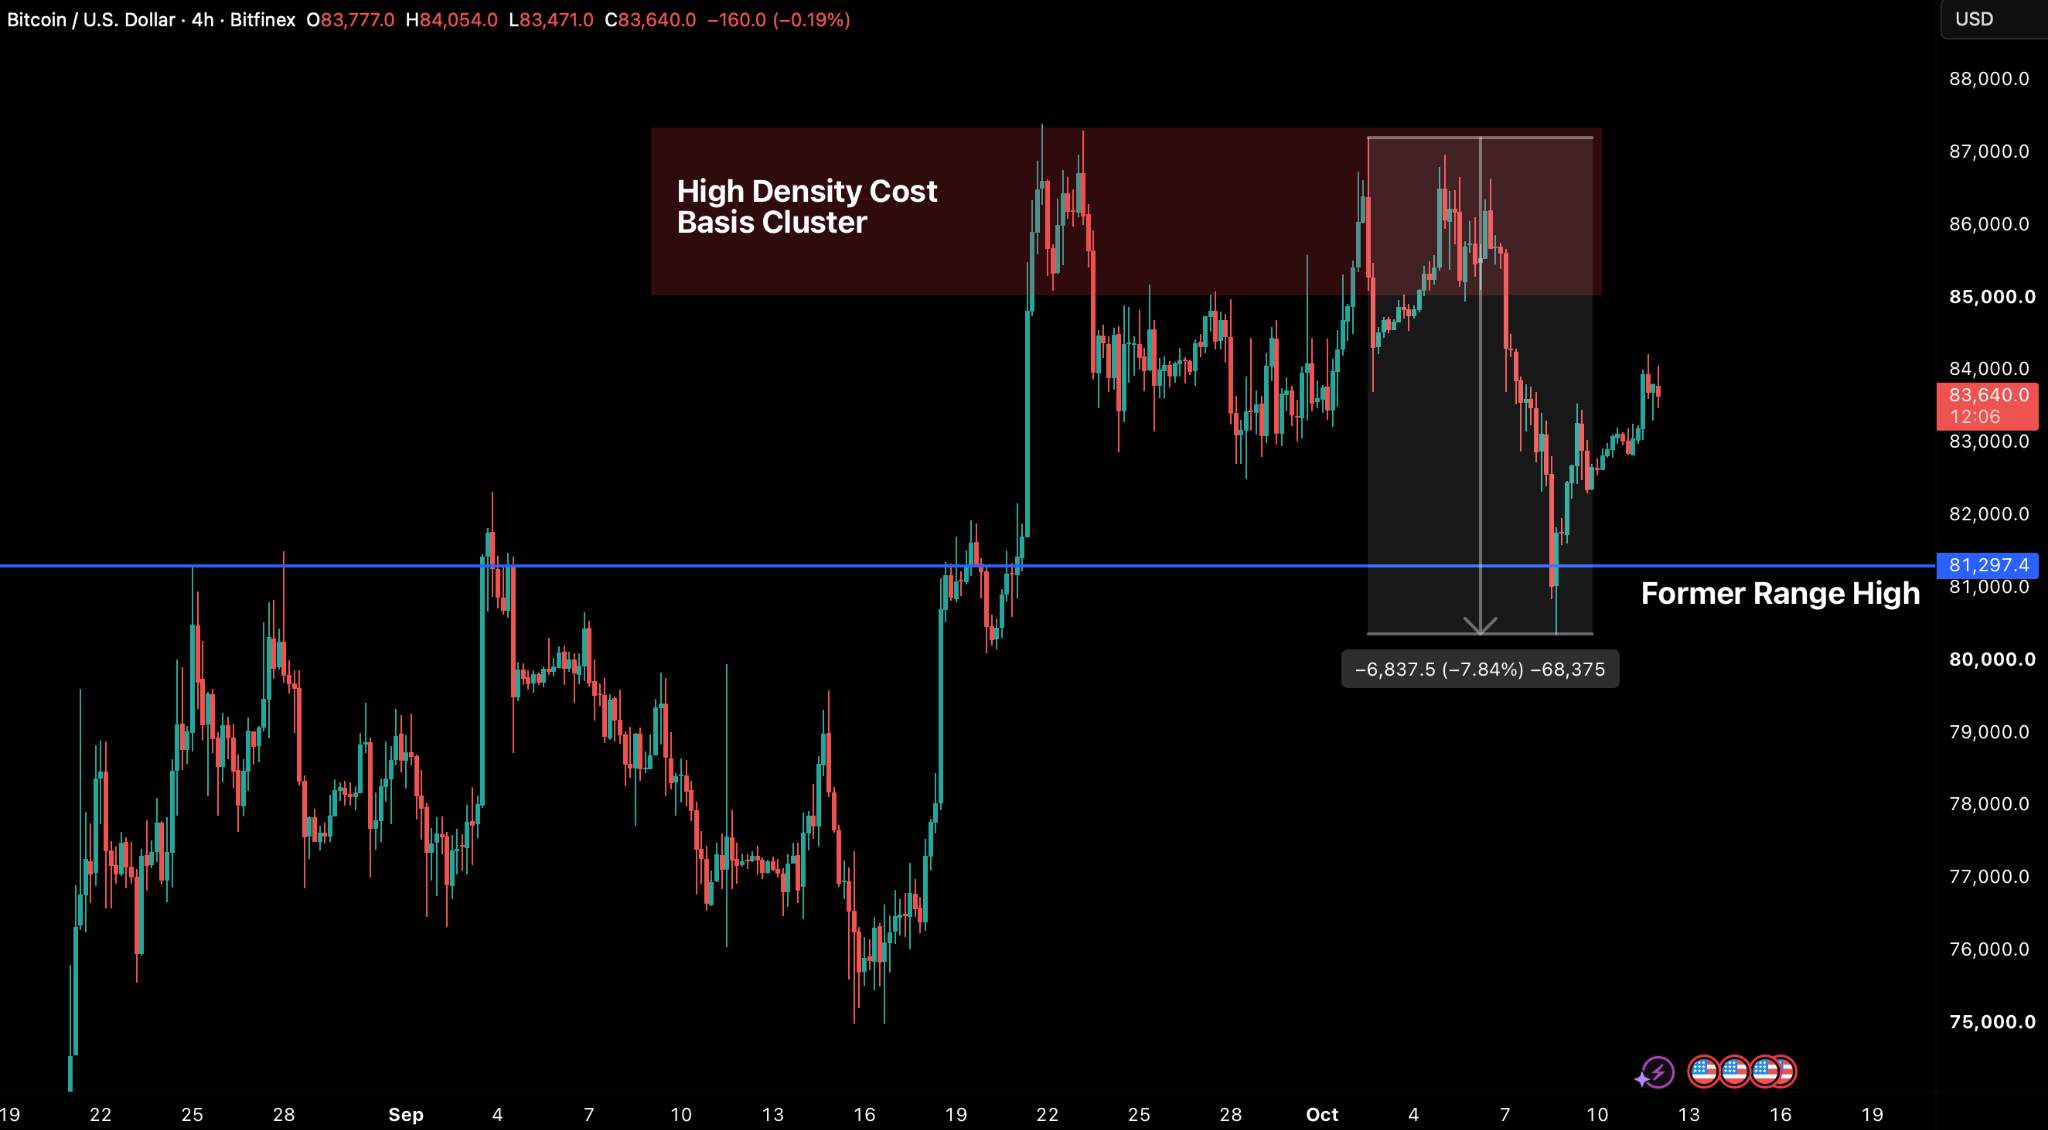
Bitcoin fell 7.9 percent from its 2 October high of $87,197 to a low of $80,347 on 8 October, retesting $81,300 — our former range high and a high-volume node that represents a significant support level. After three consecutive weekly gains, BTC recorded its first weekly decline in a month. In our view, the recovery remains paused until bitcoin is back above $84,000. That level supported BTC for most of the past three weeks and is now the first resistance to clear.
After failing for a third time to clear the $87,722 yearly open, BTC lost support at $84,000 on 7 October. In last week’s Intelligence Update, we said that a break below that floor would carry price quickly through thin supply to the former range high. Buyers defended that level, with BTC spending only part of one session below it before closing the week at $83,800, down 3.1 percent. The low of $80,347 was just 1.2 percent below $81,300, with price recovering above the level within the session.
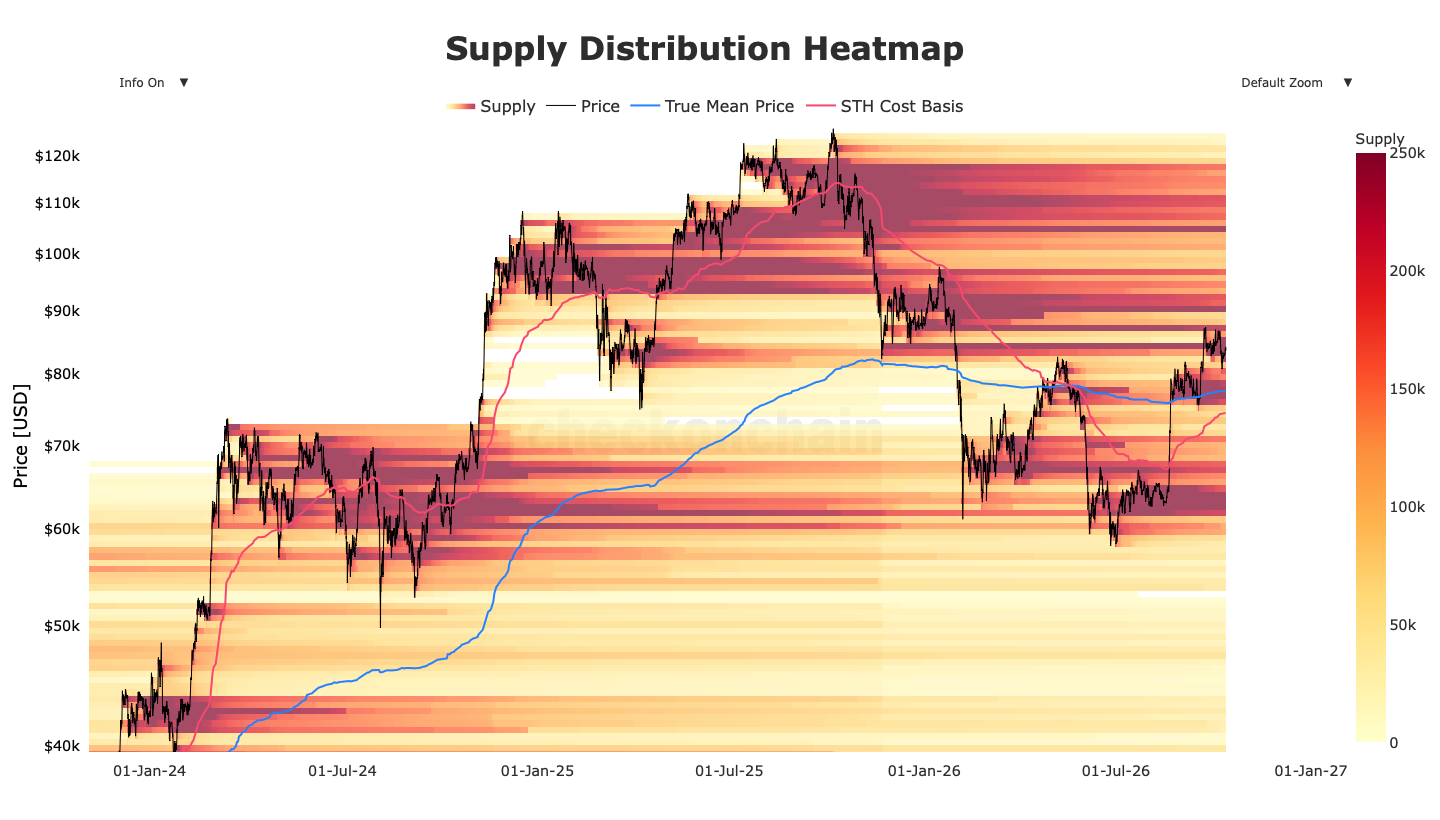
The level held constructively, firstly due to the size of the move. The 7.9 percent peak-to-trough decline represented the sixth pullback of five percent or more since the cycle low of $57,803 on 1 July, with the previous five ranging from 5.1 to 8.9 percent. The latest decline therefore remains within the range of a standard correction during the recent medium-term uptrend. Historically, even lower-timeframe bitcoin uptrends have regularly seen pullbacks of 14-15 percent, although those figures are skewed by earlier periods when bitcoin’s market capitalisation was considerably smaller.
Secondly, the supply distribution shows who sold and who held. Coins with a cost basis inside the former range, between roughly $77,600 and $81,300, remained broadly unchanged through the retest, declining only slightly from 827,000 BTC on 6 October to 822,000 BTC on 11 October. Holders whose breakeven was being tested therefore showed little sign of selling. The selling instead came largely from buyers near the top, with around 216,000 BTC leaving the band between $85,000-$86,000. Those coins were absorbed directly above the retested level, where supply with a cost basis between roughly $81,300 and $83,200 rose from 179,000 BTC to 537,000 BTC.

The stress on short-term holders was relatively low for a pullback of this magnitude. The Short-Term Holder Spent Output Profit Ratio (STH-SOPR) compares the price at which recent buyers sell with the price they paid, so a reading above 1 means they are selling at a profit. It dipped fractionally below 1 on 8 October, for the first time since 17 August, and was back above it the next day. The quick return above 1 suggests that recent buyers stopped selling at a loss, reducing the risk of further price declines pushing more holders underwater and creating self-reinforcing selling pressure. Recent buyers realised losses of about 1,940 BTC a day at the peak, compared with about 7,260 BTC a day in July and 24,400 BTC a day in February.
The rolling 2-week average has remained firmly in positive territory since 17 August, when the initial breakout began the mid-term uptrend that remains in place.
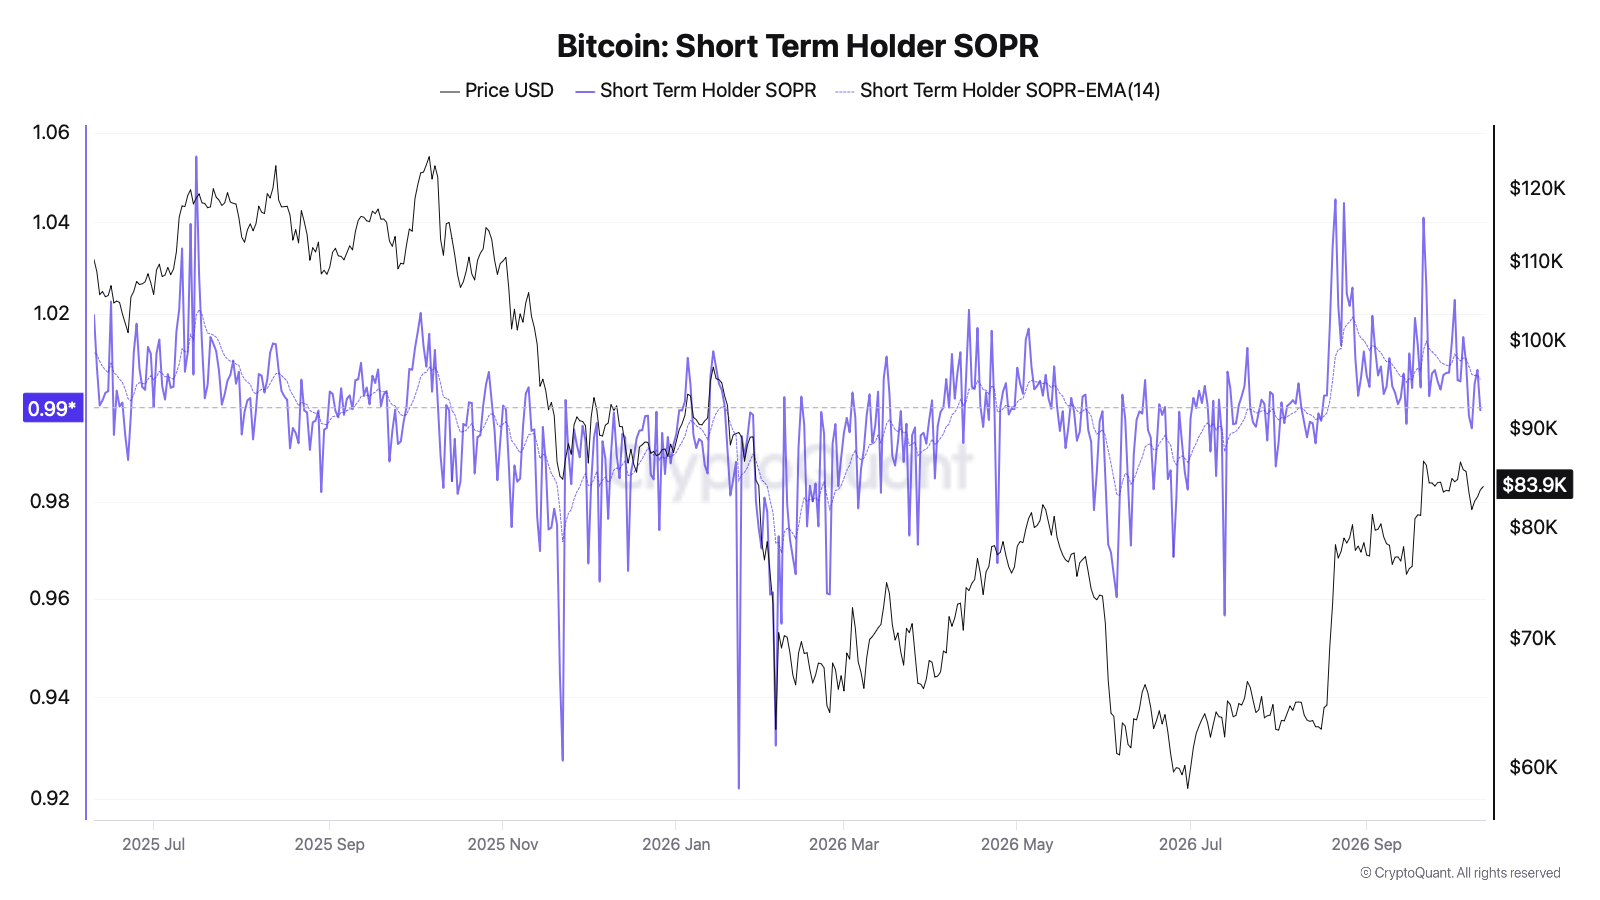
Since 2016 there have been 14 occasions on which STH-SOPR fell below 1 for three days or less after spending at least 30 days above it. BTC was higher 30 days later in seven of them. A successful retest is a necessary condition for the recovery to continue, and demand has to supply the rest.
The retest has left bitcoin with support below and supply above. Roughly 1.45 million BTC has an aggregate cost-basis between $84,000 and $86,500 and is now held at a small loss. Some of those holders will likely sell as price returns to their entry. The share of supply in profit stands at 69.6 percent, below the 75 percent that has accompanied sustained advances. A successful retest tells us that selling pressure is limited. It does not tell us that buyers have returned, and that is the question for the week ahead.

Leverage Has Been Cleared from the Market
Our previous Intelligence Update highlighted how derivatives participants accumulated short exposure as BTC broke below $84,000. That directional bias has proved profitable. The forced unwinding of leveraged longs accelerated during the 8 October sell-off, with total liquidations reaching $1.18 billion within 24 hours, $1.05 billion of which were long positions. This represents the highest daily liquidation total since 21 August.
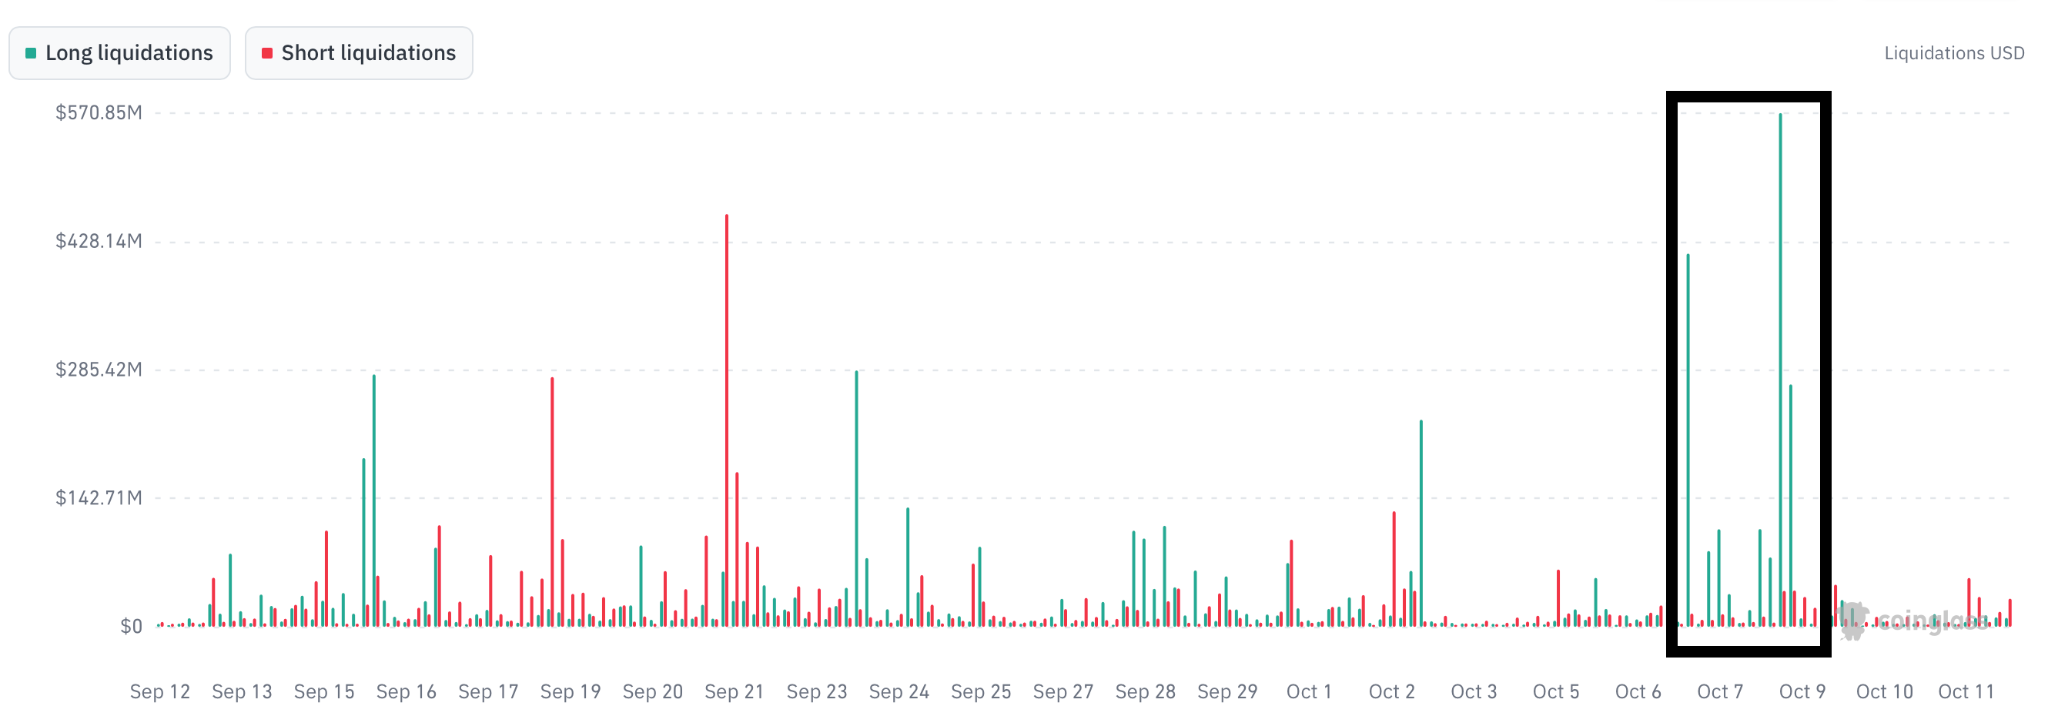
Futures open interest (OI) outlines the subsequent structural reset. Measured in BTC terms, perpetual contract OI dropped approximately three percent during the pullback before consolidating. The metric decreased further throughout the initial rebound, confirming that short participants were taking profit rather than building additional exposure. Consequently, the ascent from the $80,347 trough back past $83,000 was spot-led rather than leverage-driven.
Perpetual funding rates offer additional confirmation. Annualised yields compressed from roughly 6.7 percent on 5 October to neutral levels heading into the weekend. Options positioning reflects similar caution, with downside protection commanding a premium over upside calls, while OI for the 16 October expiration displays a put-to-call ratio near 1.5. Given that leverage has been flushed from both sides, the likelihood of a cascade triggered by liquidations remains subdued compared with last week. Price action will depend primarily on organic spot demand, placing institutional ETF flows as the core metric to monitor.

ETF Buyers Need to Return for BTC to Reclaim $84,000
The ETFs were a major source of selling last week. US spot Bitcoin ETFs recorded net outflows of $678.9 million, the first weekly outflow since early September and the largest since the week of 22 June. The $484.9 million outflow on 7 October was the largest single-day outflow since 25 June. Flows turned positive again on 9 October, with a small inflow of $21.1 million.
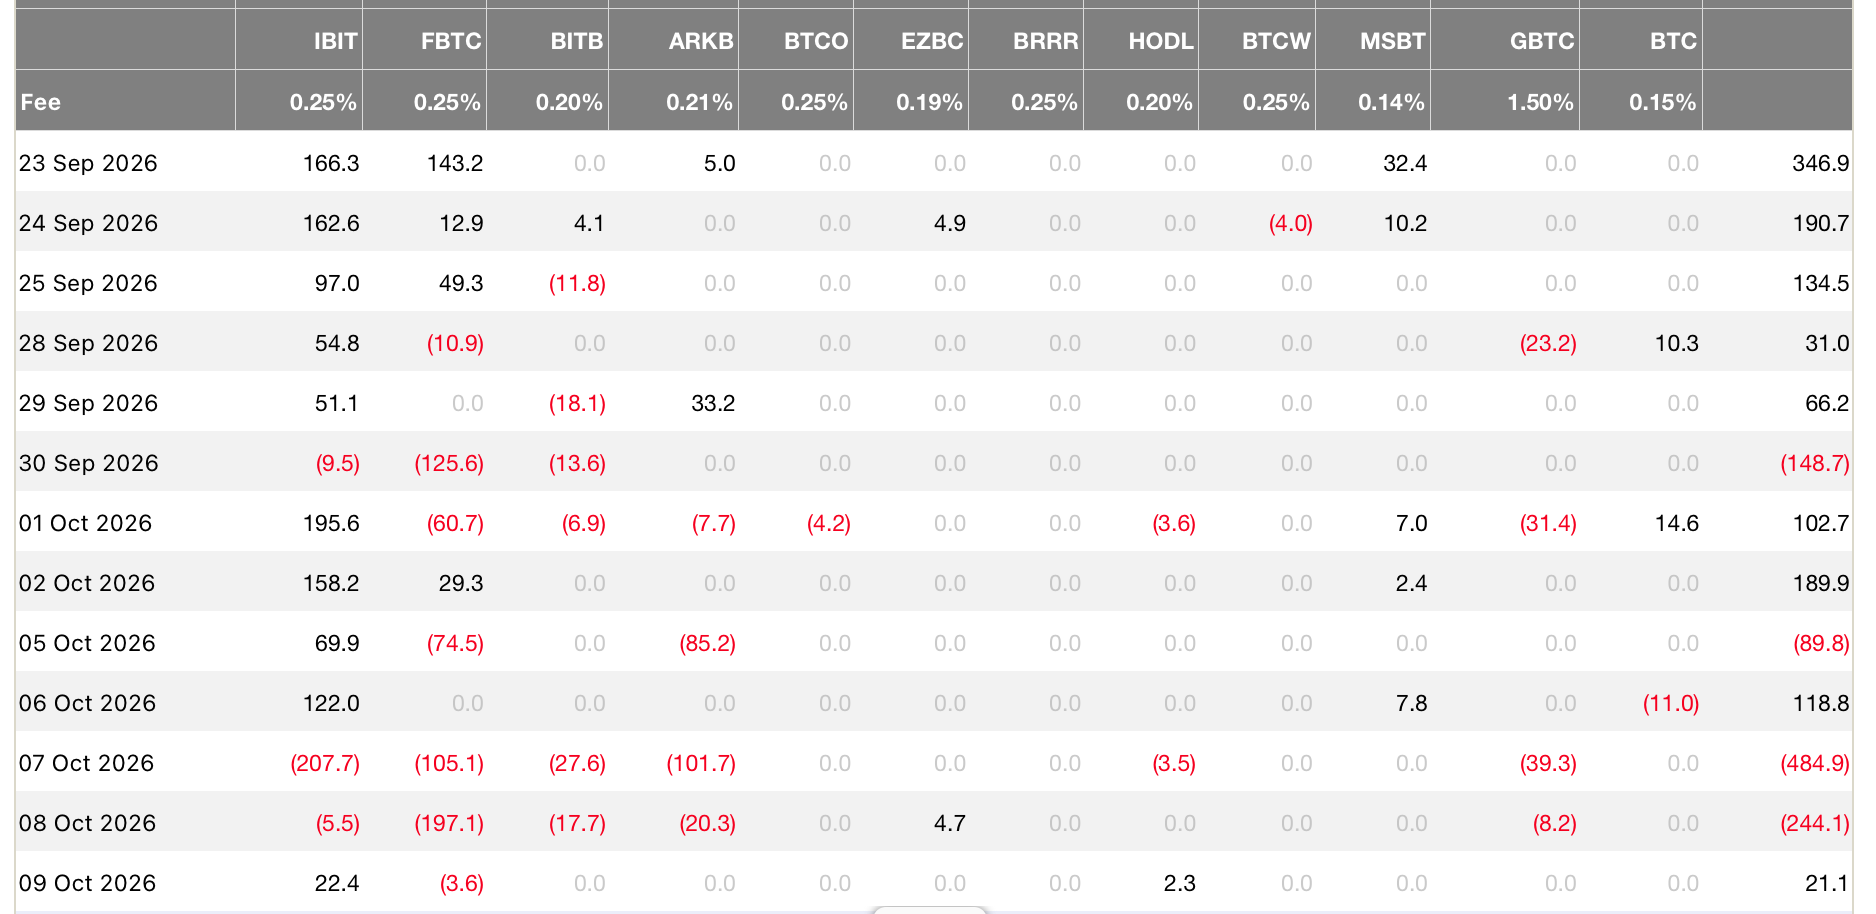
The selling was not broad. BlackRock’s IBIT, the largest fund, ended the week almost exactly flat, while Fidelity’s FBTC lost $380.3 million and ARK’s ARKB lost $207.2 million. This points to a group of investors reducing exposure and not to a general exit from the product.
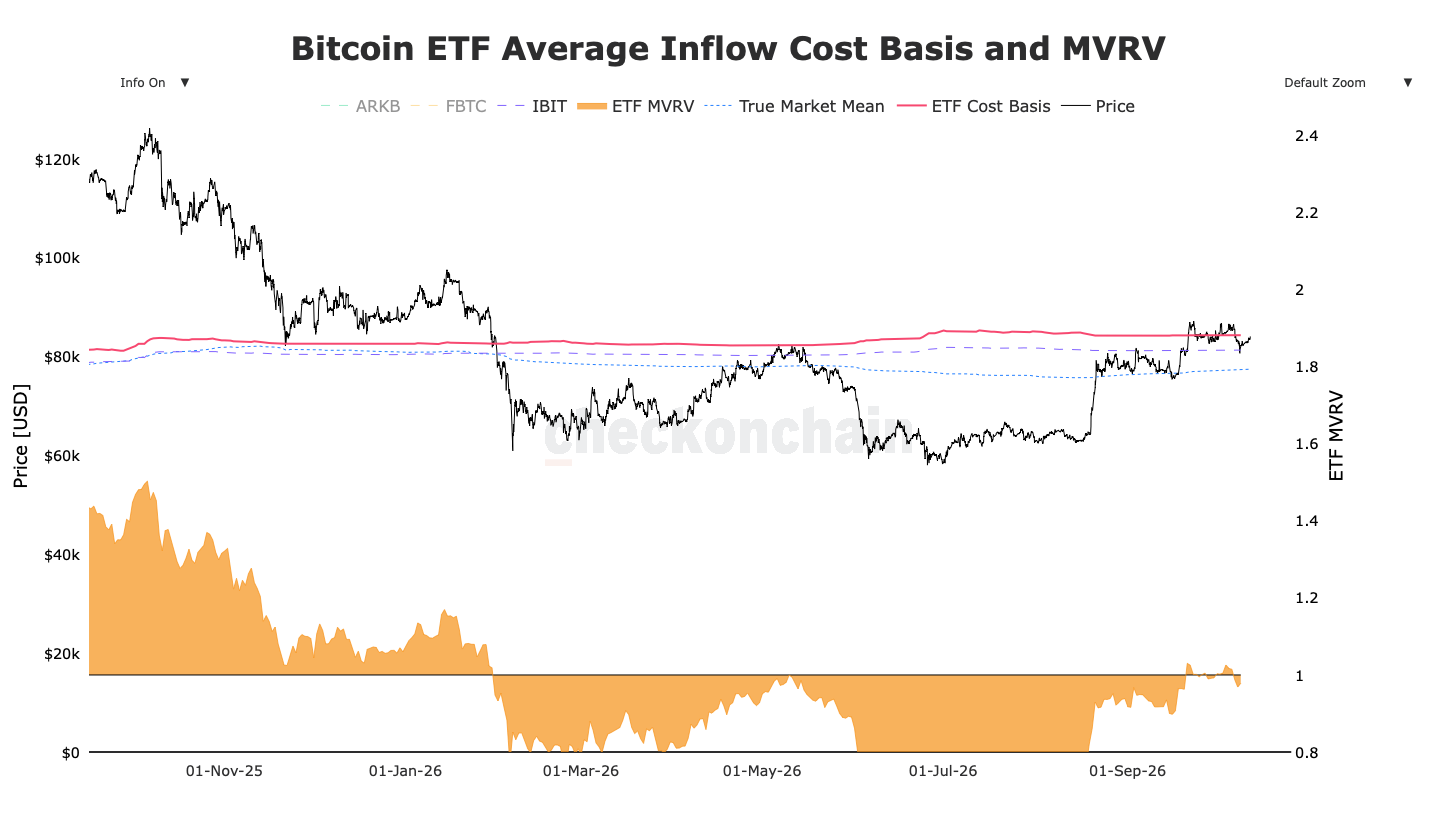
It also happened where we expected ETF demand to be weakest. The average cost of ETF holdings is about $84,340. ETF buying has historically been slow when price is close to that level and faster once holders are clearly in profit. The dynamic level has therefore continued to act as strong support or resistance, depending on whether bitcoin retests the level from above or below. With price now slightly below it, a rally towards $84,340 gives these investors the opportunity to sell without a loss. We expect this to cap price until inflows resume.
For the week ahead, a run of positive sessions, even modest ones, would be enough to support a move back above $84,000. A move through the yearly open would need more, and we continue to use the $340 million daily average of the September advance as the benchmark.

Altcoins Fell Almost Twice as Far as Bitcoin
The decline was sharper outside bitcoin. Over the week, BTC lost 3.1 percent, while ETH fell 6.9 percent, SOL 8.4 percent and XRP 7.2 percent. At the low on 8 October, each of the ten large altcoins we track was down between 12 and 17 percent from the previous weekly close, against seven percent for bitcoin.
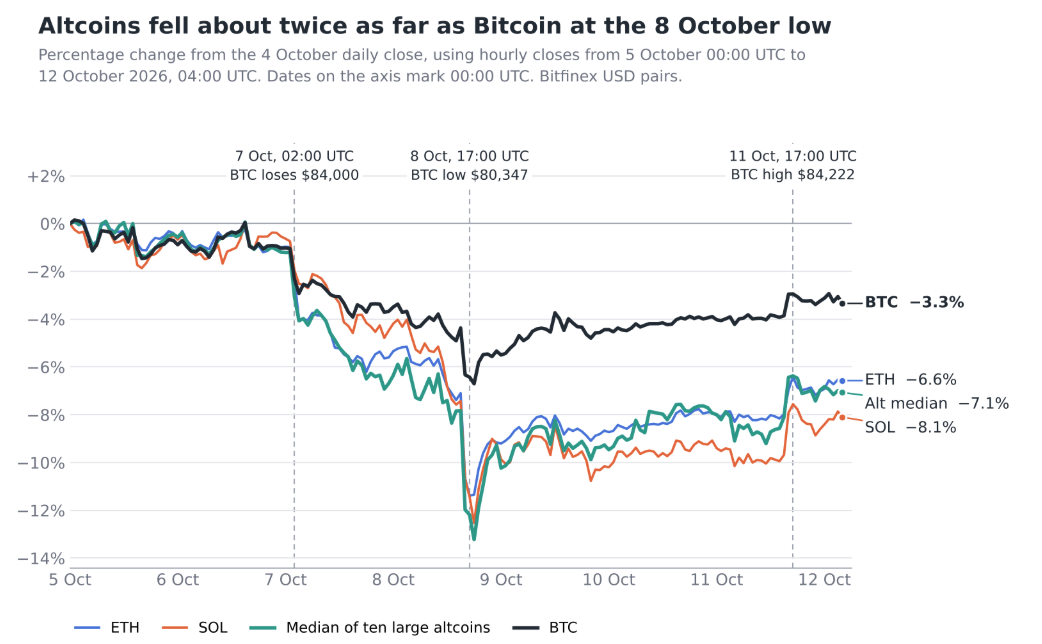
Altcoins usually fall further than bitcoin, but the gap was wider than at any point in this recovery. From high to low, the median altcoin fell 14.8 percent against 7.9 percent for BTC, or 1.9 times as far. In the five earlier pullbacks since July, that ratio was between 1.1 and 1.7.
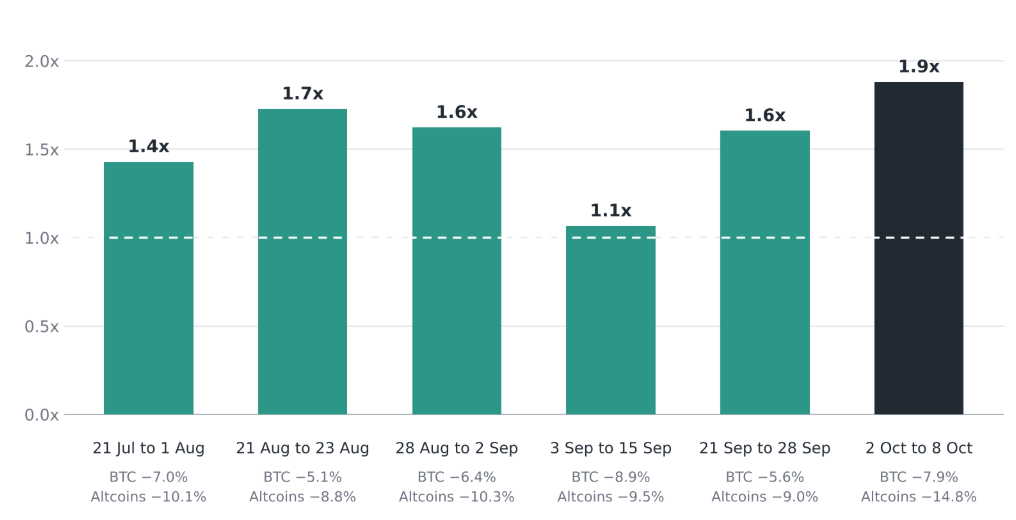
The above measures the median peak-to-trough decline for large altcoins divided by bitcoin’s peak-to-trough decline during each pullback of more than five percent since the 1 July low.
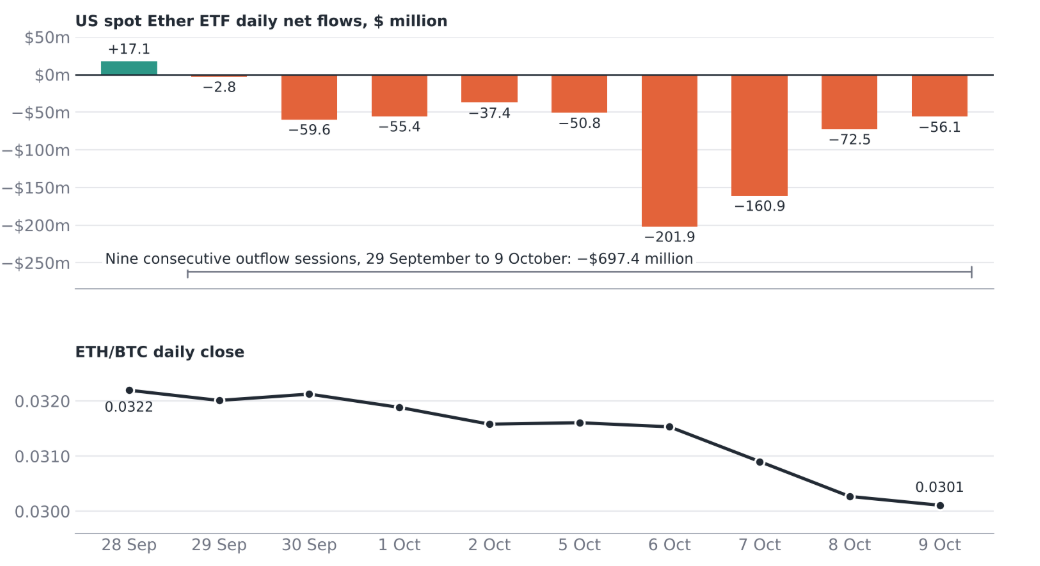
Two factors explain this. The first is leverage. Before the decline, futures positioning in large altcoins, relative to their market value, was at its highest since October 2025. On 8 October more ETH positions were liquidated than BTC positions. The second is the absence of dedicated buyers. US spot Ether ETFs have now recorded nine consecutive sessions of outflows totalling $697.4 million, and Solana ETFs posted their first weekly outflow after 14 weeks of inflows. ETH has lost 6.5 percent against BTC since 28 September.
The recovery has been uneven as well. Bitcoin has regained about half of its peak-to-trough decline, while ETH, SOL and XRP have each regained a little over a third. This does not mean altcoins rebounded less in absolute terms. From the 8 October low, the median altcoin rose 11.1 percent against 4.8 percent for BTC, but having fallen almost twice as far, altcoins remain further below their highs.
This asymmetry has been consistent throughout the recovery. Across the six pullbacks since July, the median altcoin fell 1.6 times as far as bitcoin on average, and in the five rebounds before last week it rose 1.3 times as far. Altcoins have therefore acted as an amplified version of bitcoin in both directions, with more sensitivity to declines than to advances, which is why they lose ground to BTC over a full correction and recovery. The sensitivity also varies by asset. ETH has been the most defensive of the large altcoins, falling 1.2 times as far as BTC on average, compared with about 1.5 times for SOL and XRP and 2.0 times for SUI.
These ratios provide a framework for both outcomes this week. If BTC holds $81,300 and reclaims $84,000, the precedent is for altcoins to rise by more than bitcoin in percentage terms without recovering their relative losses. Confirmation would come from ETH/BTC holding above its 8 October low of 0.0298 and from the nine-session run of Ether ETF outflows coming to an end. If BTC instead loses $81,300 and moves towards the True Market Mean near $77,400, a decline of about seven percent from current levels, the same ratios imply a fall of roughly 11 to 14 percent for the median altcoin.

Catalysts and Risks
Sticky Inflation and Firm Business Investment Keep a Later Rate Hike Alive
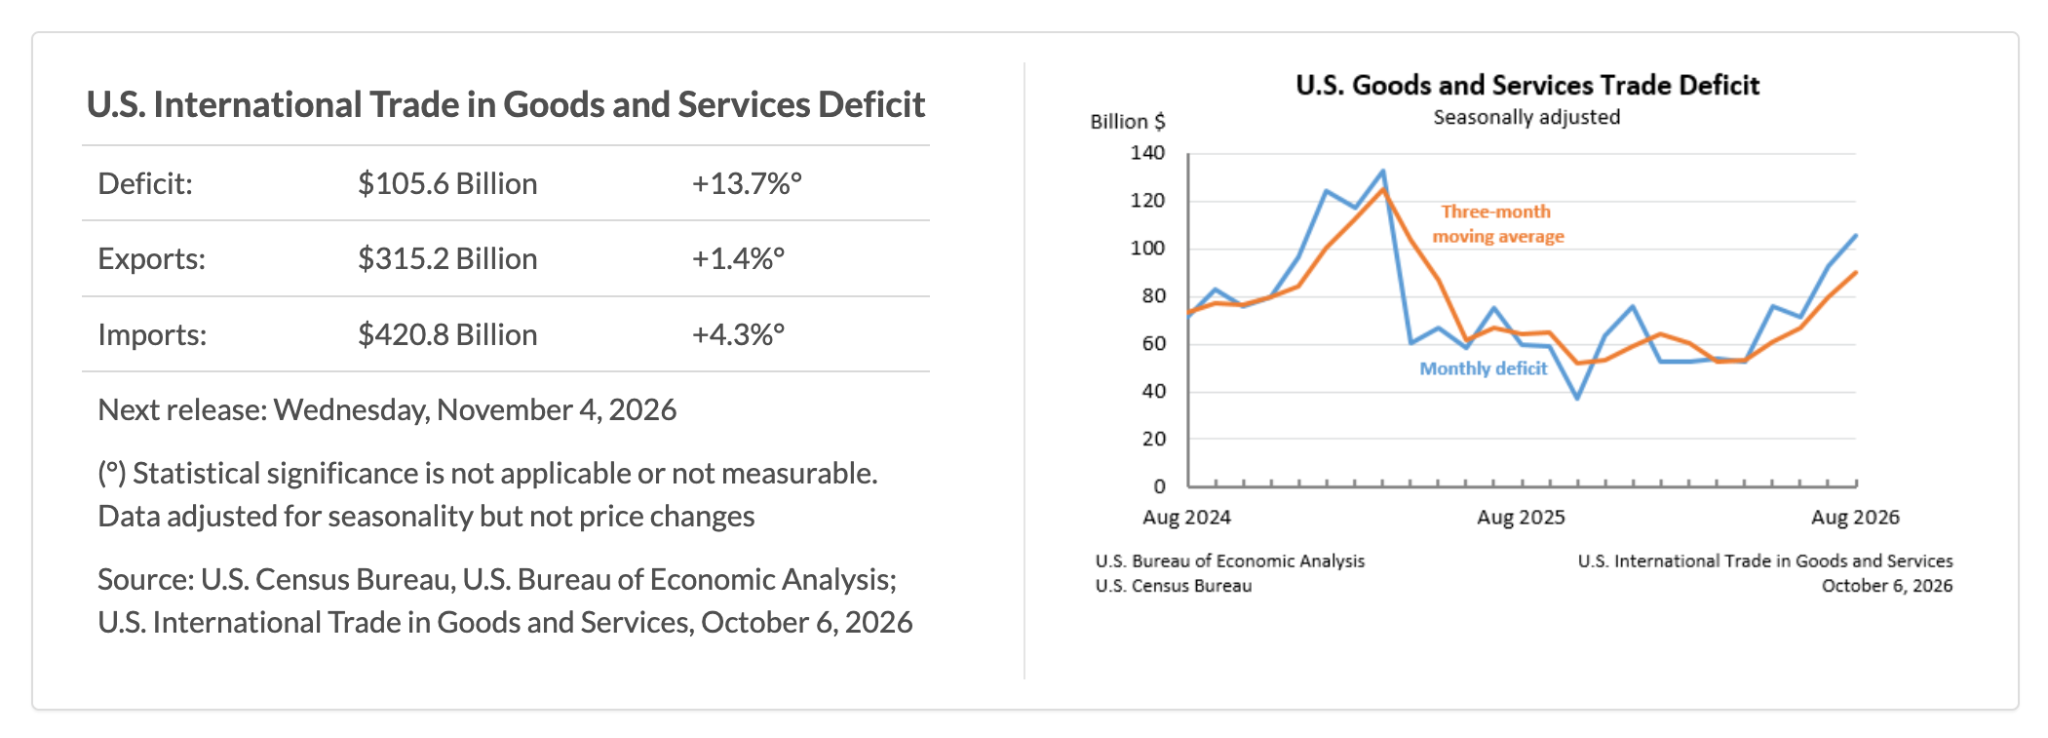
A combination of sticky inflation and resilient business investment keeps a rate hike later this year in play. Core Personal Consumption Expenditures (PCE) inflation is at 3 percent, and August trade data show businesses still buying equipment with tariffs in place: capital goods imports rose $6.2 billion, of which semiconductors accounted for $2.4 billion. The headline trade deficit widened to $105.6 billion from a revised $92.8 billion in July, but that overstates demand, because crude oil ($3.3 billion) and gold ($3.1 billion) made up much of the $17.2 billion rise in imports. The importer pays the tariff, so it raises the cost of that investment without stopping it. It adds to the fuel and freight costs already keeping goods inflation elevated, and a policy rate cannot remove it.
The Atlanta Fed’s GDPNow model, a running estimate built from incoming data, put third-quarter growth at 3.6 percent annualised on 8 October. An economy growing at that pace with core PCE inflation at 3 percent gives the Fed no reason to stand down. Minutes of the September meeting, published on 7 October, show most officials judged that another increase “would likely be appropriate by year end”.
The transmission into crypto runs through that expectation. A rate hike still ahead holds short-term yields and the dollar up and limits the liquidity reaching risk assets, bitcoin included. The view weakens if import prices on 16 October fall, which would show foreign suppliers absorbing the tariff.
The September CPI report will be released on Wednesday 14 October and is the last reading on consumer inflation before the Federal Reserve meets on 27 and 28 October. Economists expect headline inflation to rise to 3.6 percent on the year from 3.4 percent. Markets currently price about a 20 percent chance of a rate increase in October and about 70 percent by December.
A higher-than-expected reading would raise the odds of an October increase and push Treasury yields up. For bitcoin, the test in that case is whether ETF outflows resume and whether $81,300 holds a second time. A lower-than-expected reading would reduce the October risk. Even then, the last three weeks have shown that good macro news lifts bitcoin only when spot buyers follow it.

Mortgage Rates Are Rising While Broad Financial Conditions Stay Loose
Mortgage rates are rising while financial conditions remain loose overall, which leaves the Fed free to raise rates again and keeps the return bitcoin competes with high.
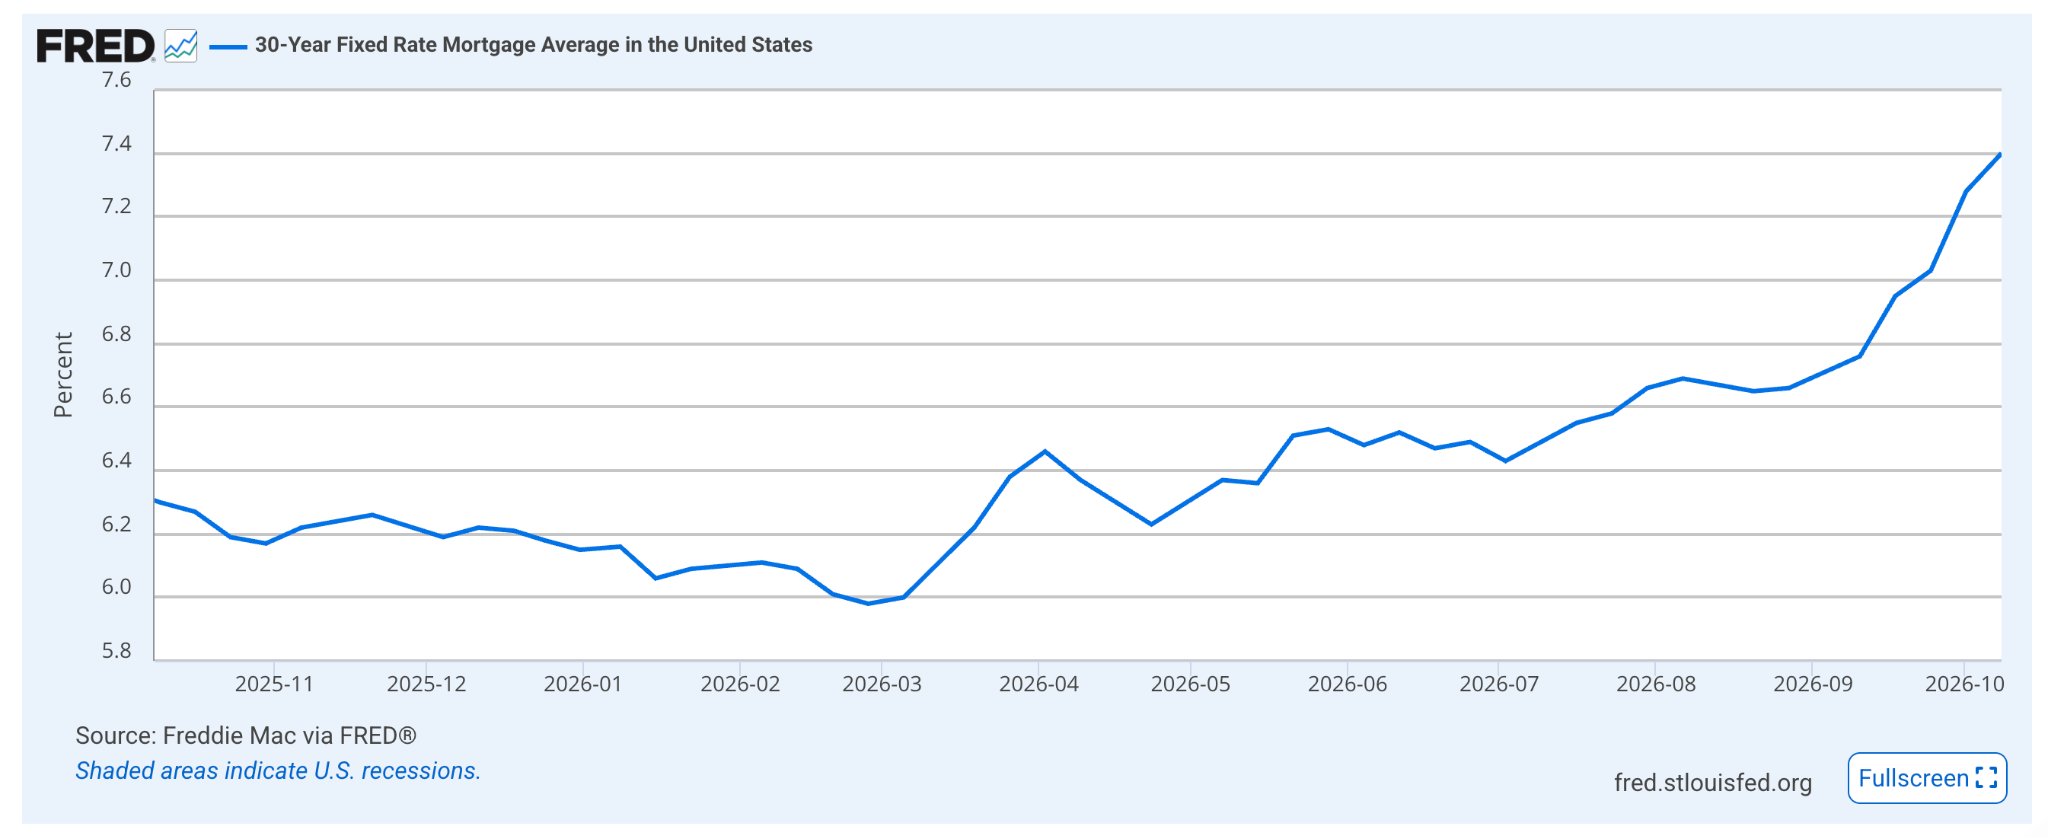
The 10-year Treasury yield closed at 5.24 percent on 9 October, little changed from 5.28 percent a week earlier, but the borrowing costs tied to it kept climbing. The 30-year fixed mortgage rate reached 7.40 percent in Freddie Mac’s 8 October survey, up from 7.03 percent two weeks earlier and 6.30 percent a year ago, with no change in the policy rate. In late September we said the pressure on housing would ease if the mortgage rate fell below 6.75 percent and stayed there for two weeks. It has instead risen in every weekly survey since.
For bitcoin, what matters is the 10-year inflation-adjusted Treasury yield, the return a low-risk asset pays after inflation and the hurdle bitcoin has to beat. It closed at 2.91 percent on 9 October. Whether the Fed raises rates or the bond market does the tightening for it, that return stays high. The headwind eases if it falls back towards 2.5 percent and intensifies if it holds above 3 percent.
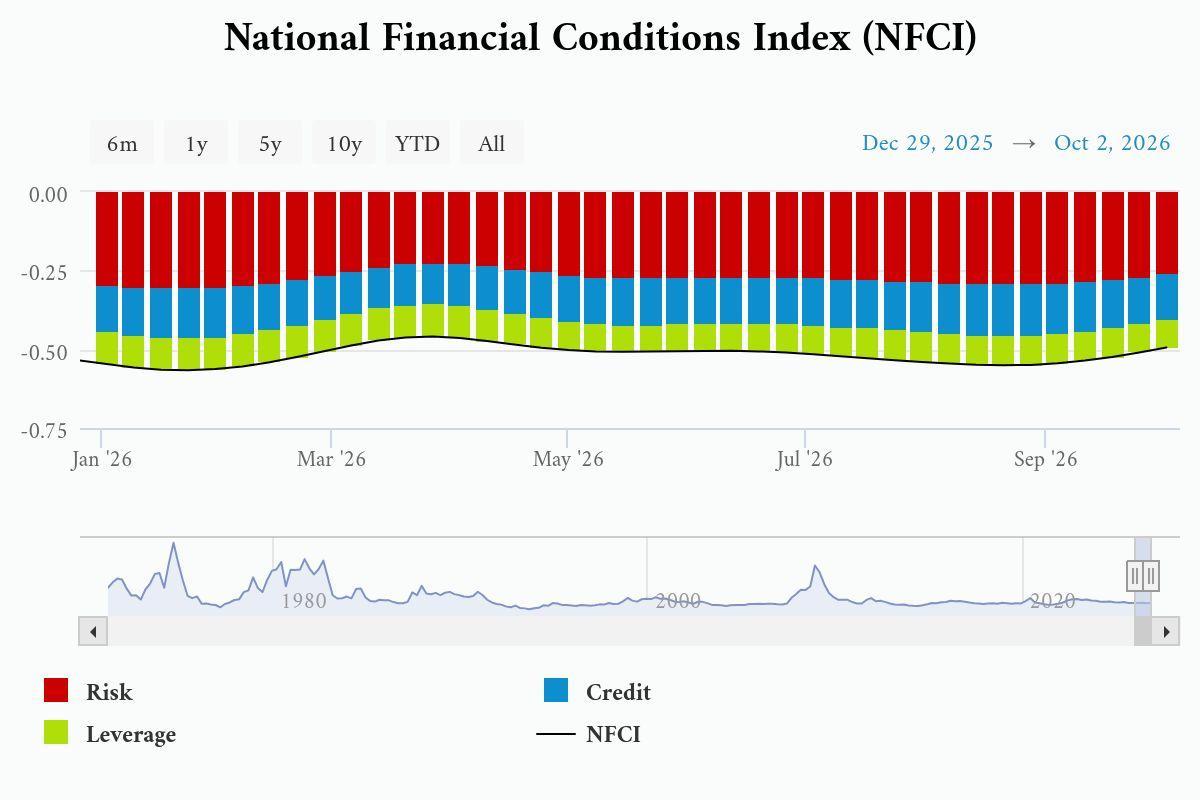
The Chicago Fed National Financial Conditions Index — a weekly gauge of how easy it is to borrow across money, debt and equity markets — stood at -0.494 in the week to 2 October, against -0.545 a month earlier. A reading below zero means conditions are looser than average, and a move towards zero means they are tightening. Conditions have therefore tightened slightly over the month but remain loose overall. Mortgage rates have risen, but higher equity prices and narrow corporate bond spreads — the small extra yield companies pay over Treasuries — keep the broad index loose. The Fed reads it the same way: the minutes record many officials describing conditions as “supportive of economic growth” despite higher long-term yields. The risk to our view of a rate hike later this year is that the index keeps rising towards zero. That would mean markets are tightening conditions by themselves, which gives the Fed room to wait.

Outlook for the Week
Base Case
We expect bitcoin to trade between $81,300 and $84,500 until the CPI release on 14 October. The retest of the former range high was successful, leverage is low and selling pressure is limited, so we do not expect a deeper decline without a new catalyst. Rallies are likely to stall between $84,000 and $84,500. ETF investors are close to their entry price, supply sits just above the market and the inflation-adjusted Treasury yield remains high, so any advance has to be driven by spot buying. The recovery is intact, and the timing of its next leg depends on spot demand.

What Would Confirm It
Price: Bitcoin holding above $81,300 and below $84,500, with any brief move under $81,300 recovered within the same session.
Flows: ETF sessions that return to small net inflows, well under the $340 million daily average of the September advance.
Positioning: Funding close to zero and open interest flat, showing that leverage is not being rebuilt.
On-chain: STH-SOPR at or above 1.0, meaning recent buyers are not selling at a loss.
Macro: Core consumer prices rising 0.3 percent on the month and the 10-year inflation-adjusted Treasury yield holding near its current level, which keeps the rate outlook unchanged.

What Would Invalidate It
An earlier recovery: Bitcoin trading back above $84,500 alongside consecutive positive ETF sessions would show that demand has returned sooner than we expect. The likeliest macro trigger is core consumer prices at 0.2 percent or less, with the inflation-adjusted yield falling towards 2.5 percent. Short positions are concentrated between $86,500 and $87,300, so a move of this kind would be likely to extend towards the $87,722 yearly open.
A second loss of $81,300: Trading below $81,300 for more than a single session, with renewed ETF outflows and short-term holder SOPR below 1.0 for several days, would show that last week’s buyers are giving up. The True Market Mean near $77,400 would be the next level of support. A brief dip that reverses within the session would not count.
A macro shock: A CPI reading well above expectations, a further rise in oil prices or the inflation-adjusted yield holding above 3 percent would put $81,300 at risk before flows have had time to recover.

What to Watch
Daily ETF flows: Monday 12 October brings the first flow figure since the retest. Bond markets are closed for Columbus Day, but ETFs trade as normal.
September CPI, Wednesday 14 October, 12:30 UTC: The event most likely to end the range in either direction. The monthly core reading is the one that moves the rate outlook.
Producer prices and retail sales, Thursday 15 October: A second reading on inflation and a check on household demand.
Freddie Mac mortgage rates and Chicago Fed financial conditions, Thursday 15 October: Another rise in the mortgage rate would show the tightening is still building.
Import prices and Fed Chair Warsh, Friday 16 October: Import prices show how much of the tariff cost foreign suppliers are absorbing. Warsh’s remarks are his first after the CPI release.
