Chart Decoder Series: SuperTrend: The Signal Behind a Changing Trend On August 19, Bitcoin ripped through $67,000 and set off the largest single-day short squeeze in Bitcoin’s history — over… 03 September, 2026
Chart Decoder Series: Rate of Change: How Traders Measure Momentum Behind A Move Few things frustrate traders more than a false breakout. You sell the breakdown, only to watch the price recover yet… 11 August, 2026
Chart Decoder Series: Donchian Channels: How Traders Spot Breakouts Bitcoin has rebounded from its late June lows, climbing back above $64,000 even as the Bitcoin treasury company Strategy, began… 14 July, 2026
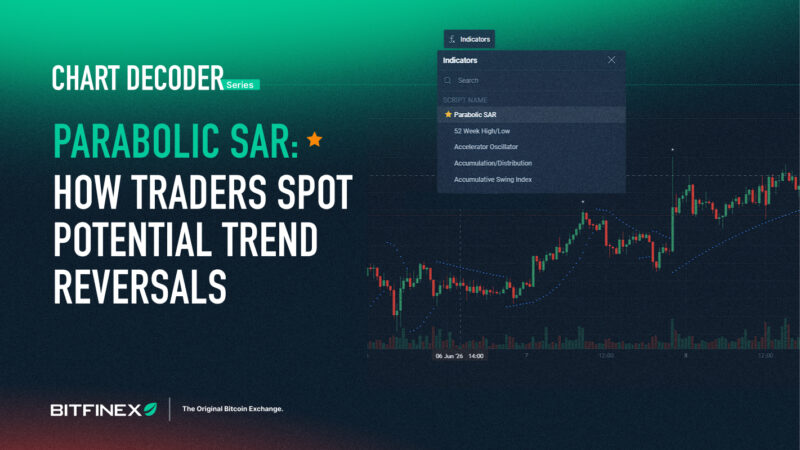
Chart Decoder Series: Parabolic SAR: How Traders Spot Potential Trend Reversals Bitcoin’s recent slide from above $82,000 to $59,200 has been one of the sharpest corrections of the year. As ETF… 09 June, 2026
Chart Decoder Series – Volume Profile Fixed Range: How This Move Was Built BTC is under pressure. After repeated rejections from the $80K to $83K region, price has now broken lower and is… 22 May, 2026
Chart Decoder Series: Volume Profile – Where the Market Actually Trades BTC pushed above $79K, breaking out of a two-month range and printing its highest levels since early February. The move… 29 April, 2026
Chart Decoder Series: Chaikin Money Flow – The Net Capital Inflow Indicator Bitcoin’s latest move higher was triggered by one key catalyst: the temporary Middle East ceasefire. The easing of geopolitical risk… 09 April, 2026
Chart Decoder Series: Money Flow Index – Catch Buying Pressure Before Price Moves Welcome back to the Chart Decoder Series, where we simplify the tools traders use to understand market behaviour and master… 20 March, 2026