

Issue #215:
BTC Stalls as Demand Thins
Energy and Inflation Could Change BTC's Outlook
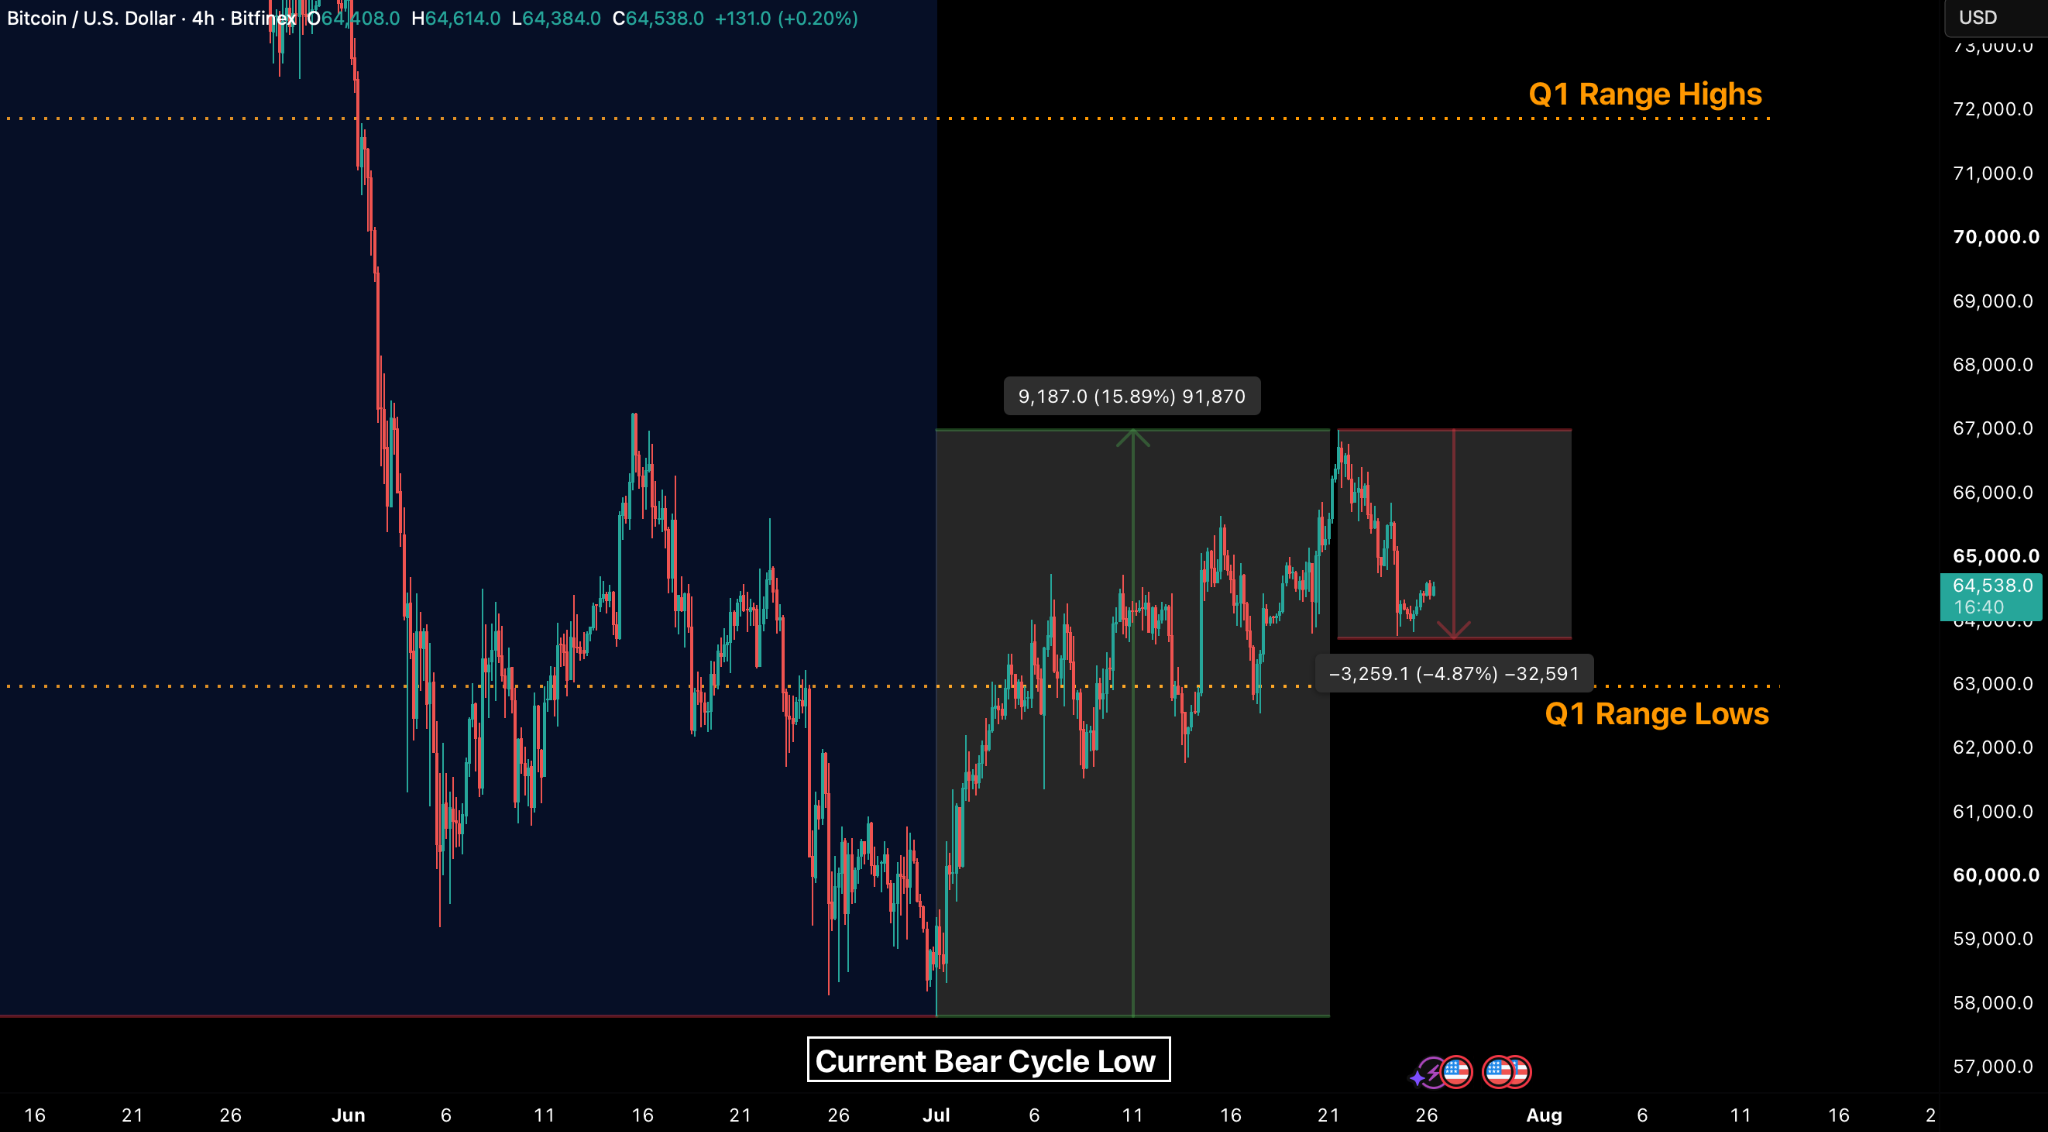
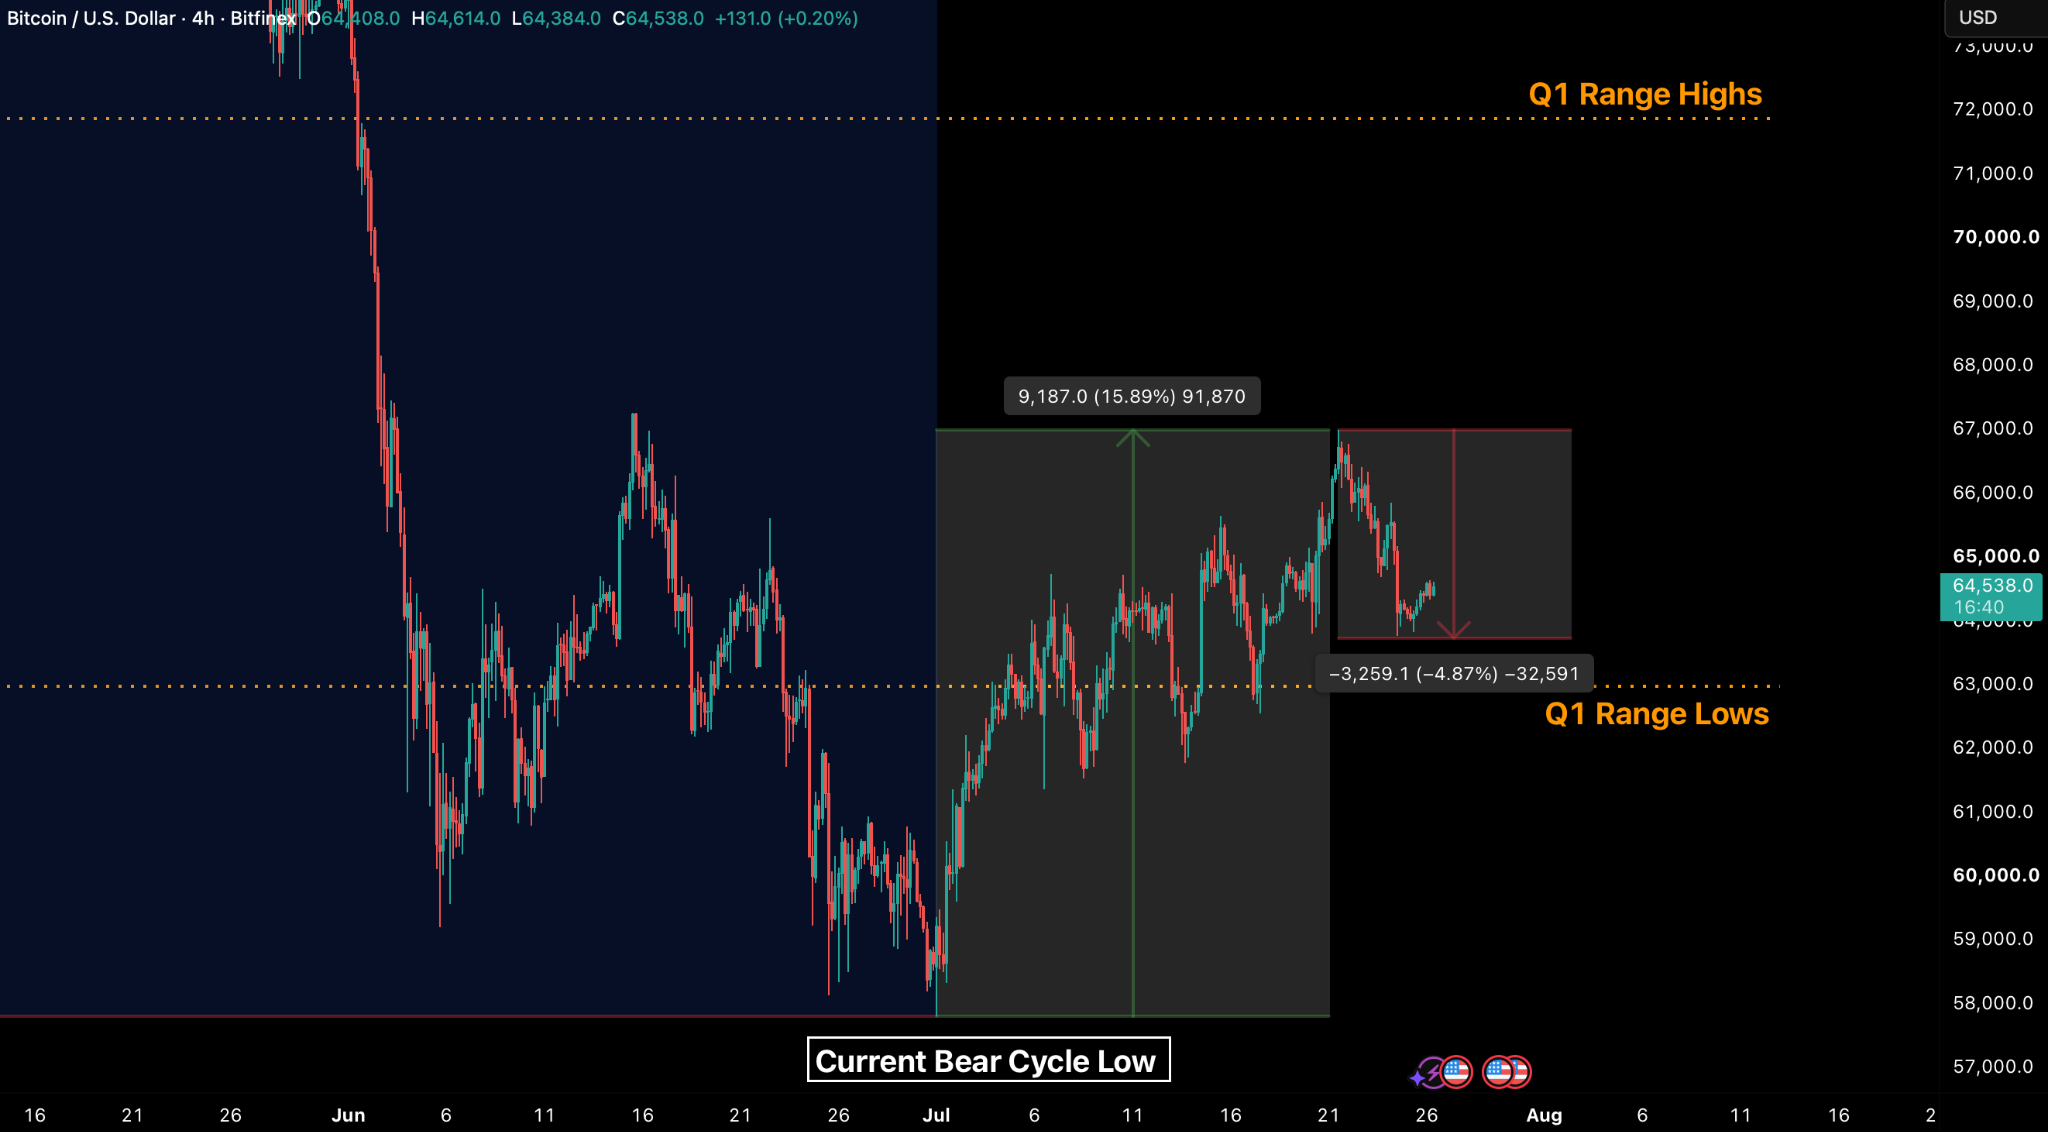
Bitcoin entered this week with the strong positioning shift that has characterised the market in July: shorts have folded, hedges have unwound and ETF flows have stayed positive for a third consecutive week, though with a heavy intra-week reversal. There is evidence of real overhead supply: a 4.87 percent pullback in the latter half of last week, as short-term holders sold at or near breakeven into strength.
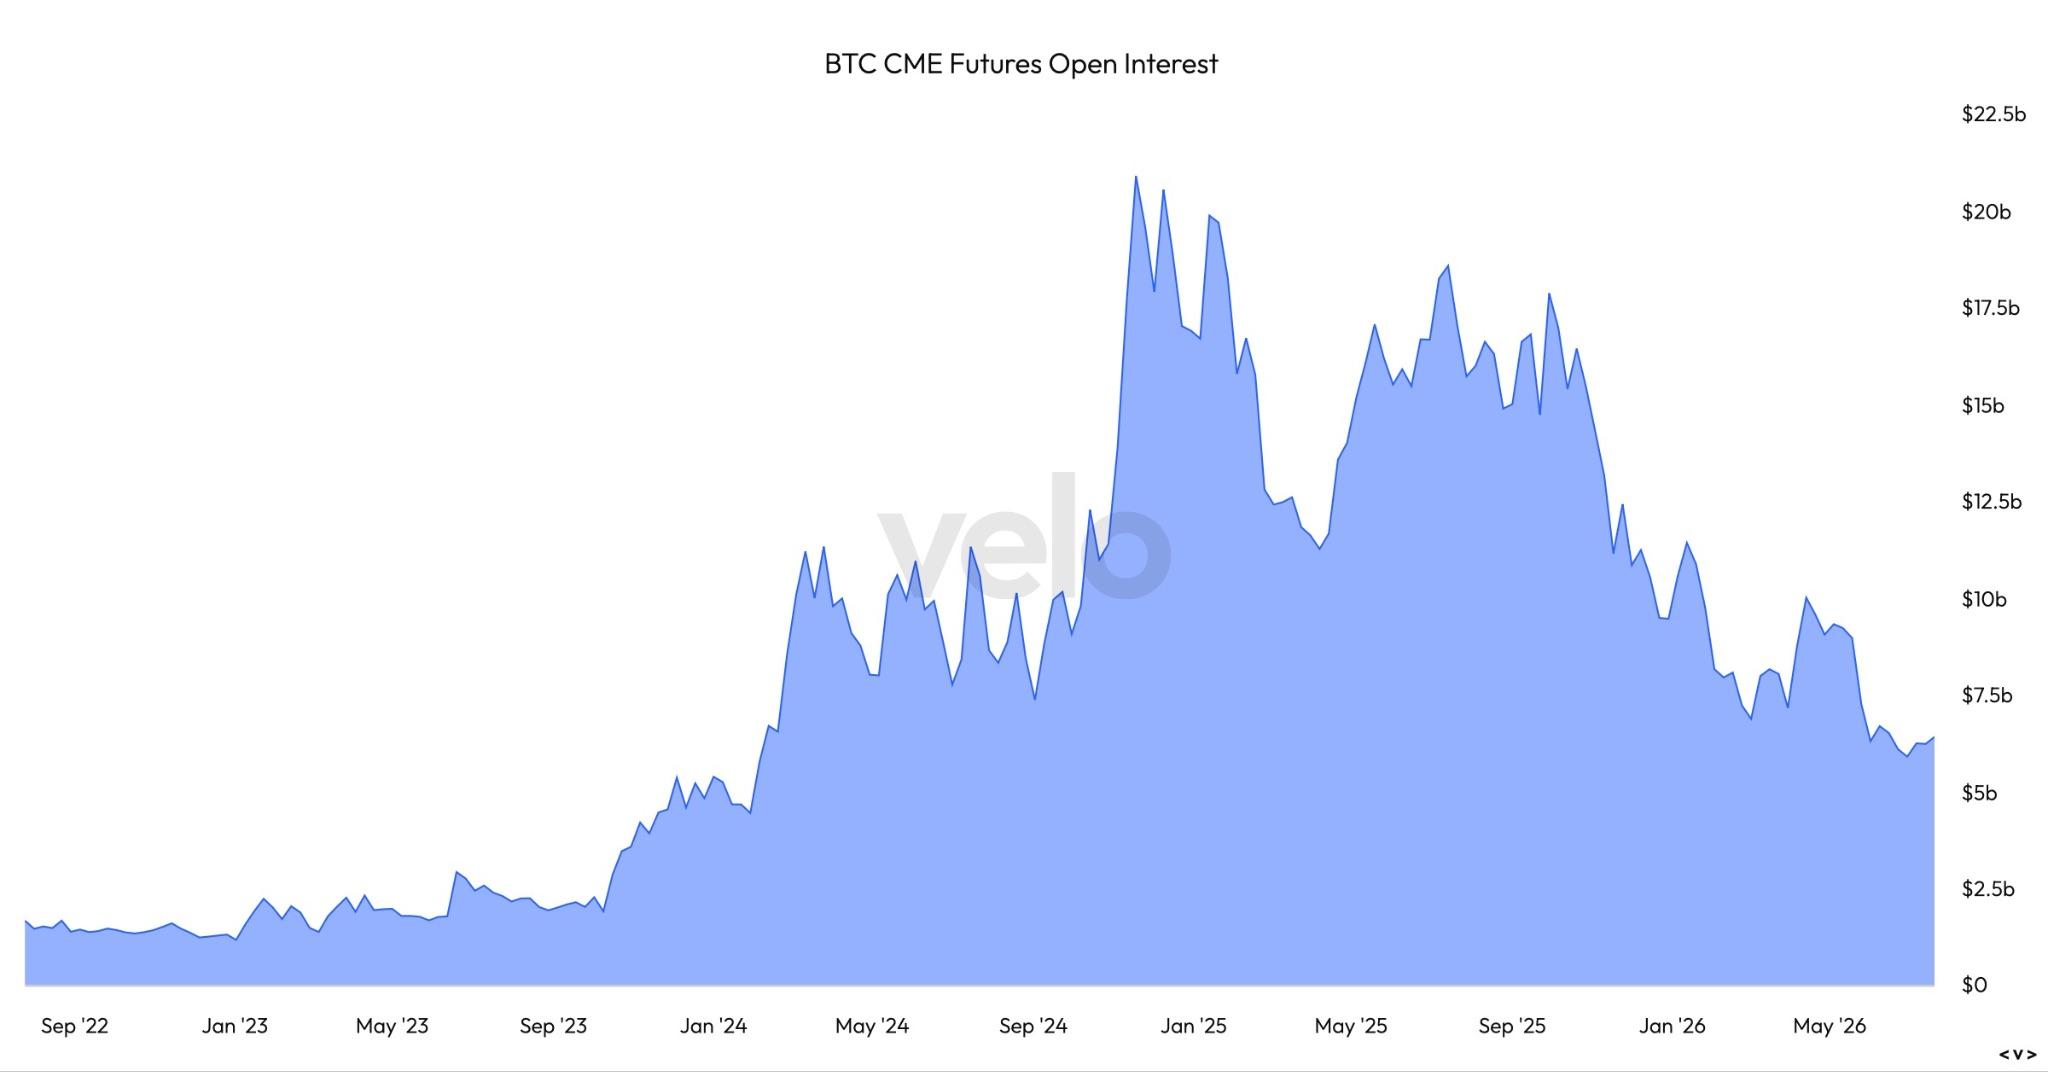
The selling matters because of what it did to the structure overhead. For a month, the short-term holder cost basis had been decaying, drifting towards spot as fresh buyers stepped in and pulled the average lower. That decay stopped this week at $68,500 as new sellers changed the equation. Institutional interest is at multi-year lows, with both CME bitcoin futures and options open interest falling to record lows. Meanwhile, the “summer slumber” has kept the market macro-dependent and reactive. A move above the $68,000–$68,500 resistance band now requires fresh demand, as the cost-basis band is no longer falling towards spot, while ETF and treasury-company flows remain too weak to carry price through that band.
We also look at how rising US diesel prices are pushing up transport, food and production costs, which could keep inflation elevated even if crude prices fall. Low inventories and global supply disruptions may prolong the pressure.
This price shock is shifting Federal Reserve policy expectations. Strong labour data, firmer business activity and higher price pressures have raised the risk of a more hawkish policy stance. The Fed is still expected to hold rates, but markets are now testing that view. A rate rise, or a sustained move in the 10-year real yield above 2.5 percent, would weaken the current constructive outlook for bitcoin.
Market Signals
Bitcoin Price Remains Stable But Positioning Shifts
After a late Sunday surge, bitcoin closed the week up 1.05 percent, marking the fourth consecutive positive weekly close for the asset and the first time this has happened since April. The story of the week was a Tuesday high at $66,990. This was followed by three red sessions from Wednesday, a pullback catalysed potentially by the inflows into BTC ETFs reversing, triggering a price drop of 4.87 percent from local highs. The Tuesday high put BTC up 15.9% from the $57,803 cycle low of 1 July, and it remains up 11.67 percent for the month so far. As of now, our forecast for a stronger July has held.
Even though prices dropped mid-week, the fade did not contain forced selling. Bitcoin liquidations totalled roughly $87 million on Friday, the worst day of the week; futures open interest held flat at $48.6 billion; funding never left neutral; and the Bitfinex margin book ended the week within 10 BTC of where it started. Even though ETF flows reversed after a streak of consecutive net inflow sessions, the pullback so far hasn’t been in line with previous positioning unwinds which have led to cascading liquidations and a highly volatile move down.
Indeed current market conditions are the quietest tape of 2026 so far, especially in terms of institutional flows. 30-day spot volumes are at 62.4 percent of their annual average and CME open interest (OI) has fallen below $6 billion for the first time since February 2024.
It is also important to note that the market is not just being afflicted by institutional disinterest, but also lower trading volumes and liquidity, which each summer has a seasonality effect on crypto.
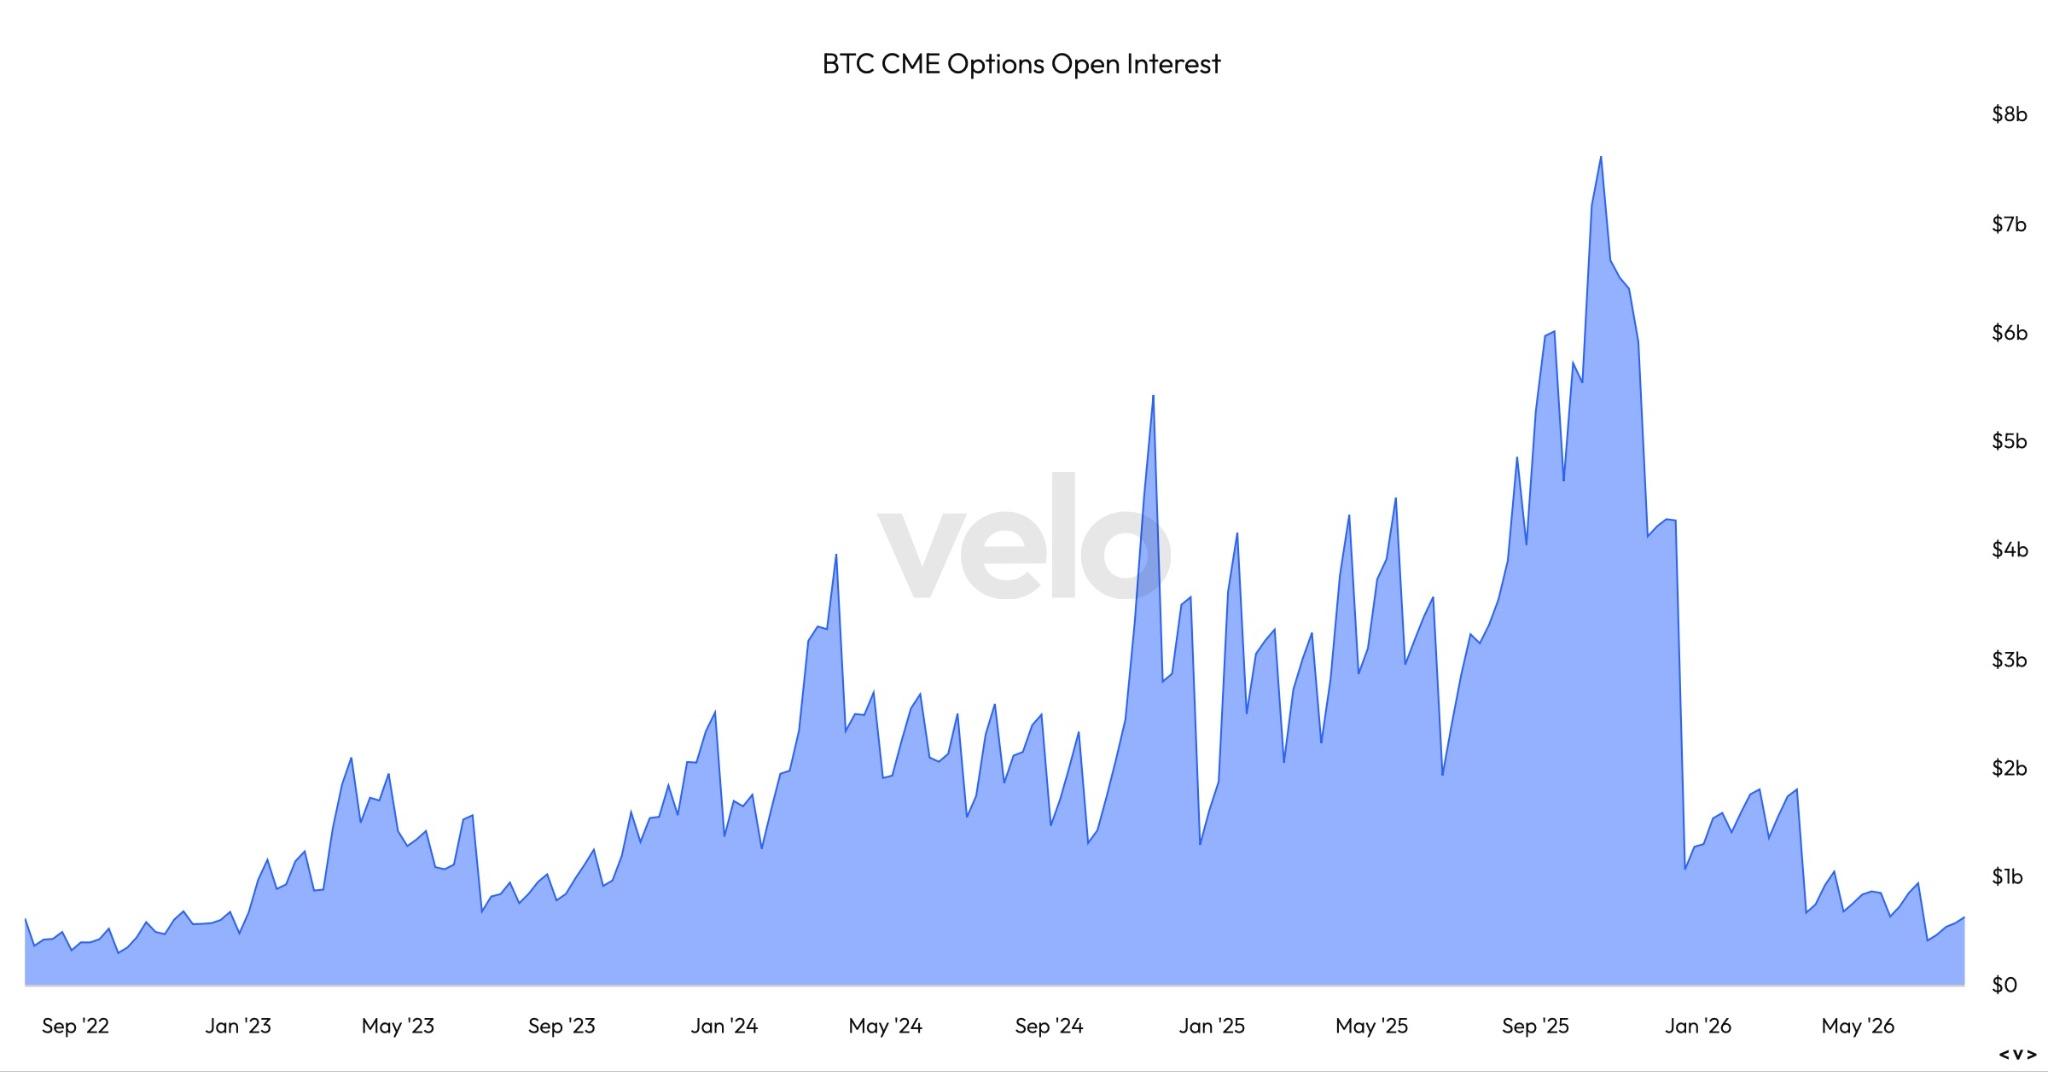
BTC and Ether options OI has also plummeted on CME, with BTC options OI reaching a low of $408 million last week, the lowest since September 2023.
One of the core reasons behind this is that funding has remained consistently low throughout the year. Annualised basis on BTC has remained under 5.5 percent, only moving above that threshold once during the mid-May move above $80,000. This has significantly discouraged institutions from participating in the BTC carry trade, thus leading to a cycle of lower liquidity and lower basis, in a constantly reinforcing negative spiral. On higher timeframes, OI has remained relatively stable over the past two weeks and basis has recovered to 5.5 percent on aggregate from a late June low of 3-4 percent across exchanges.
US spot Bitcoin ETFs recorded a third consecutive net-inflow week last week, at $33.9 million, but the weekly total conceals the significant reversal in flows that occurred during the week.
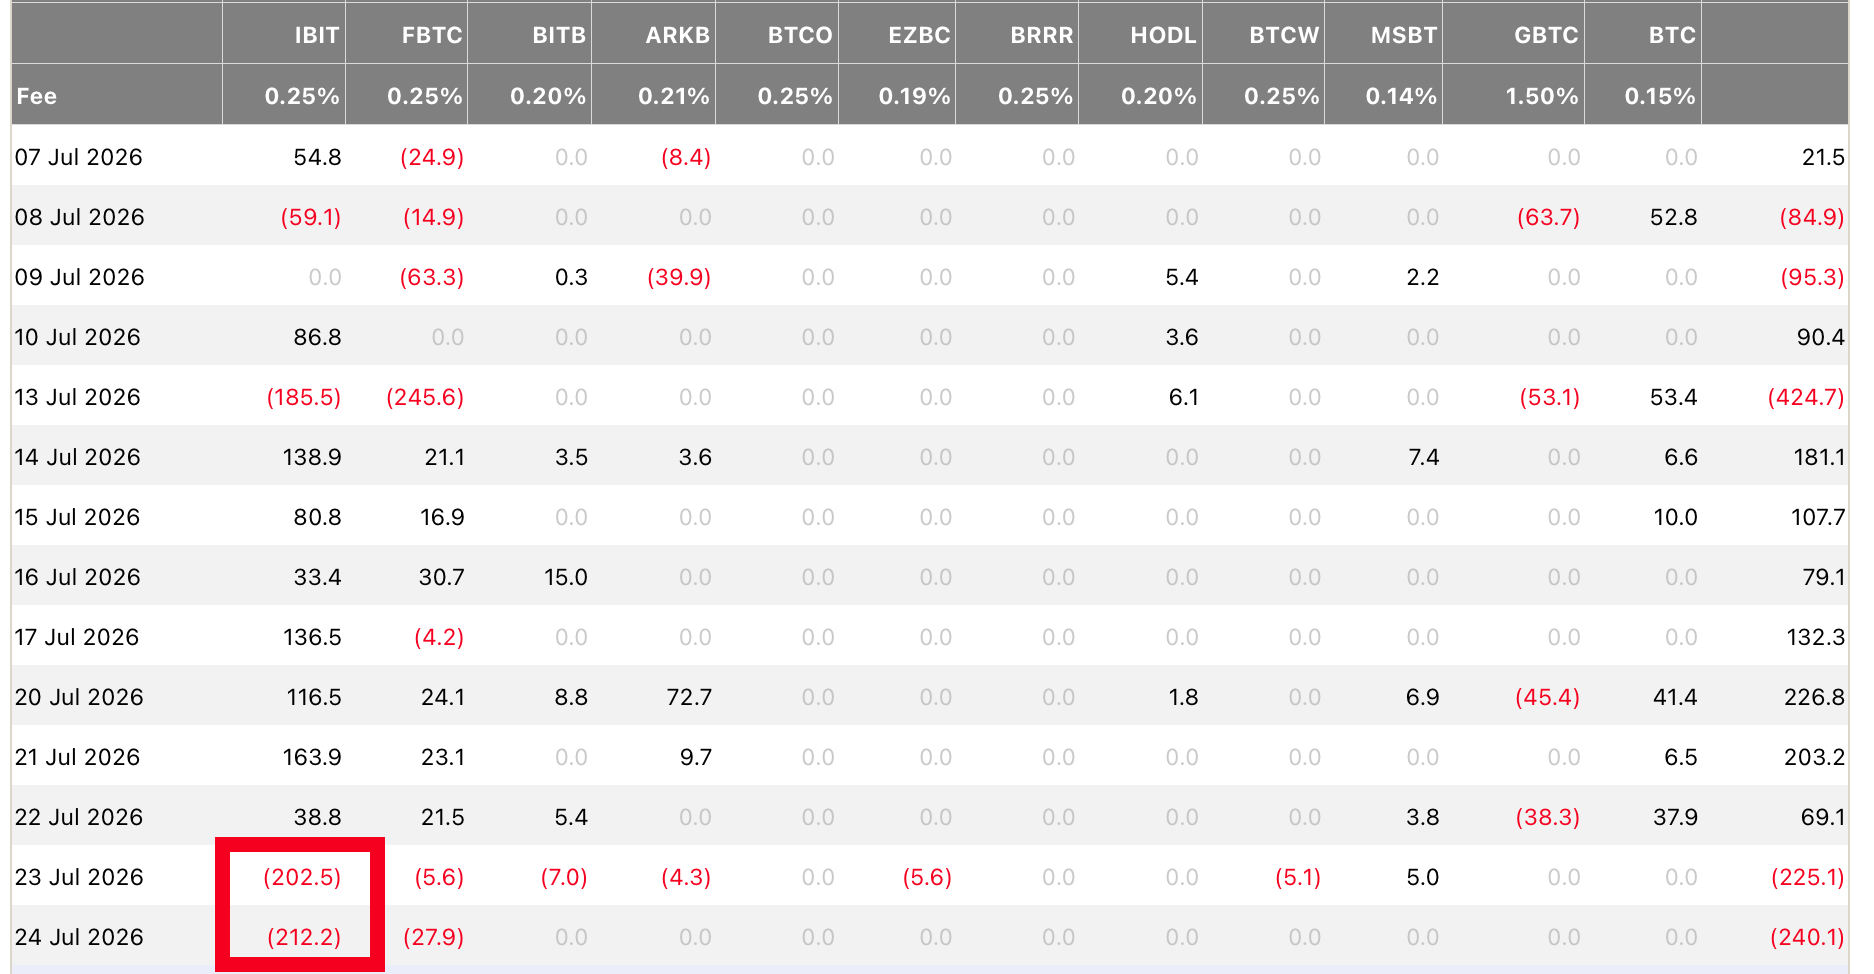
The seven-session run, the largest inflow streak since January, began on 14 July and brought in $999.3 million. That was followed by $465.2 million in outflows across Thursday and Friday, the heaviest two-session redemption since the end of June.
Composition and timing together explain what the headline cannot. IBIT, the BTC ETF that has historically carried new institutional capital into the complex, posted back-to-back outflows above $200 million and finished the week $95.5 million negative, its first net-outflow week of the recovery, while the rest of the complex added $129.4 million; the prior week the split ran the other way, IBIT positive $204.1 million against ex-IBIT redemptions of $128.6 million. Due to a lack of the basis trade as an option currently for institutional investors, we believe this reversal was a reaction to the current macro environment. This is in line with our ongoing view that the BTC risk asset environment is heavily macro-dependent.
Two consecutive weeks of opposite one-way traffic between the same wrappers, with the complex total barely positive both times, is the signature of capital rotating between vehicles rather than new capital arriving. The timing points in the same direction: the outflows began on Thursday, within hours of the jobless claims print that repriced the Fed, repeating the one-day-lag response we documented around the 14 July CPI release in our recent Intelligence Update: The Borrowed Bid. A bid that consistently moves the day after macro dat is reacting to conditions, not price agnostic or fundamental for the asset class. Until recent buyers are in the money on aggregate, we believe this fluctuation on flows will continue to mark $68,000 as a strong resistance level.
The US-demand data behind not only BTC ETFs but also ETPs and treasury funds in general supports the read on the market being in “summer slumber” with low volumes and transitory flows in a macro dependent environment. The Coinbase Premium Index, which indicates the taker demand (aggression from market orders) from ETPs and funds and has been a proxy for institutional demand aggression for BTC for the past two years, has been negative for a record run of more than 60 consecutive trading days.
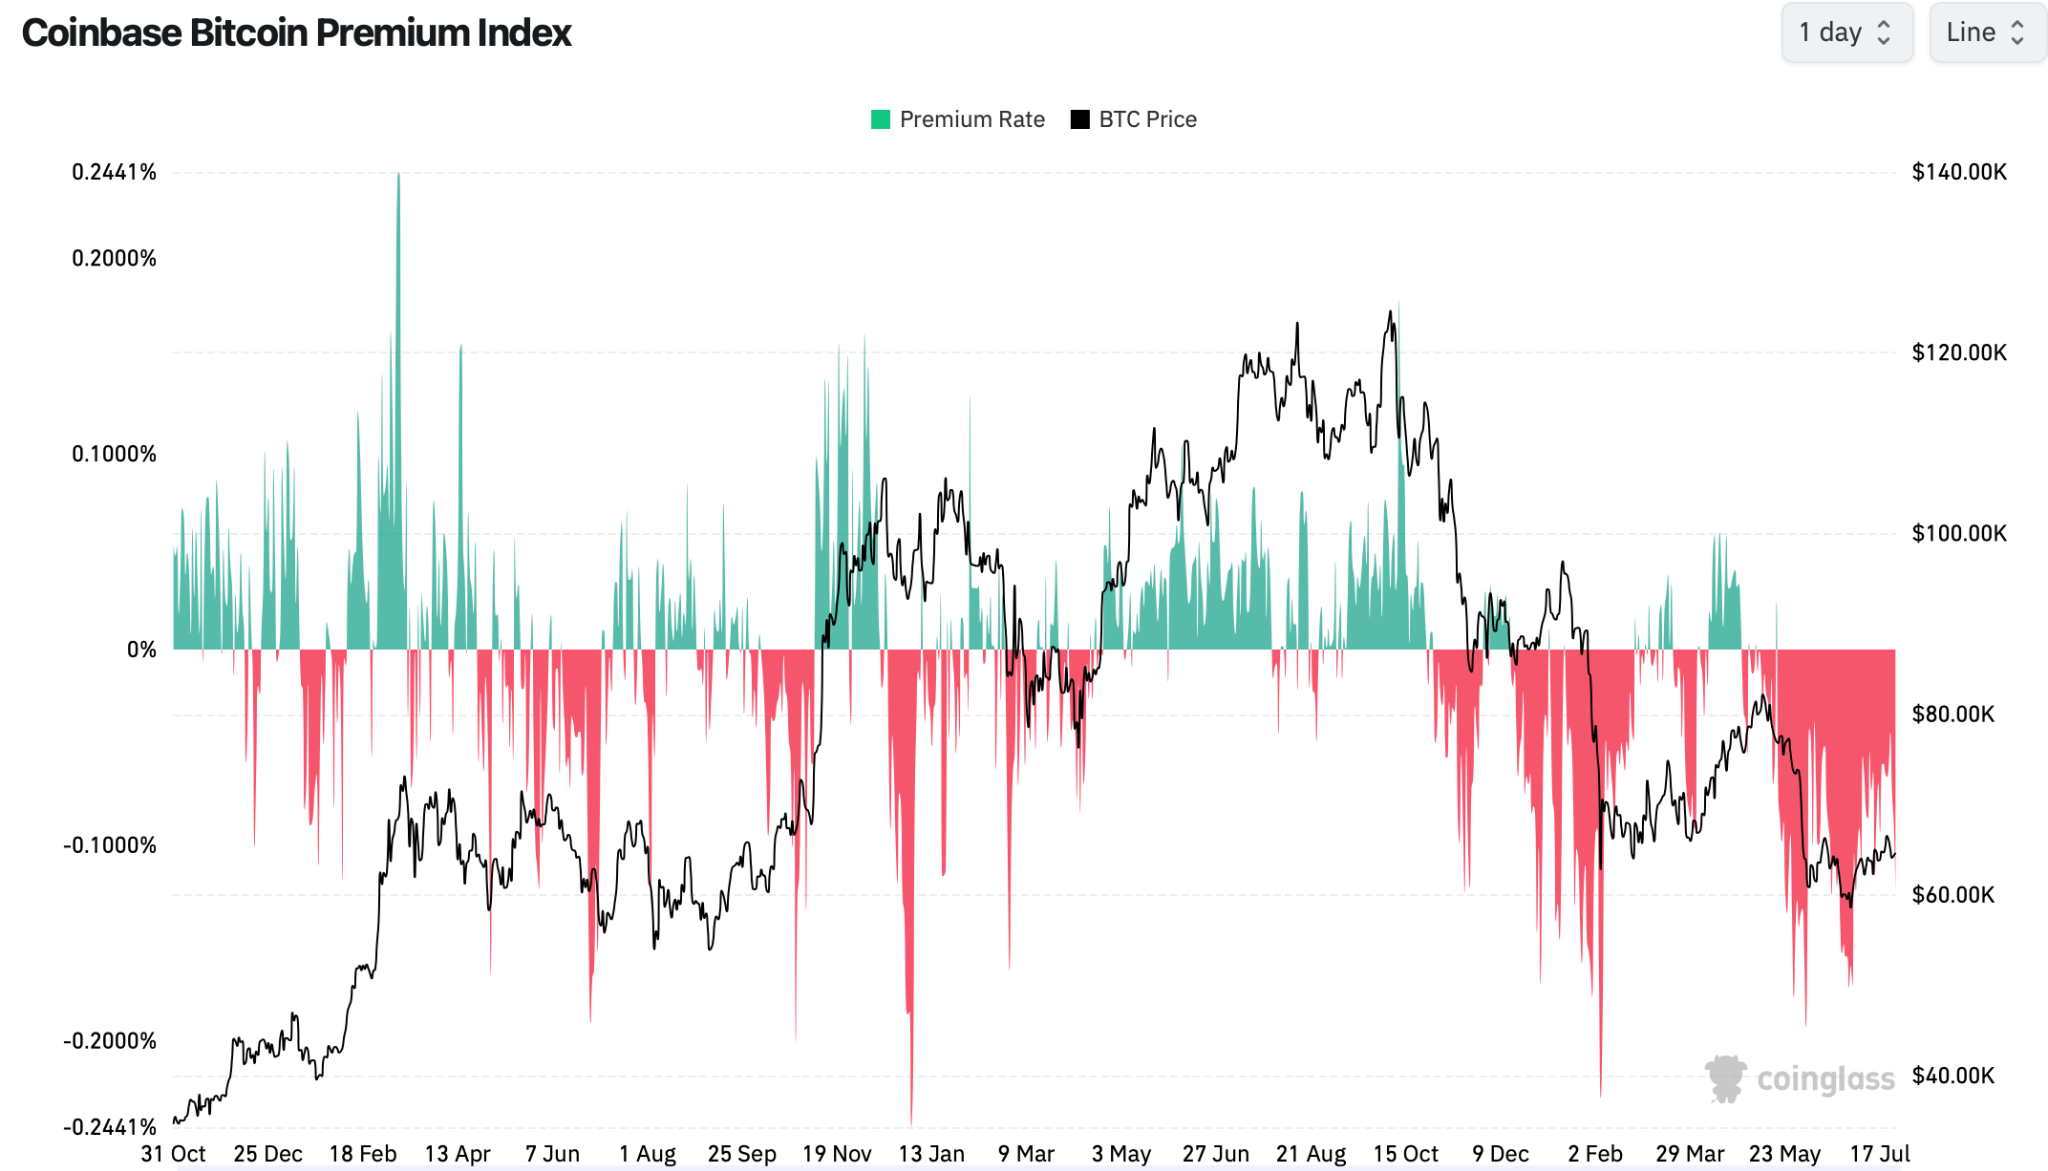
At the same time, large-holder deposits to exchanges are scarce and the whale exchange inflow momentum indicator flipped negative last week. Weak demand meeting absent supply produces exactly the market July has delivered: a low-volume grind that responds to external catalysts while still being confined to higher timeframe range extremes.
The rotation towards Ether also continued: spot Ether ETFs collected $103.8 million against Bitcoin’s $33.9 million, out-performing its BTC counterparts for a second consecutive week, with ETHA alone adding $96.3 million.
The structural story for BTC and crypto in general remains the same, heading into FOMC this week. The first resistance that could define the mid-timeframe trend is the Short-Term Holder Cost Basis near $68,500, representing the aggregate break-even level for participants over the previous 155 days. Directly below the current price lies the market’s primary demand shelf, where roughly 10 percent of supply is concentrated at a $63,000 median transfer price, while the foundational Realized Price floor sits much lower.
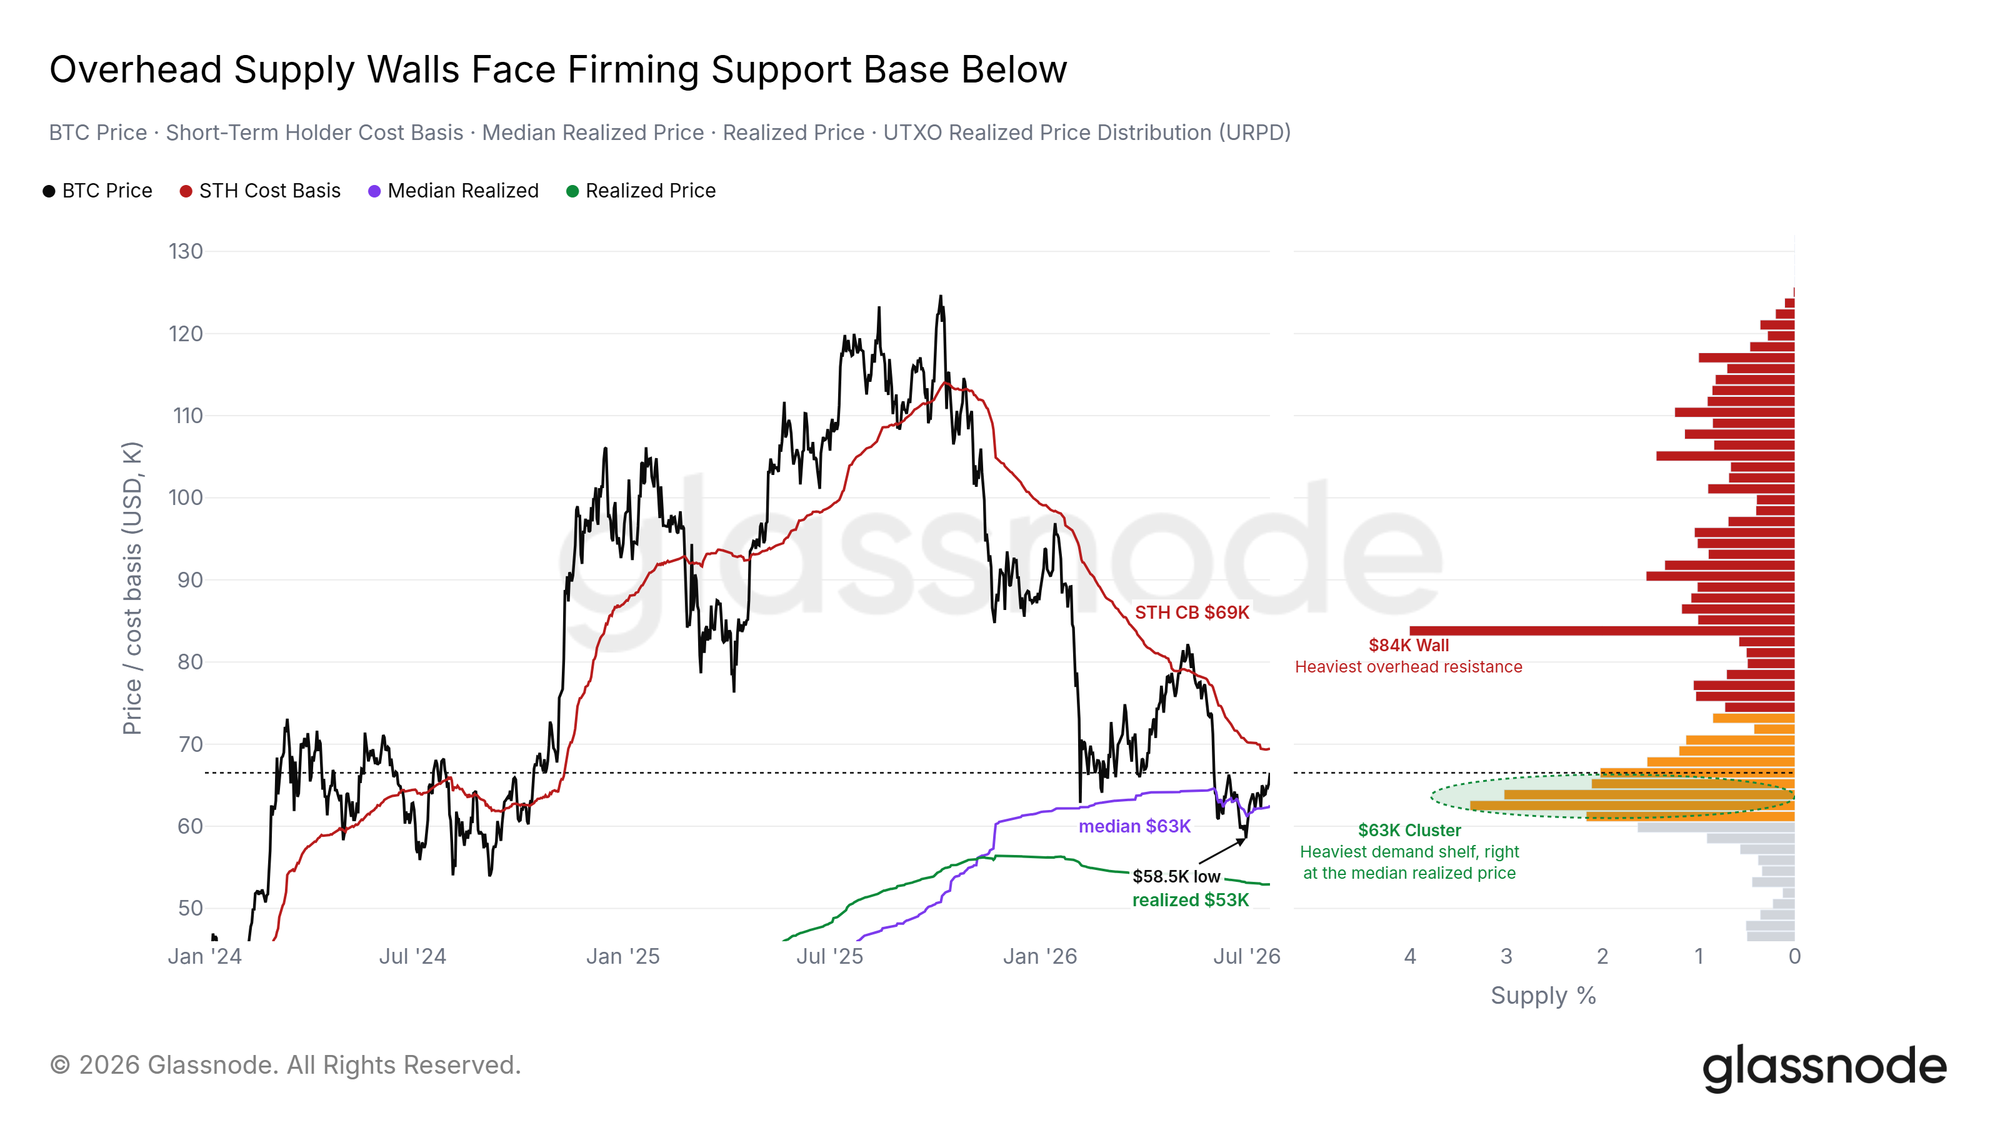
There is significant structural resistance at the $68,500 level, and as prices rise toward break-even, many investors will likely sell to exit at parity. If the price clears this barrier, volume analysis points to an “air pocket” before the next major resistance at $84,000, similar to the one that led to rapid price expansion during the mid-May move from $67,000 to $80,000+. Reclaiming the $68,000–$68,500 range could clear the way for further gains. Conversely, failing at this level may lead to a retest of current bear market lows, potentially toward the $53,200 Realized Price.
General Macro Update
The Diesel Shock Could Keep US Inflation Higher
Rising diesel prices are increasing the cost of producing and moving goods across the US economy. The pressure could keep food inflation elevated and weaken business margins even if crude oil prices begin to fall.The timing matters as much as the mechanics: this cost pressure is rebuilding days before the Federal Reserve’s 28-29 July meeting, and it is through the Fed that the diesel shock reaches Bitcoin.
The July Consumer Price Index (CPI), which the US Bureau of Labor Statistics will release in August, will show whether these higher costs have started to reach customers.
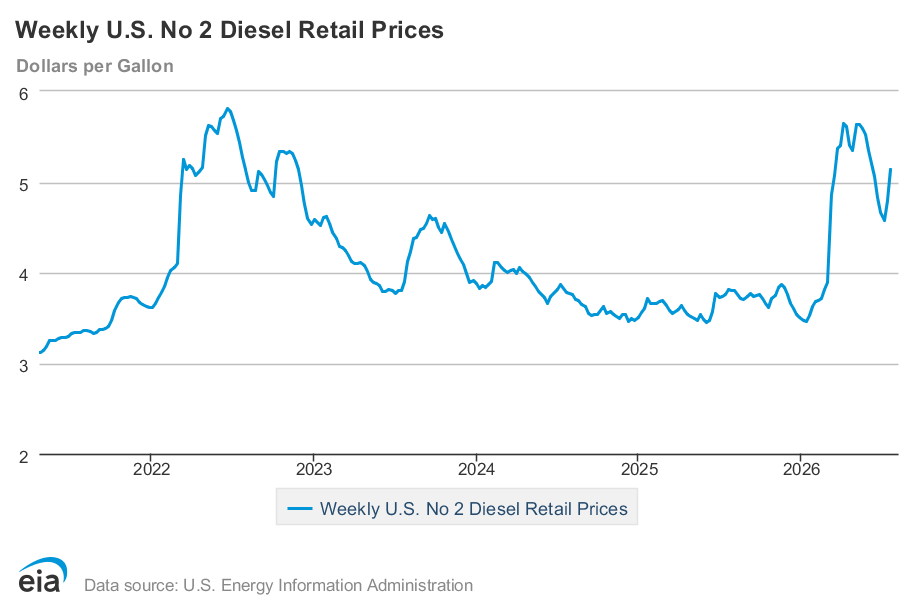
The US average retail price of diesel rose to about $5.13 per gallon during the second week of July. This remained below the peak of $5.64 recorded on 6 April, but the elevated price shows that fuel markets remain exposed to supply disruption.
Diesel poses a wider economic risk than petrol because businesses use it throughout the supply chain. Trucks move goods between ports, farms, warehouses and shops, while farm equipment, fishing vessels and refrigerated transport also depend on the fuel. When diesel prices rise, transport providers often pass the cost to wholesalers and retailers within days.
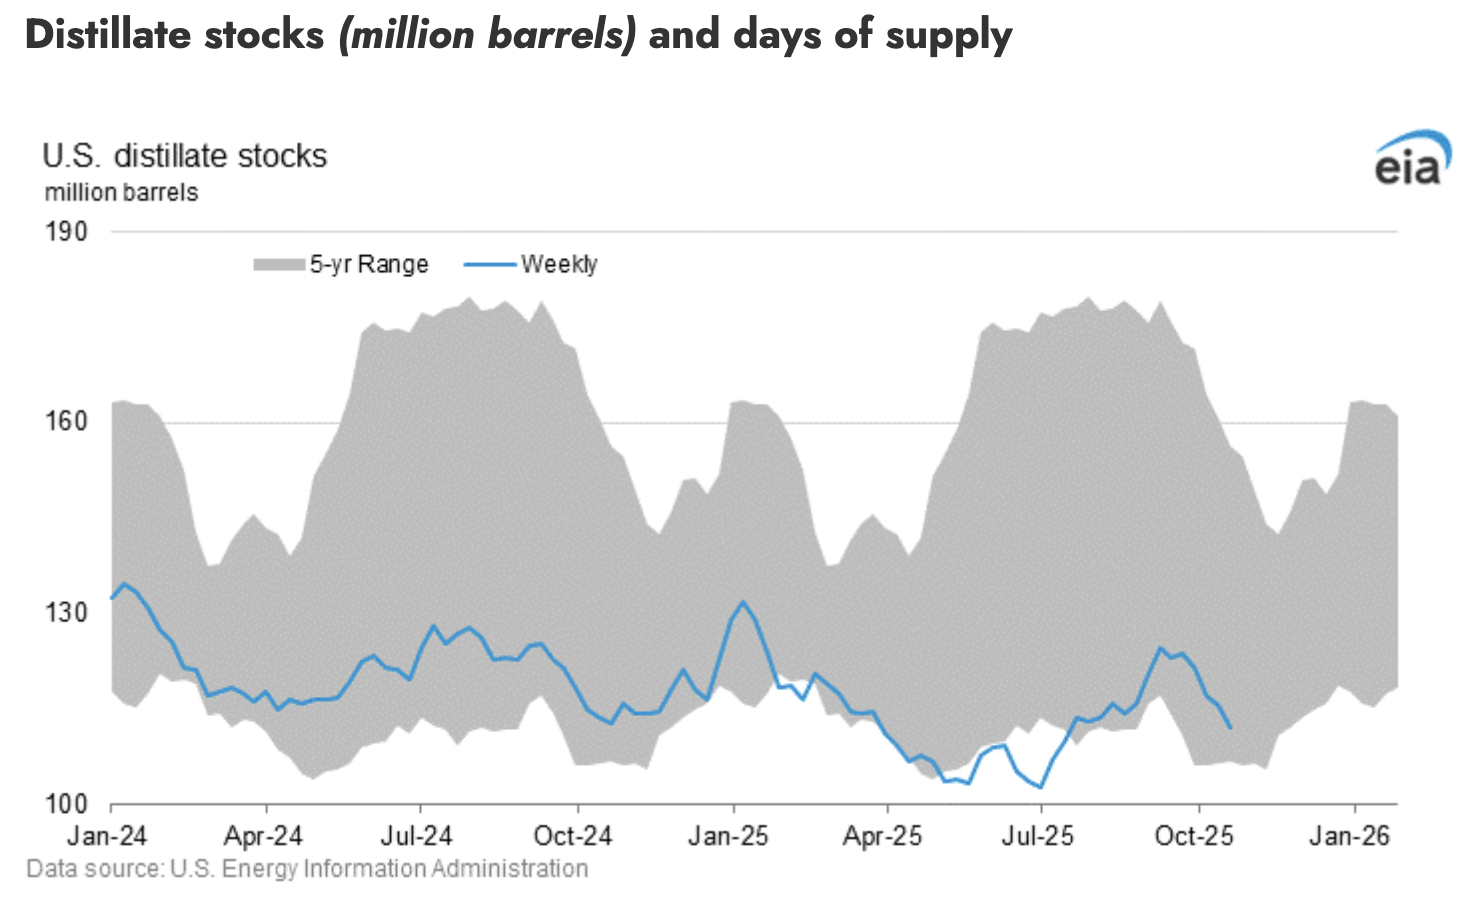
Supply conditions have made this pressure more severe. US inventories of distillate fuel oil, which includes diesel and heating oil, stand near 110 million barrels, about 17 percent lower than in January level and around 10 percent below the five-year average for this time of year. Stocks touched a 23-year low of 100.8 million barrels in May and have rebuilt only partially since.
Global disruption has also reduced the amount of refined fuel available to the market. Russia temporarily banned diesel exports on 8 July after attacks reduced refinery operations. Russia accounts for about 11 percent of global diesel exports, which means lower shipments can affect prices beyond its domestic market.
Renewed disruption in the Strait of Hormuz, the route for roughly one-fifth of global oil supplies and a large share of liquefied natural gas trade, has added further pressure. The strait was effectively closed from late February until a June agreement between the US and Iran reopened it, but attacks on two tankers on 7 July have cut transits sharply again. Continued restriction raises the cost of transport, fuel and natural-gas-based products across several regions.
These higher energy costs reach food and other goods through several connected channels. Freight costs rise first, while farmers and fishing operators face higher production expenses. Natural gas disruption raises the cost of nitrogen fertiliser, which can affect harvests months later. Oil and gas products are also important inputs in plastic packaging and restaurant disposables. Restaurants often feel the strain more than grocers because they change menu prices less often and risk losing customers when prices rise. Together, these effects can raise costs from production to the final sale without requiring separate shocks in each industry.
The timing of the pass-through is important. Freight surcharges can change within days, packaging costs can rise within weeks, and farm expenses may not appear until the next harvest. Fertiliser costs can take even longer to reach food prices because farmers apply it according to planting cycles.
This staggered effect explains why inflation may remain high after the original energy shock fades. A decline in crude oil prices would reduce some immediate pressure, but businesses may still be paying for fuel, fertiliser and packaging bought at higher prices.
Higher diesel costs may also restrain economic growth. Households that spend more on fuel and groceries have less money for restaurants, leisure and other non-essential purchases. Businesses may respond by reducing investment, changing products or raising prices to protect margins.
The diesel shock is therefore more than a transport problem. It is a supply-chain cost that moves gradually through agriculture, manufacturing, retail and household spending. Low inventories and continued geopolitical disruption suggest that this pressure could remain visible in US inflation data for several months.
Why This Matters for Crypto
The route from the pump to Bitcoin runs through the Federal Reserve. Freight, food and packaging costs that stay elevated for months make it harder for the committee to argue that inflation is falling back to target on its own, which removes the case for cutting and, at the margin, revives the case for raising. That judgement gets priced in the bond market rather than at the pump: the 10-year real yield has risen through July, with last week’s auction clearing at its highest since 2008. A higher real yield raises the return on simply holding cash, which weighs on every asset that pays no yield, Bitcoin included. The next section traces how far that repricing has already run.
Markets Begin to Test the Fed’s Trapped Hold
The diesel shock described in the previous chapter is no longer only a supply-chain story. It has reached rates markets. Ahead of the Federal Reserve’s 28-29 July Federal Open Market Committee meeting (FOMC), futures pricing shifted from asking when the Fed might cut to asking whether it might raise rates. In Bitfinex Alpha issue 214 the view we held was that the Fed was trapped, unable to cut while inflation pressure builds but unwilling to tighten while housing weakens.
A hold in rates remains our base case, but for the first time since the stance formed, the market is testing it from the hawkish side.
Rate Markets Now Price a Live Hike Debate
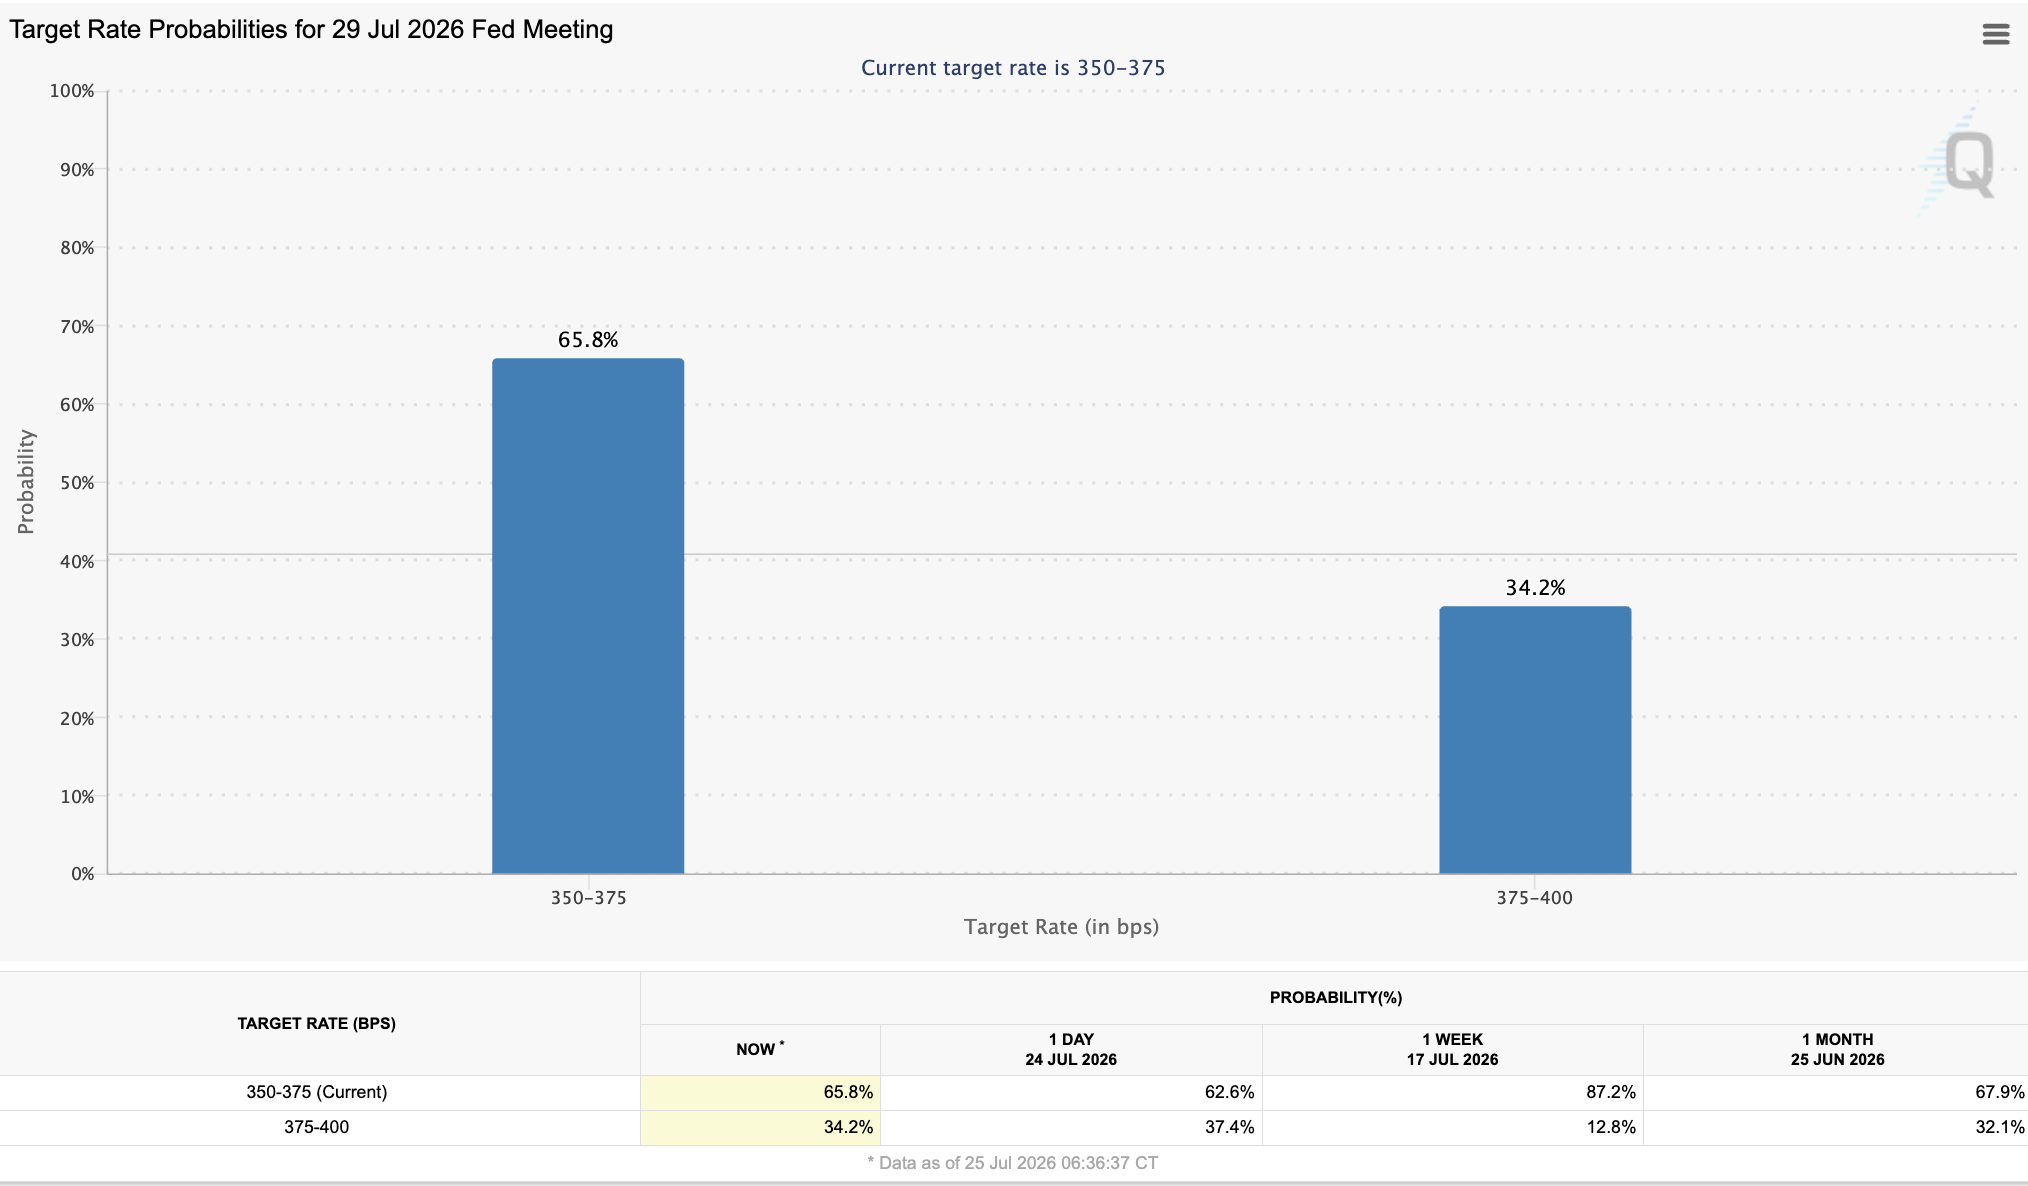
Futures tied to the federal funds rate now assign roughly a one-in-three chance of an increase at the July meeting, with a hold still the most likely outcome. Two forces are driving this repricing. The first is the renewed energy shock, which has rebuilt the cost pressure the Fed spent the spring waiting out. The second is Chair Kevin Warsh’s semi-annual testimony this month, in which he said the committee has “no tolerance for persistently elevated inflation”. With officials in a pre-meeting blackout since 18 July, the repricing has run unchallenged.
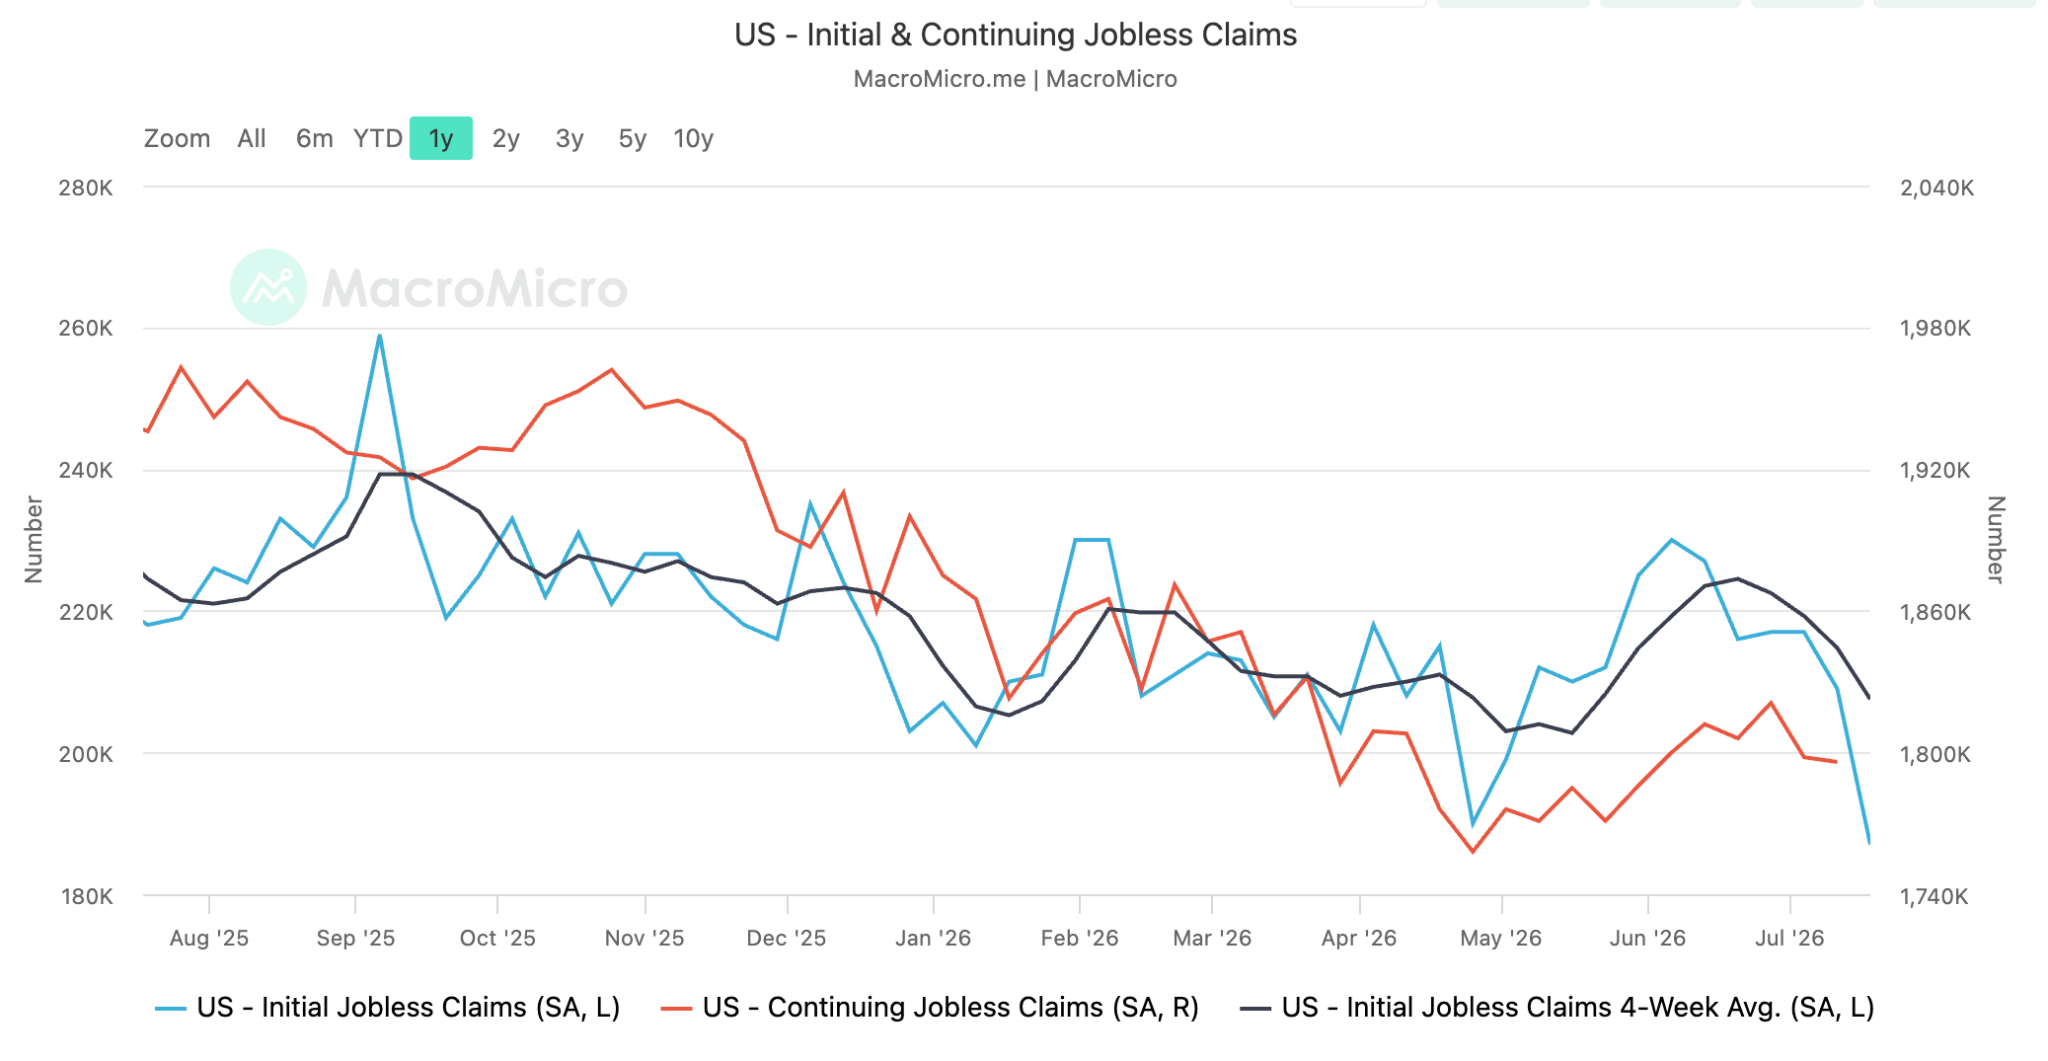
The case for patience rests on a softening economy, but the weekly jobless claims data published on 23 July somewhat undermined this approach. Initial jobless claims fell to 187,000 in the week ending 18 July, from a revised 209,000, the lowest reading since 1969, while continuing claims eased to 1.8 million. Growth indicators firmed as well. The S&P Global flash composite Purchasing Managers’ Index (PMI) rose to 53.6 in July, an eight-month high, but the detail matters more than the headline: input costs rose at the fastest pace in 14 months and selling prices approached a four-year high.
An economy hiring this steadily and repricing this quickly offers the Fed no data-based justification for a dovish hold.
Real Yields Close In on the Falsifier
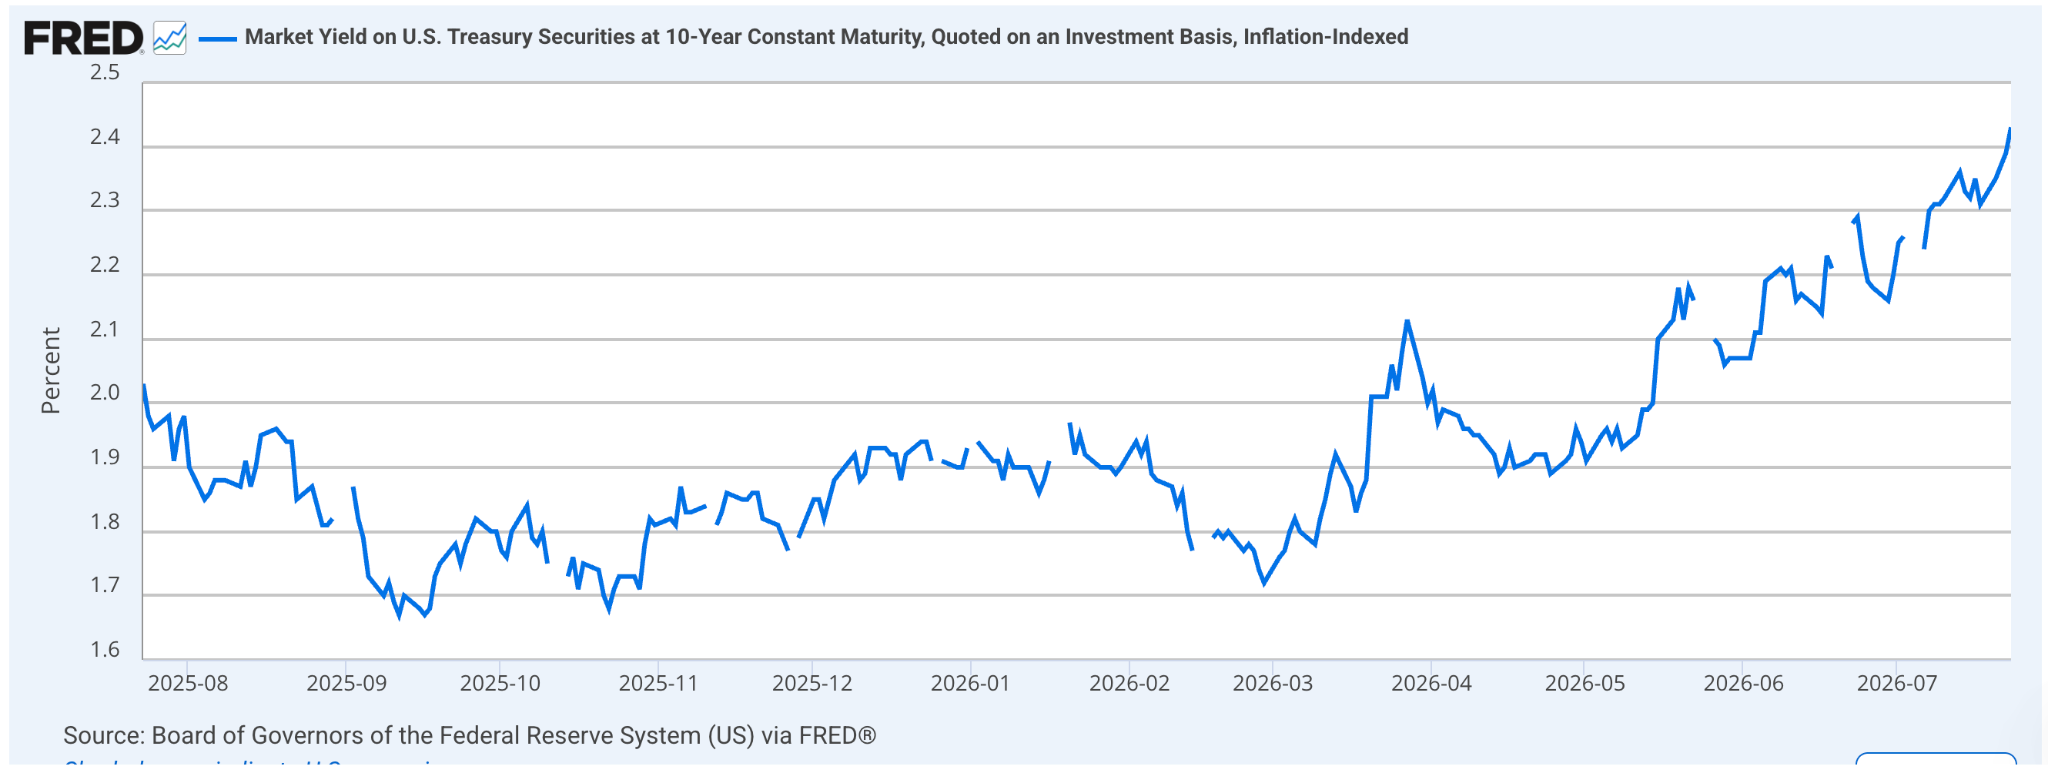
The bond market has already tightened on the Fed’s behalf. The 10-year Treasury Inflation-Protected Securities (TIPS) real yield climbed through the week, from 2.35 percent on 20 July to 2.43 percent on 23 July. Thursday’s 10-year TIPS auction cleared at 2.43 percent, the highest auction yield for the term since October 2008, on a soft bid-to-cover ratio of 2.30. This upward drift in yields has been evident over the last three weeks, moving from 2.24 percent on 6 July to 2.33 percent last week. The move now bears directly on the committed Bitcoin-tailwind stance, whose stated falsifier is a sustained move above 2.5 percent. At 2.43 percent, the market sits within seven basis points of that line.
What Would Prove This Wrong
We believe that rates will be held steady this week, although our view of the Fed’s position, including the trapped hold stance, is now that the risks to our views are no longer symmetric. A hike on 29 July would retire the trapped-hold framing outright and force a reassessment of the Bitcoin tailwind. Short of that, our calls fail if the following happens:
The trapped hold fails if the FOMC raises rates on 29 July or drops the two-sided language from its statement.
The Bitcoin-tailwind stance fails if the 10-year TIPS real yield holds above 2.5 percent for two consecutive weeks rather than merely touching it.
The resilient-growth read fails if initial claims, near 217,000 as recently as late June, move back above 230,000 for two consecutive prints, which would signal that the hawkish repricing overshot the real economy.
The diesel-driven inflation read fails if retail diesel prices retrace toward their pre-shock level and distillate stocks, now near 110 million barrels and about 10 percent below their five-year average, roughly 122 million barrels on that basis, rebuild toward that level before the August CPI release.