

Chart Decoder Series: SuperTrend: The Signal Behind a Changing Trend
On August 19, Bitcoin ripped through $67,000 and set off the largest single-day short squeeze in Bitcoin’s history — over $1.1 billion in short positions liquidated in a day. It was the first time that figure had ever cleared a billion for BTC alone, comfortably beating the old records of $757 million (May 2021) and $694 million (November 2025). The surge broke Bitcoin out of the $62,000-$66,000 range that had worn out both buyers and sellers for ten weeks.
Several forces were behind it: a bigger U.S. Treasury bond buyback programme, renewed spot ETF inflows, fresh SEC proposals easing crypto’s regulatory path and strong spot buying. Once the price cleared $67,000, trapped shorts had to buy back their positions to cut their losses, which only drove the move higher.
The bulls kept running, pushing Bitcoin to a high near $81,500 until Fed Chair Kevin Warsh’s hawkish Jackson Hole keynote on August 29 knocked it back below $77,000. The bulls are still in charge, but their grip is being tested for the first time since the squeeze.
Using Bitcoin’s latest price action as a real-world example, this episode of Chart Decoder Series explores how traders use SuperTrend on Bitfinex to ride trends without second-guessing every pullback and manage risk when volatility explodes.
What is SuperTrend?
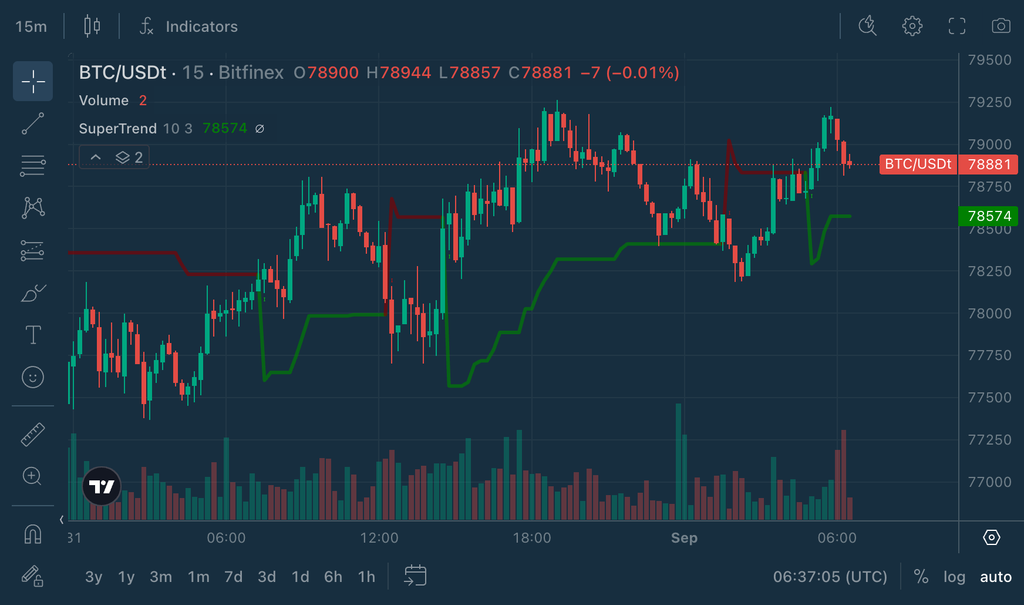
SuperTrend is one of the cleanest trend-following indicators in technical analysis. Rather than plotting oscillating values in a separate panel, it draws a single line directly on the price chart. That line is simple and binary. It sits on one side of price and flips to the other side when the trend changes.
What makes SuperTrend different from a simple moving average is that it’s built on volatility, specifically the Average True Range (ATR). The indicator takes the midpoint of each candle, then places its line a set number of ATRs above and below that midpoint. Whichever band price respects becomes the active SuperTrend line.
That gives you two states and the flip between them:
- Line below price (green): The price is trending up, with buyers in control. The uptrend holds as long as price stays above it.
- Line above price (red): The price is trending down, with sellers in control. The downtrend holds as long as price stays below it.
The further price travels from the line, the stronger the move.
Because the offset is measured in ATRs, the line widens when volatility rises and tightens when it falls. During a fast move like the August 19 squeeze, the line automatically backs away from price, giving the new trend room rather than stopping the trader out on the first pullback. In a sleepy market, it tucks in close.
The line also behaves like a dynamic trailing stop. In an uptrend, the green line rises beneath price and marks the level where the trend would come into question, so many traders trail their stop along it rather than guessing an exit. In a downtrend, the red line falls above price and does the same job in reverse.
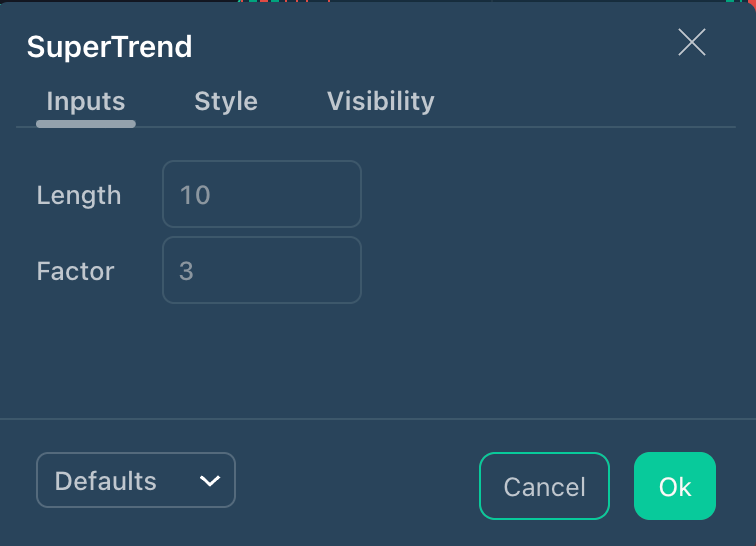
SuperTrend has two inputs:
- Length (ATR period): how many candles the volatility calculation looks back over. A common default is 10.
- Factor (Multiplier): how many ATRs away the line is placed. A common default is 3.
Shorter periods and smaller multipliers make the indicator faster and more sensitive, picking up more moves but also more noise. Longer periods and larger multipliers make it smoother and slower, filtering out chop but reacting later.
Keep in mind: SuperTrend measures the direction and durability of a trend, not whether a move has gone too far. A high, fast rally can stay above the line for a long time. That’s a feature, not a flaw, it’s designed to keep you in trends. But in a sideways market, the line will flip back and forth and generate false signals. Always combine SuperTrend with price structure, support and resistance, or indicators like RSI and MACD for confirmation.

SuperTrend vs Parabolic SAR
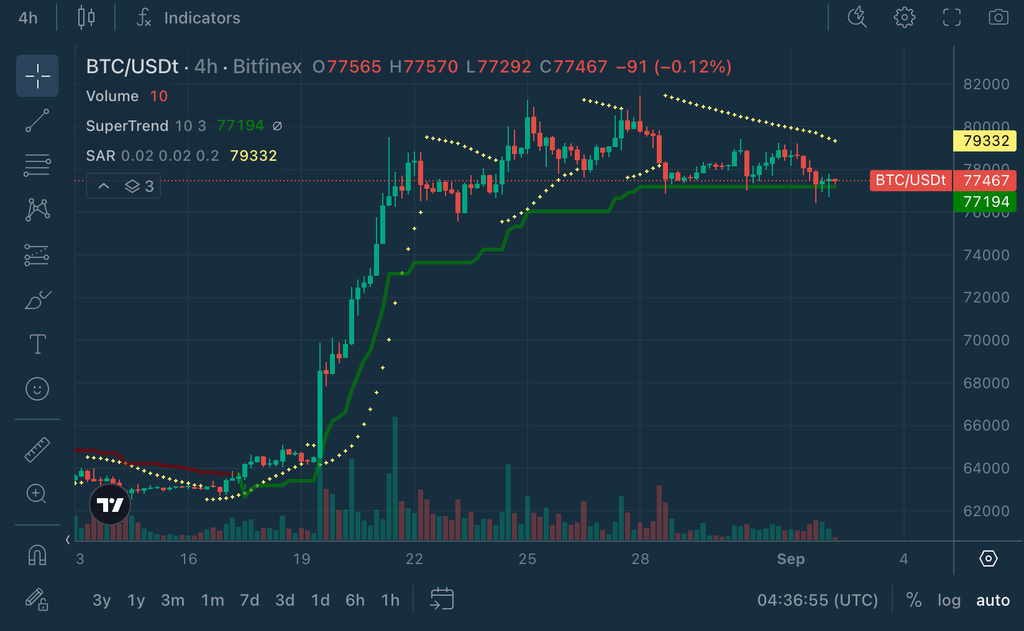
At first glance, SuperTrend and Parabolic SAR look like they do the same job.
Both indicators:
- Follow trends
- Sit above or below price
- Flip sides when conditions change
- Can be used as dynamic trailing levels
But they get there differently.
SuperTrend is driven by volatility.
- If volatility suddenly increases, the SuperTrend line adjusts accordingly and gives price more room to move. That can help prevent every sharp pullback from immediately producing a new signal.
- SuperTrend asks: “Given how volatile the market is right now, is price still on the trending side of the line?”
Parabolic SAR is driven by an acceleration factor tied to time.
- As a trend continues, its dots gradually move closer to price. That generally makes Parabolic SAR more sensitive as the trend develops.
- Parabolic SAR asks: “Is the current trend still accelerating, or is it stalling?”
In practice, SuperTrend generates fewer signals and is less likely to get shaken out by a single sharp pullback, which is useful in a market that just moved several thousand dollars in a day. Parabolic SAR is the more sensitive of the two and will often exit a trend earlier.
Why they can disagree
Because one tool reacts to volatility and the other to elapsed time, they often flip at different moments. In a fast, expanding move like a short squeeze, Parabolic SAR may flip bullish quickly while SuperTrend, waiting on a volatility-adjusted close, holds off a little longer. When both agree, the signal is stronger. When they conflict, it’s usually a sign the trend isn’t yet settled.
Example in action
Let’s look at the BTC/USD weekly chart on September 1, 2026.
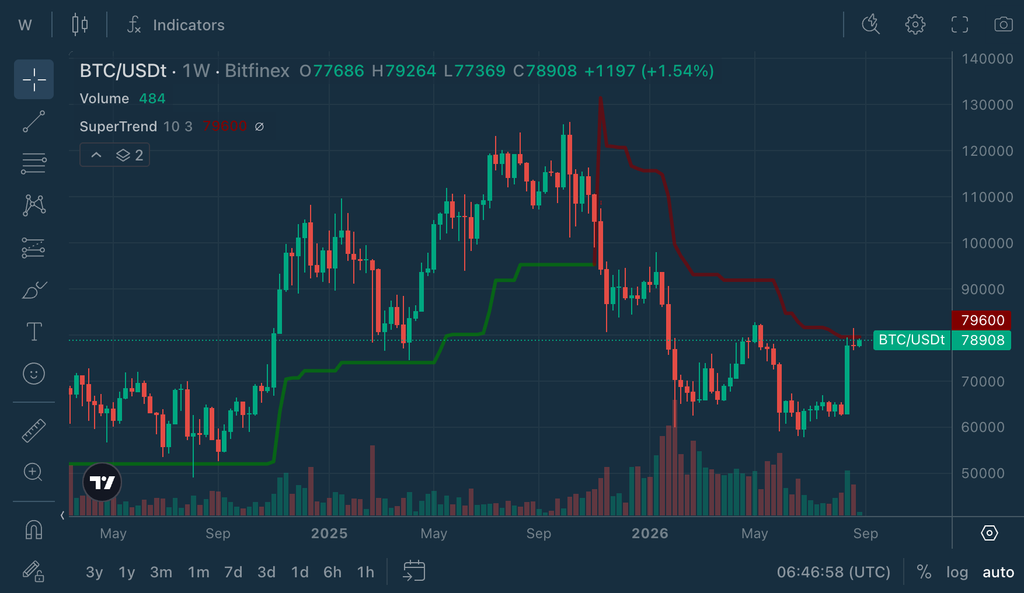
For context, the weekly timeframe is particularly useful for swing and longer-term traders looking to hold positions for weeks or months and capture a larger trend. It filters out much of the noise from smaller timeframes, making it more useful for judging whether Bitcoin has entered a broader bullish trend.
Bitcoin had just staged one of its strongest weekly moves in months, jumping from around $63,000 to under $80,000.
But here’s where SuperTrend makes things interesting.
Despite that rally, the weekly SuperTrend remains bearish, with its line still sitting above price at around $79,600. Bitcoin is now trading less than $1,000 below it, putting the market right on the edge of a potential trend reversal.
A weekly close above the SuperTrend line could flip the indicator bullish, moving the line beneath price and signalling a change in the broader trend. If Bitcoin remains below it, the bearish SuperTrend stays intact. For traders looking to go long on the weekly timeframe, $79,600 is a key level to watch. If Bitcoin closes above the SuperTrend line and the indicator flips bullish, that can be a signal to enter a long position. From there, the SuperTrend line can act as a trailing stop, following price higher until the trend eventually flips bearish.
Bonus Read: What the Daily Chart Is Telling Us
Now let’s drop down from the weekly to the BTC/USD daily chart.on September 1, 2026.
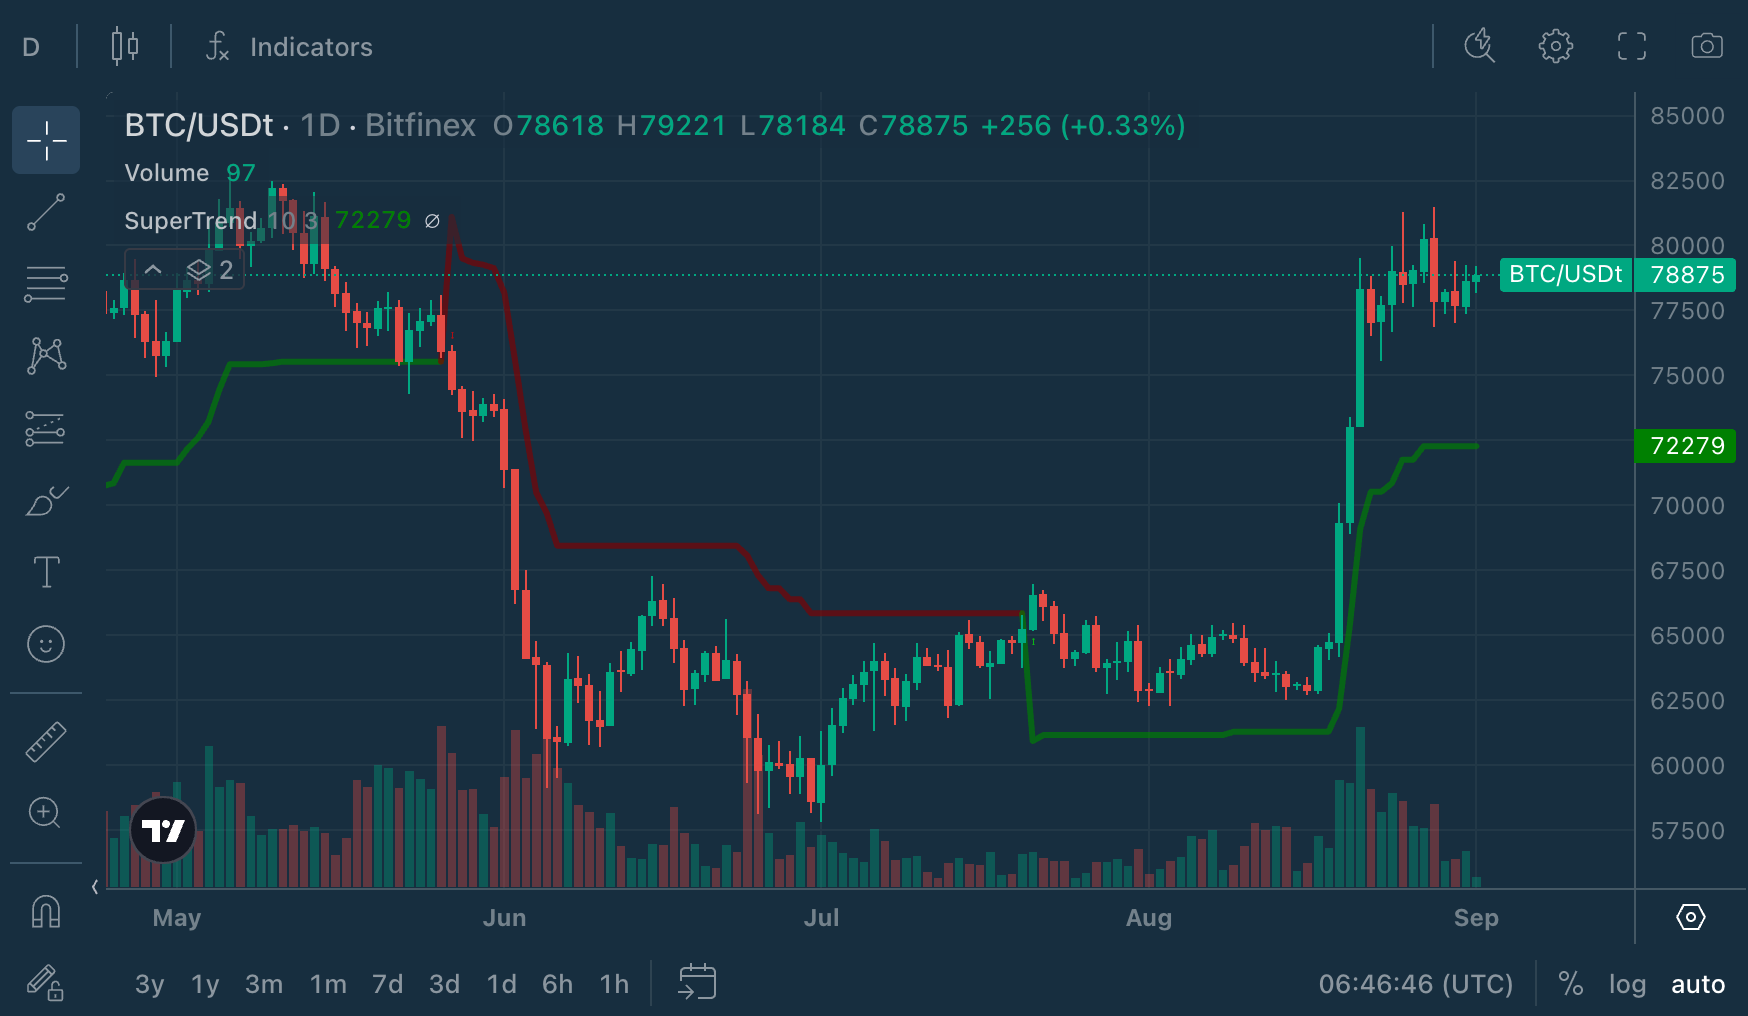
This is where the SuperTrend signal gets interesting. While the weekly SuperTrend is still bearish and waiting for Bitcoin to clear its line, the daily chart has already been bullish.
The daily SuperTrend now sits around $72,279, while Bitcoin is trading near $78,875. That leaves price comfortably above the line, meaning the indicator continues to classify the daily trend as bullish.
So why has the daily chart flipped while the weekly hasn’t?
Lower timeframes react faster. Each daily candle captures a much smaller slice of price action than a weekly candle, allowing SuperTrend to respond to a change in direction sooner. The trade-off is that faster signals can also produce more false flips.
That gives us two different reads on the same rally.
The daily chart says the shorter-term trend has already turned bullish. The weekly chart is saying: almost, but not yet.
For traders, that’s exactly why comparing timeframes can be useful. The daily SuperTrend can provide an earlier indication that conditions are changing, while a bullish flip on the weekly would provide broader confirmation that the move has developed into a larger trend.
For now, the daily SuperTrend line also gives traders a level to watch. As long as Bitcoin remains above it, the indicator continues to classify the daily trend as bullish. A move back below the line could be an early sign that the breakout is beginning to lose strength. For traders going long on the daily timeframe, the $72,279 SuperTrend line can act as a trailing stop. As Bitcoin rises, the line follows it higher. If price closes below the line and SuperTrend flips bearish, that can be a signal to exit the long.
How to use SuperTrend like a pro
Trade it in trends, avoid it in ranges
- SuperTrend is built for trending markets, where it keeps you in a move and trails your risk.
- In a flat, choppy range, expect repeated false flips.
Use the line as a trailing stop
The cleanest way to use SuperTrend is to let it manage the exit.
- In an uptrend, trail your stop along the green line beneath price instead of guessing a level.
- In a downtrend, the red line above price marks where bearish control would be lost.
Match the settings to your timeframe
There’s no single “right” setting, only the one that matches how much noise you’re willing to tolerate.
- Smaller multipliers (around 2) and shorter ATR periods react faster and suit active, lower-timeframe trading.
- Larger multipliers (3 or more) and longer periods filter noise and suit swing traders who want to sit through normal pullbacks.
Pair it with structure
A flip means far more when it lines up with something real.
- A bullish flip right at a major support level carries more weight than one in the middle of a range.
- A bearish flip as price rejects resistance is a stronger signal than a random flip in empty space.
Power combinations
SuperTrend + Moving Averages
Moving averages define the bigger trend.; SuperTrend times the entry.
- If the price is above the 50-day moving average and SuperTrend flips green, the bullish signal has supportive context.
- If the price is below the 50-day moving average and SuperTrend flips red, the bearish signal has more weight.
SuperTrend + RSI
RSI tells you how stretched the move is.; SuperTrend tells you which way the trend is pointing.
- A bullish flip while RSI is recovering from oversold suggests momentum is genuinely improving.
- A bullish flip while RSI is already overbought may be chasing a move that’s about to cool.
SuperTrend + MACD
MACD confirms momentum shifts.
- A SuperTrend flip that lines up with a MACD crossover signals real conviction.
- Conflicting signals between the two suggest waiting for confirmation.
SuperTrend + Parabolic SAR
Two trend-followers, two engines.
- When Parabolic SAR flips first and SuperTrend confirms shortly after, the trend change has broad agreement.
- When SAR flips but SuperTrend refuses to, the volatility-based tool is warning the move may not have enough behind it yet.
SuperTrend + Support and Resistance
- A bullish flip that also clears horizontal resistance is a high-quality signal.
- A bearish flip that also loses major support warns of further downside.
This helps traders avoid treating every flip as equal.
Try it on Bitfinex
- Log into Bitfinex
- Choose any trading pair chart
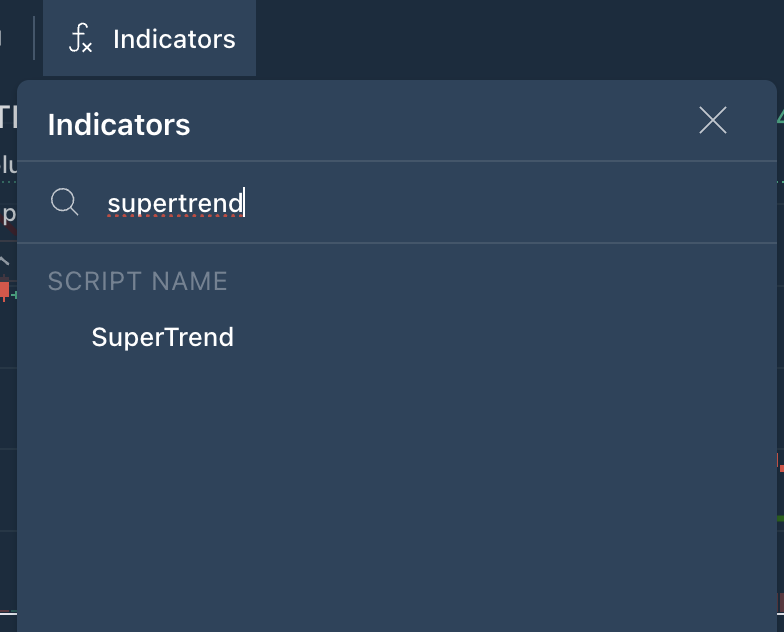
- Add “SuperTrend” from the Indicators menu
- Watch which side of the price the line sits on, whether it has just flipped, and how far it sits from price. Use it alongside RSI, MACD, or moving averages for stronger confirmation
- Leverage Bitfinex’s zero trading fees to implement your strategies with zero trading costs
Bitfinex. Master Your Universe.

Explore the full Chart Decoder library:
- SMA vs EMA for trend direction
- MACD for momentum shifts
- RSI for overbought/oversold zones
- Bollinger Bands for volatility and price extremes
- Stochastic Oscillator for timing reversals
- VWAP for fair price detection
- Volume + OBV for spotting smart money flow
- ATR for volatility-based risk management
- Fibonacci Retracements for market pullbacks
- StochRSI for precision timing
- Ichimoku Cloud Part 1 for understanding the 5 components of the cloud
- Ichimoku Cloud Part 2 for mastering Cloud components & powerful indicator pairings
- Accumulation/Distribution for detecting institutional buying and selling
- Money Flow Index for tracking the strength of buying and selling pressure
- Chaikin Money Flow for confirming real capital flow
- Volume Profile Visible Range for broader market value zones
- Volume Profile Fixed Range for isolating where value is building inside a move
- Parabolic SAR for spotting potential trend reversals
- Donchian Channels for catching breakouts
- Rate of Change for measuring momentum behind a move