

Issue #206:
BTC Stalls As Fed Signals A Hawkish Tone
Bitcoin Slows Down As Inflation Becomes Persistent
Bitcoin’s correction has played out in line with prior concerns around fading ETF demand and underwhelming STRC inflows, with the market now digesting its largest liquidation event in three months. The May 23 deleveraging wiped out $766 million in aggregate positions, including $458 million in longs, as geopolitical uncertainty and a 16-month high in the US 10-year yield pressured risk assets. BTC fell nearly 10 percent from its early-May high to a Saturday low of $74,027 before reclaiming the monthly open, but the recovery has so far stalled near the weekly open. Open interest has now fully unwound the prior three-week build-up, while funding has reset to neutral-to-slightly negative, suggesting leverage has been flushed but upside momentum remains fragile.
The key concern is that recent buyers are now underwater. BTC has traded below the Short-Term Holder Realised Price near $78,600, while the 30-day accumulator cost basis failed as support after the close below $76,500. This creates heavy breakeven resistance near $79,000, with the larger November–February cohort cost basis around $85,900 still acting as the major structural ceiling. In the near term, the $72,000–$82,000 UTXO air gap is likely to define the new trading range unless fresh institutional demand returns. That said, the broader supply picture remains constructive: exchange reserves sit near seven-year lows and long-term holder supply remains stable at 14.43 million BTC, indicating passive profit-taking rather than a systemic exit by high-conviction holders.
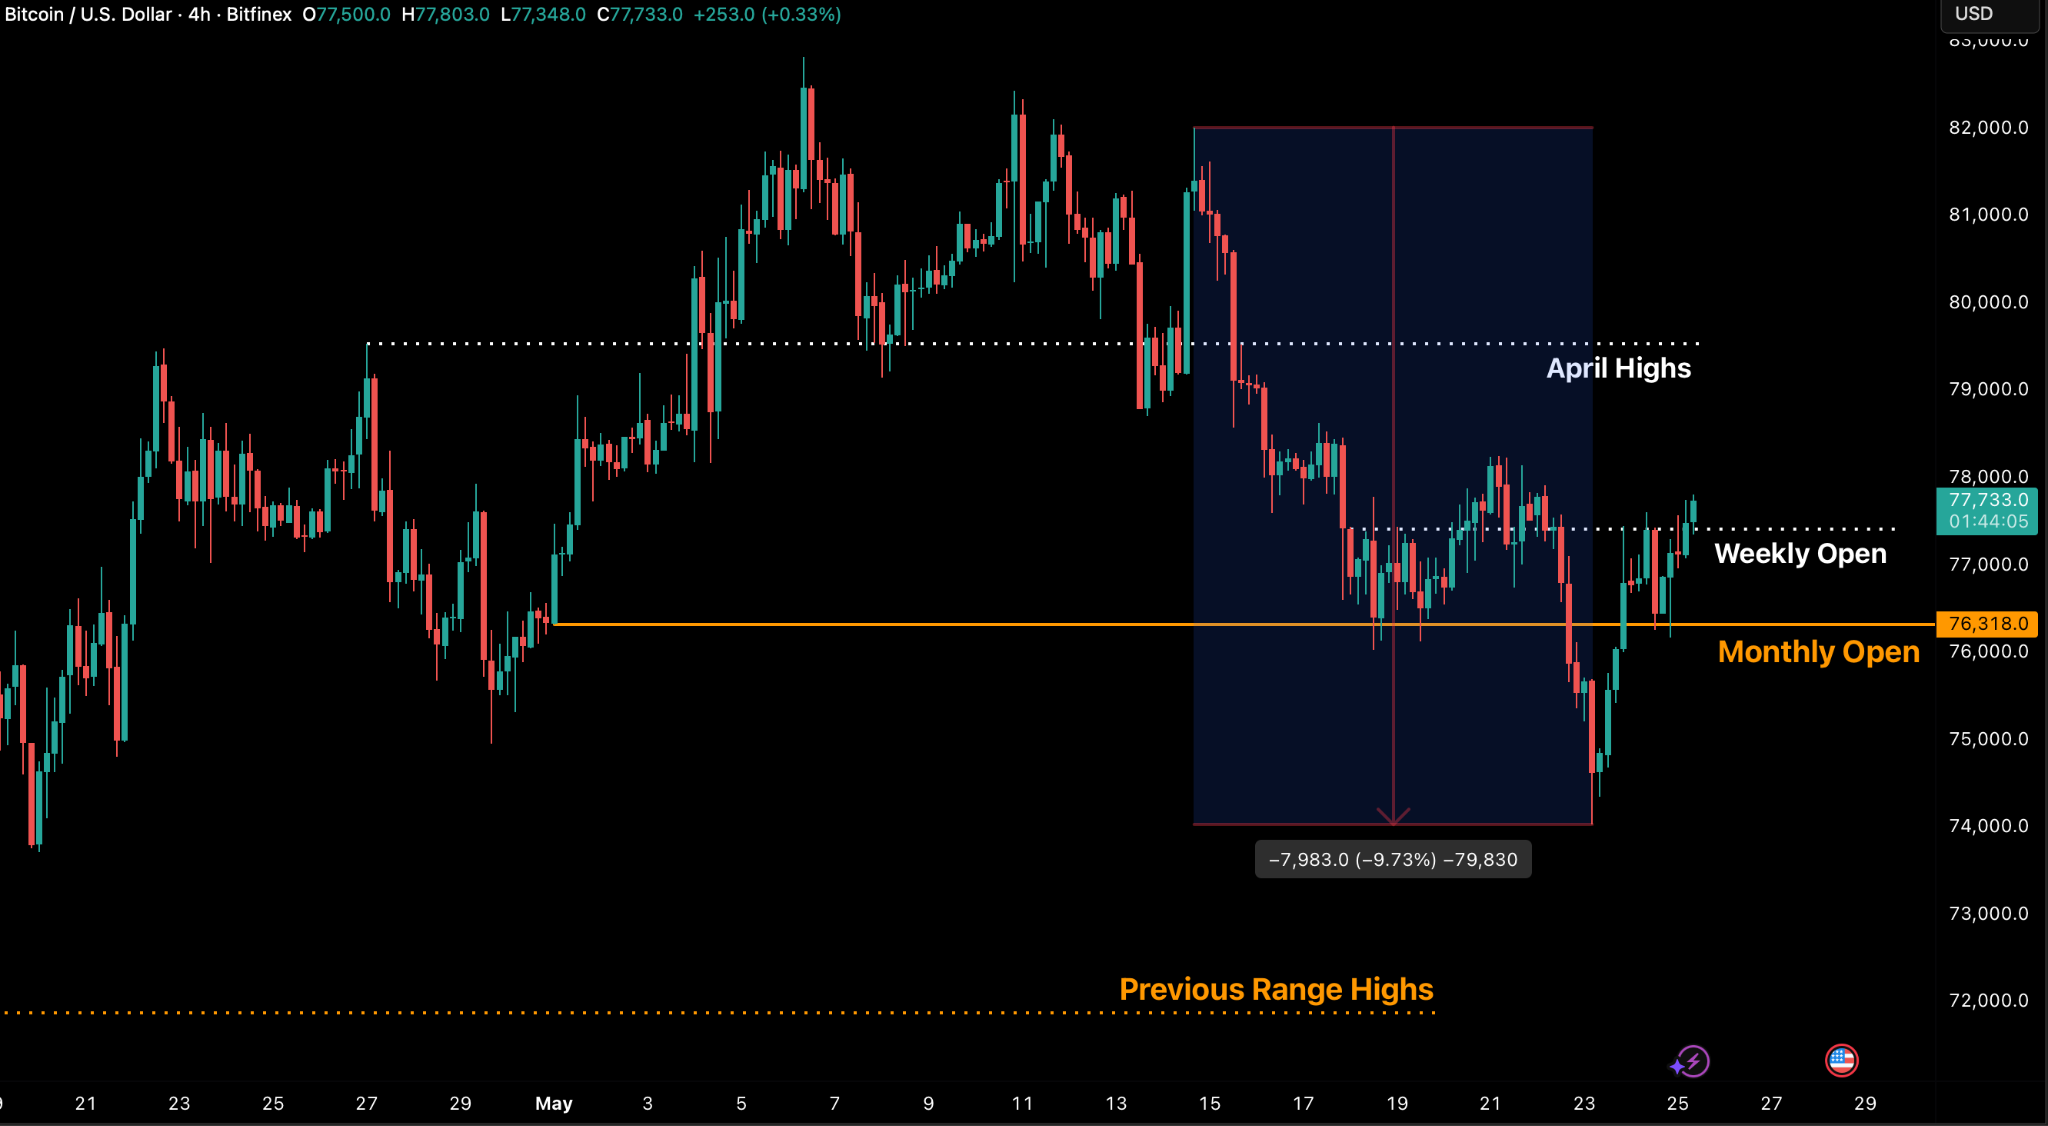
BTC/USD 4H Chart. (Source: Bitfinex)
Persistent inflation across housing, energy and services sectors continues to complicate the Federal Reserve’s policy outlook, reducing the likelihood of near-term interest rate cuts in the US. Sticky inflation measures remain elevated as housing shortages, rising mortgage rates and higher service-sector costs keep feeding into broader price pressures. Treasury yields and energy prices have also stayed high, reinforcing concerns that inflation may sit above the Fed’s target for longer than markets previously expected.
At the same time, US consumer sentiment has fallen to a record low as households struggle with declining purchasing power and higher living costs. Long-term inflation expectations have also risen sharply, creating additional challenges for the Fed as it tries to stop those expectations becoming permanently embedded. Although the labour market remains relatively stable, with low jobless claims and continued payroll growth, real wages have turned negative as inflation outpaces wage gains, leaving consumers increasingly strained despite resilient employment.
In the crypto sector, Truth Social withdrew its proposed bitcoin ETF applications amid intensifying competition and fee compression across the increasingly saturated US spot bitcoin ETF market. Analysts viewed the move as a reflection of weakening economics for smaller entrants trying to compete with dominant players such as BlackRock and Fidelity Investments, particularly as spot bitcoin ETFs become more commoditised products driven by scale, liquidity, and pricing power.
Separately, the US Department of Commerce committed more than $2 billion in CHIPS Act incentives to quantum computing companies, marking the largest federal intervention into quantum hardware to date.
The initiative carries long-term implications for blockchain security, as sufficiently advanced quantum computers could eventually threaten the cryptographic foundations underpinning Bitcoin and Ethereum, raising the urgency around post-quantum cryptography development across the digital-asset industry.

Market Signals
Bitcoin Stalls At Resistance
Bitcoin saw significant volatility over the weekend, with the largest liquidation event in three months on Saturday, May 23, as significant deleveraging occurred. Aggregate liquidations totalled $766 million, with the long-side component accounting for $458 million, the largest “long wipe” recorded since February 6, as a wave of selling by short-term holders and a decline in open interest saw the market drop to $74,027. The market then sharply rebounded triggered by positive news on a possible extension to a ceasefire in Iran and a re-opening of the Strait of Hormuz with the price currently attempting to convincingly clear last week’s open at $77,400. With a significant decline in open interest, the spot market tape is more dominant than perps at the moment and a recovery above these levels would signal strong demand from spot buyers.
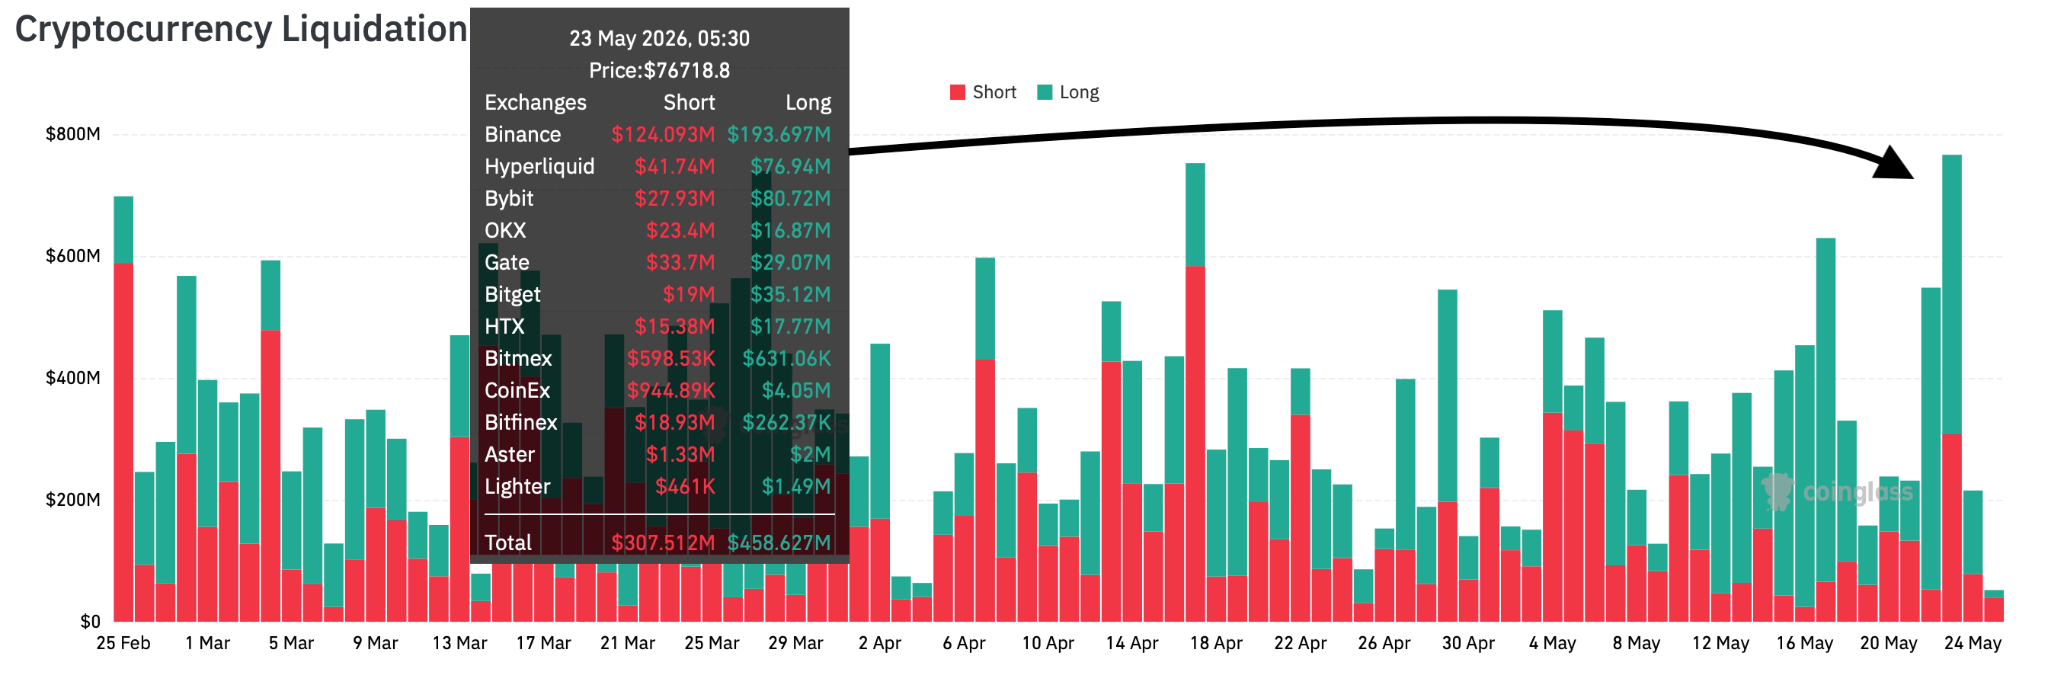
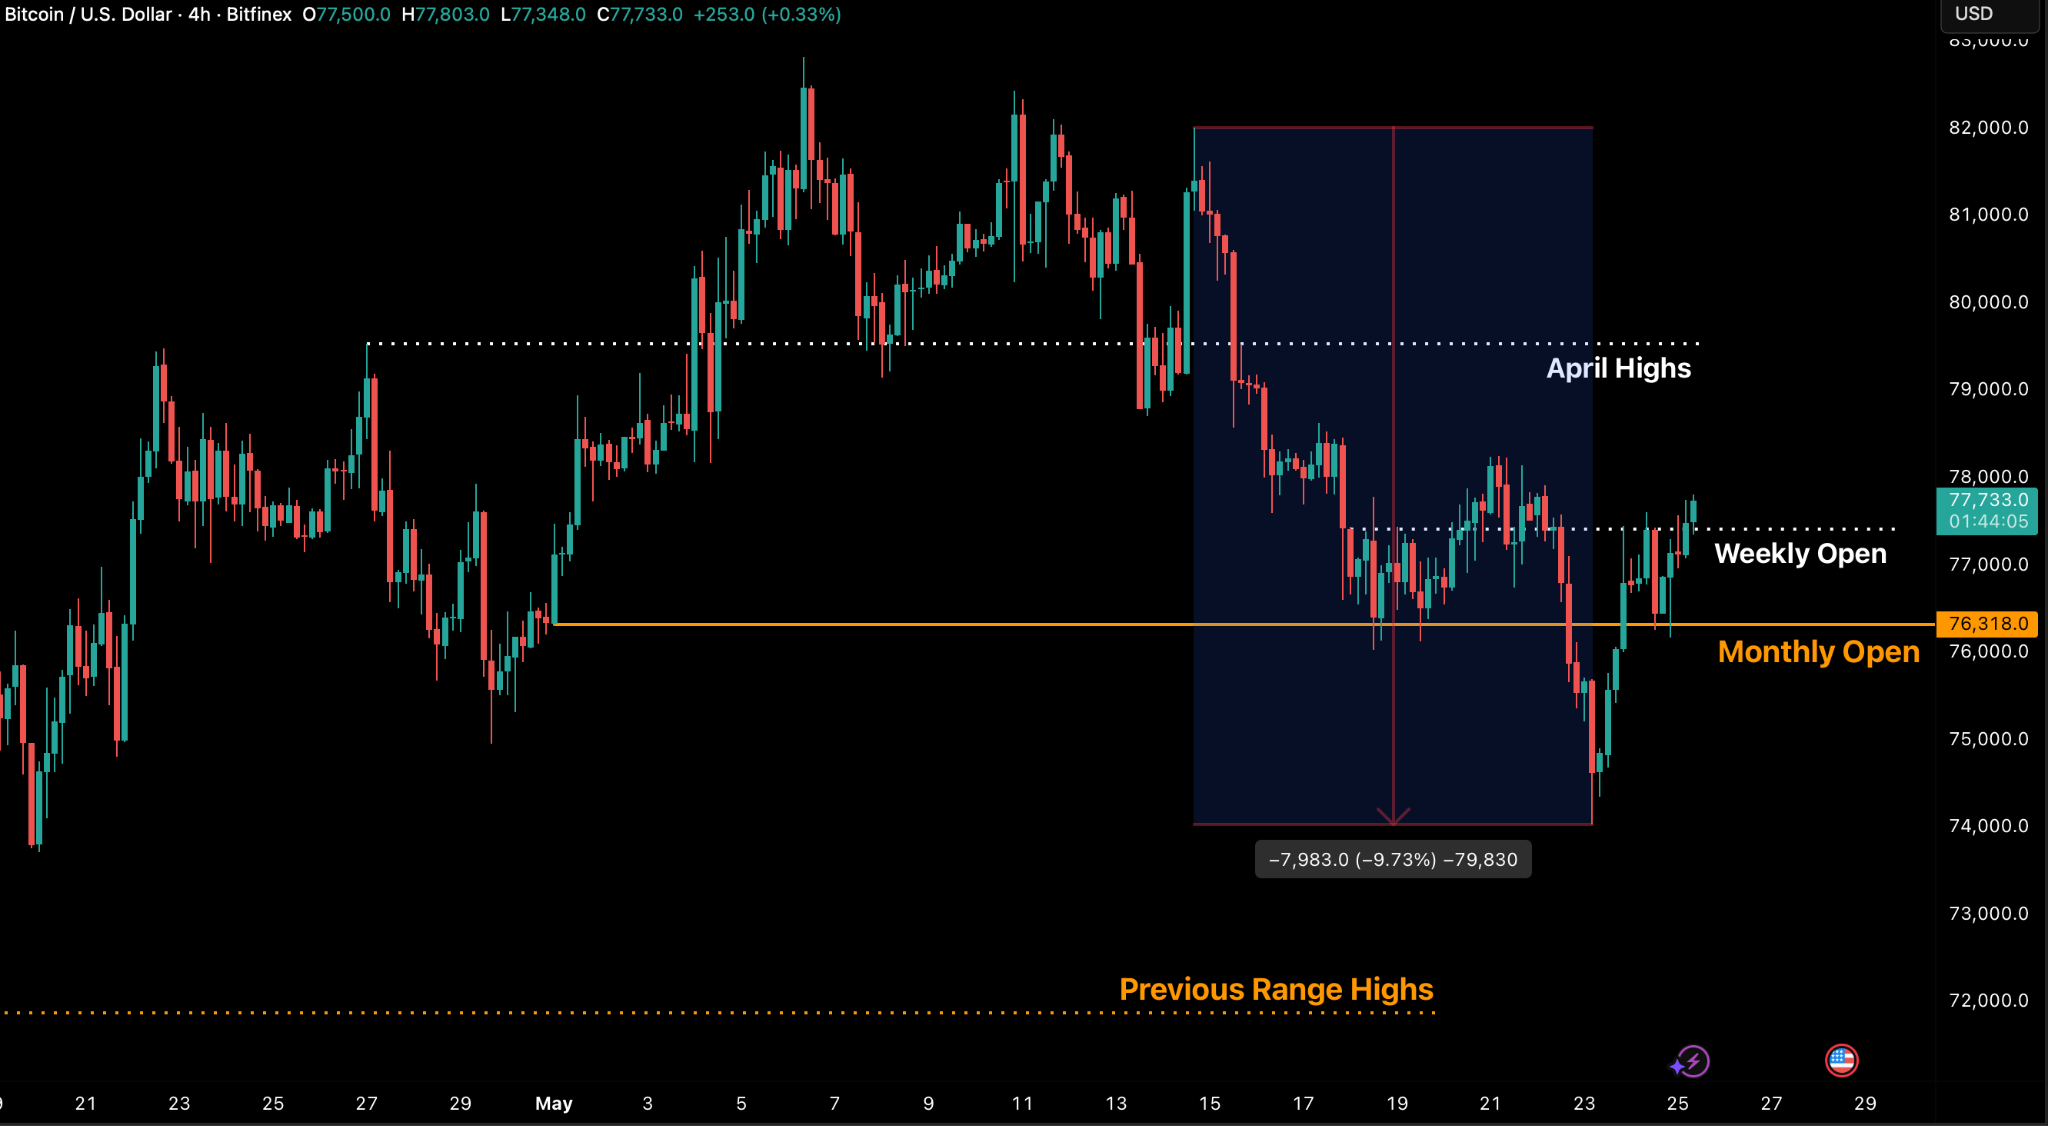
We have suggested in previous editions of Bitfinex Alpha that recent underwhelming inflows into STRC, the Strategy-issued variable rate perpetual preferred shares, combined with dwindling ETF buy demand for Bitcoin, could lead to a correction in the price. Indeed, the 15 May STRC dividend record date aligned with a local top of $82,010 being reached on May 14 and the price remains down over 5 percent since then. We had set the May Monthly Open at $76,318 as our downside target, and are now looking for a convincing clearance of last week’s Weekly Open of $77,400 to confirm a rally.
The most critical data point last week emerged from the expanding size of Bitfinex margin longs. This metric rose to 82,681 BTC last week, the highest reading since November 2023 and an 88 percent increase from the July 2025 lows. The expansion continued throughout the recent price decline and remains in place through the weekend volatility.
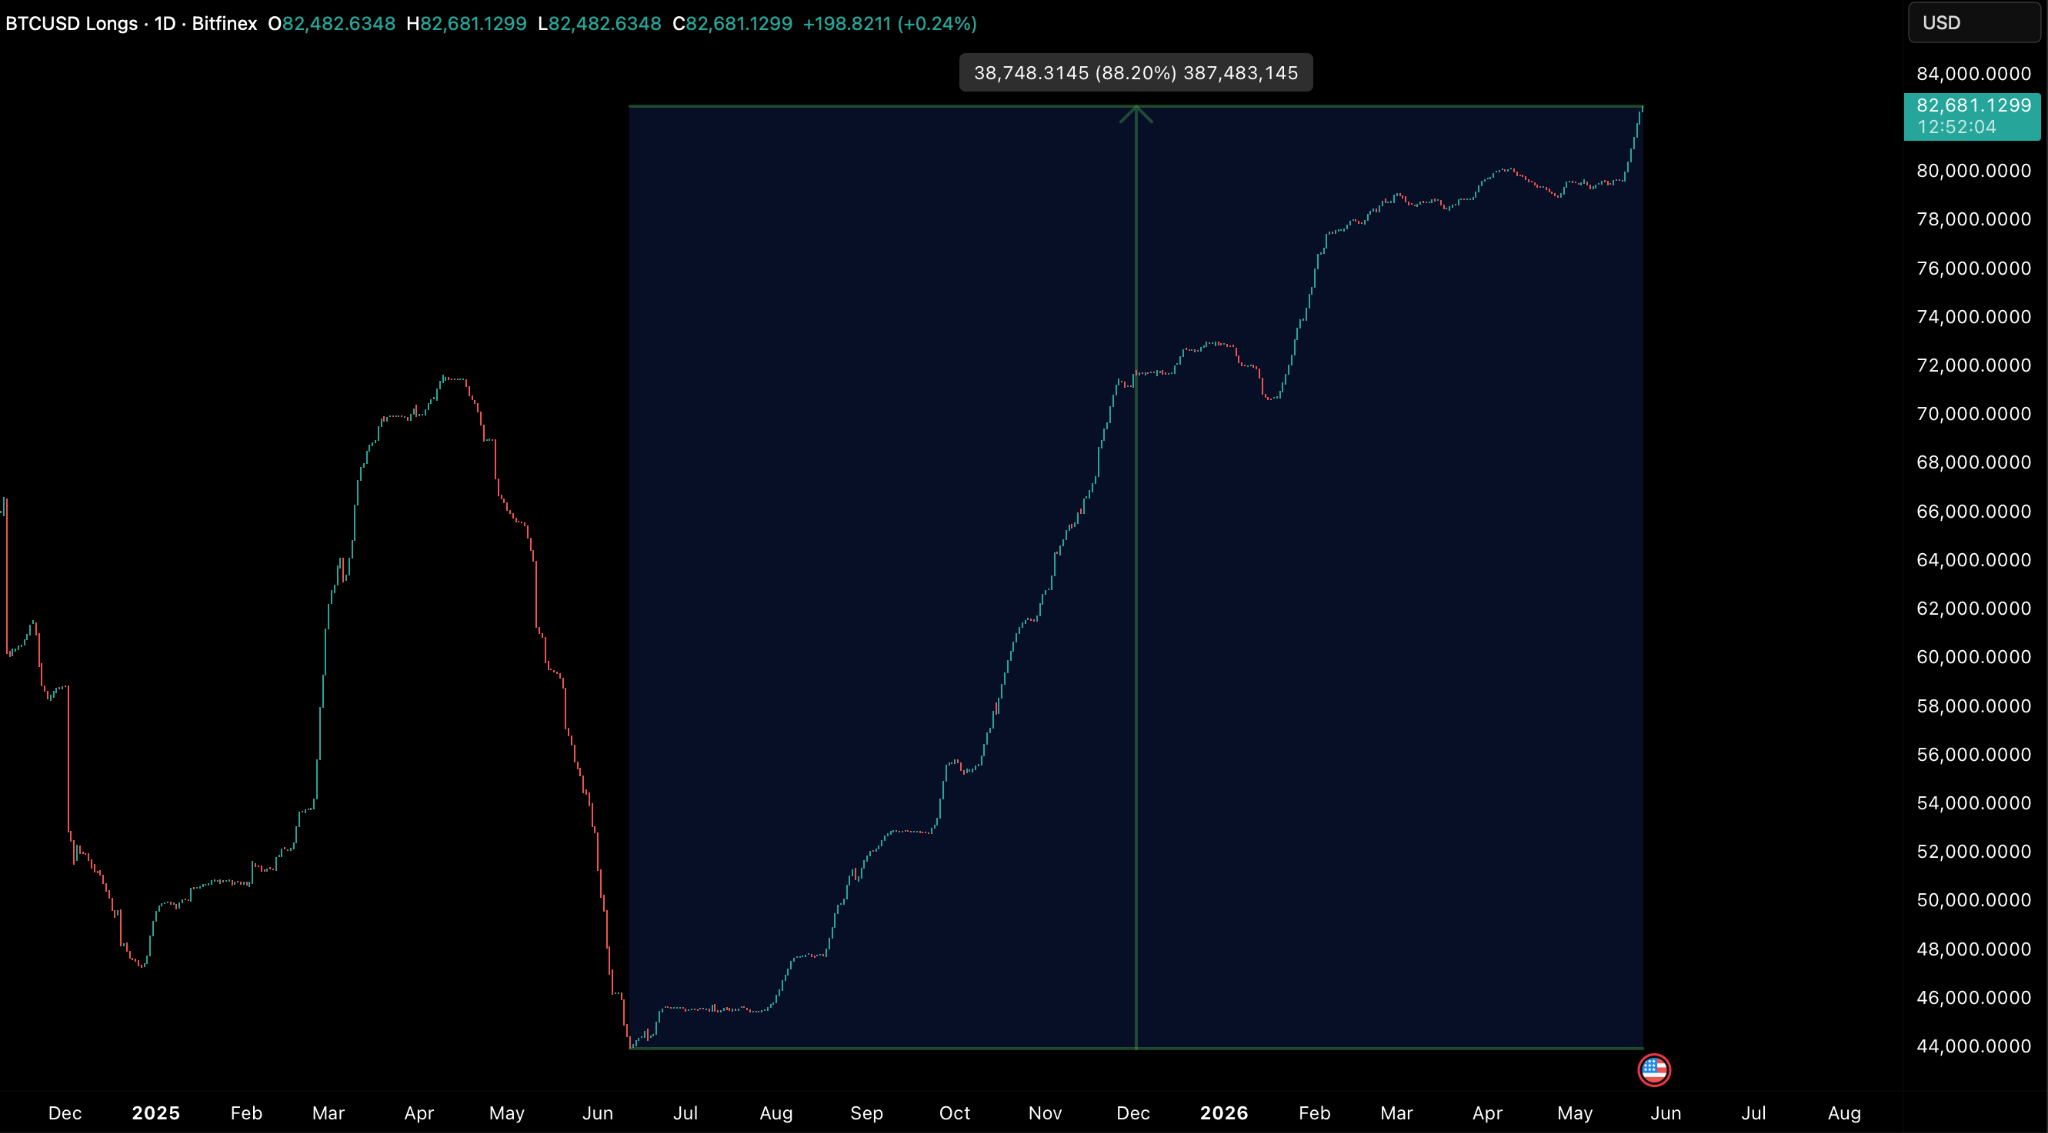
This rapid expansion in Bitfinex margin longs added approximately $6.2 billion in long exposure into a slide of nearly 10 percent peak-to-trough, coinciding with three consecutive negative daily closes from Wednesday through Friday, May 20 through 23. The increase in the margin long book is consistent with behaviour observed during prior bear market drawdowns, though the speed and scale of this accumulation are notable.
The 30-day accumulator cost basis, representing the weighted average entry of market participants from the late April to May reclaim, failed to hold as a support following a daily close below $76,500 on Friday, 22 May. The breach is technically significant. While intraday moves below this level were rebuffed earlier in the month, that Friday close marks the first structural failure of this specific behavioural cohort.
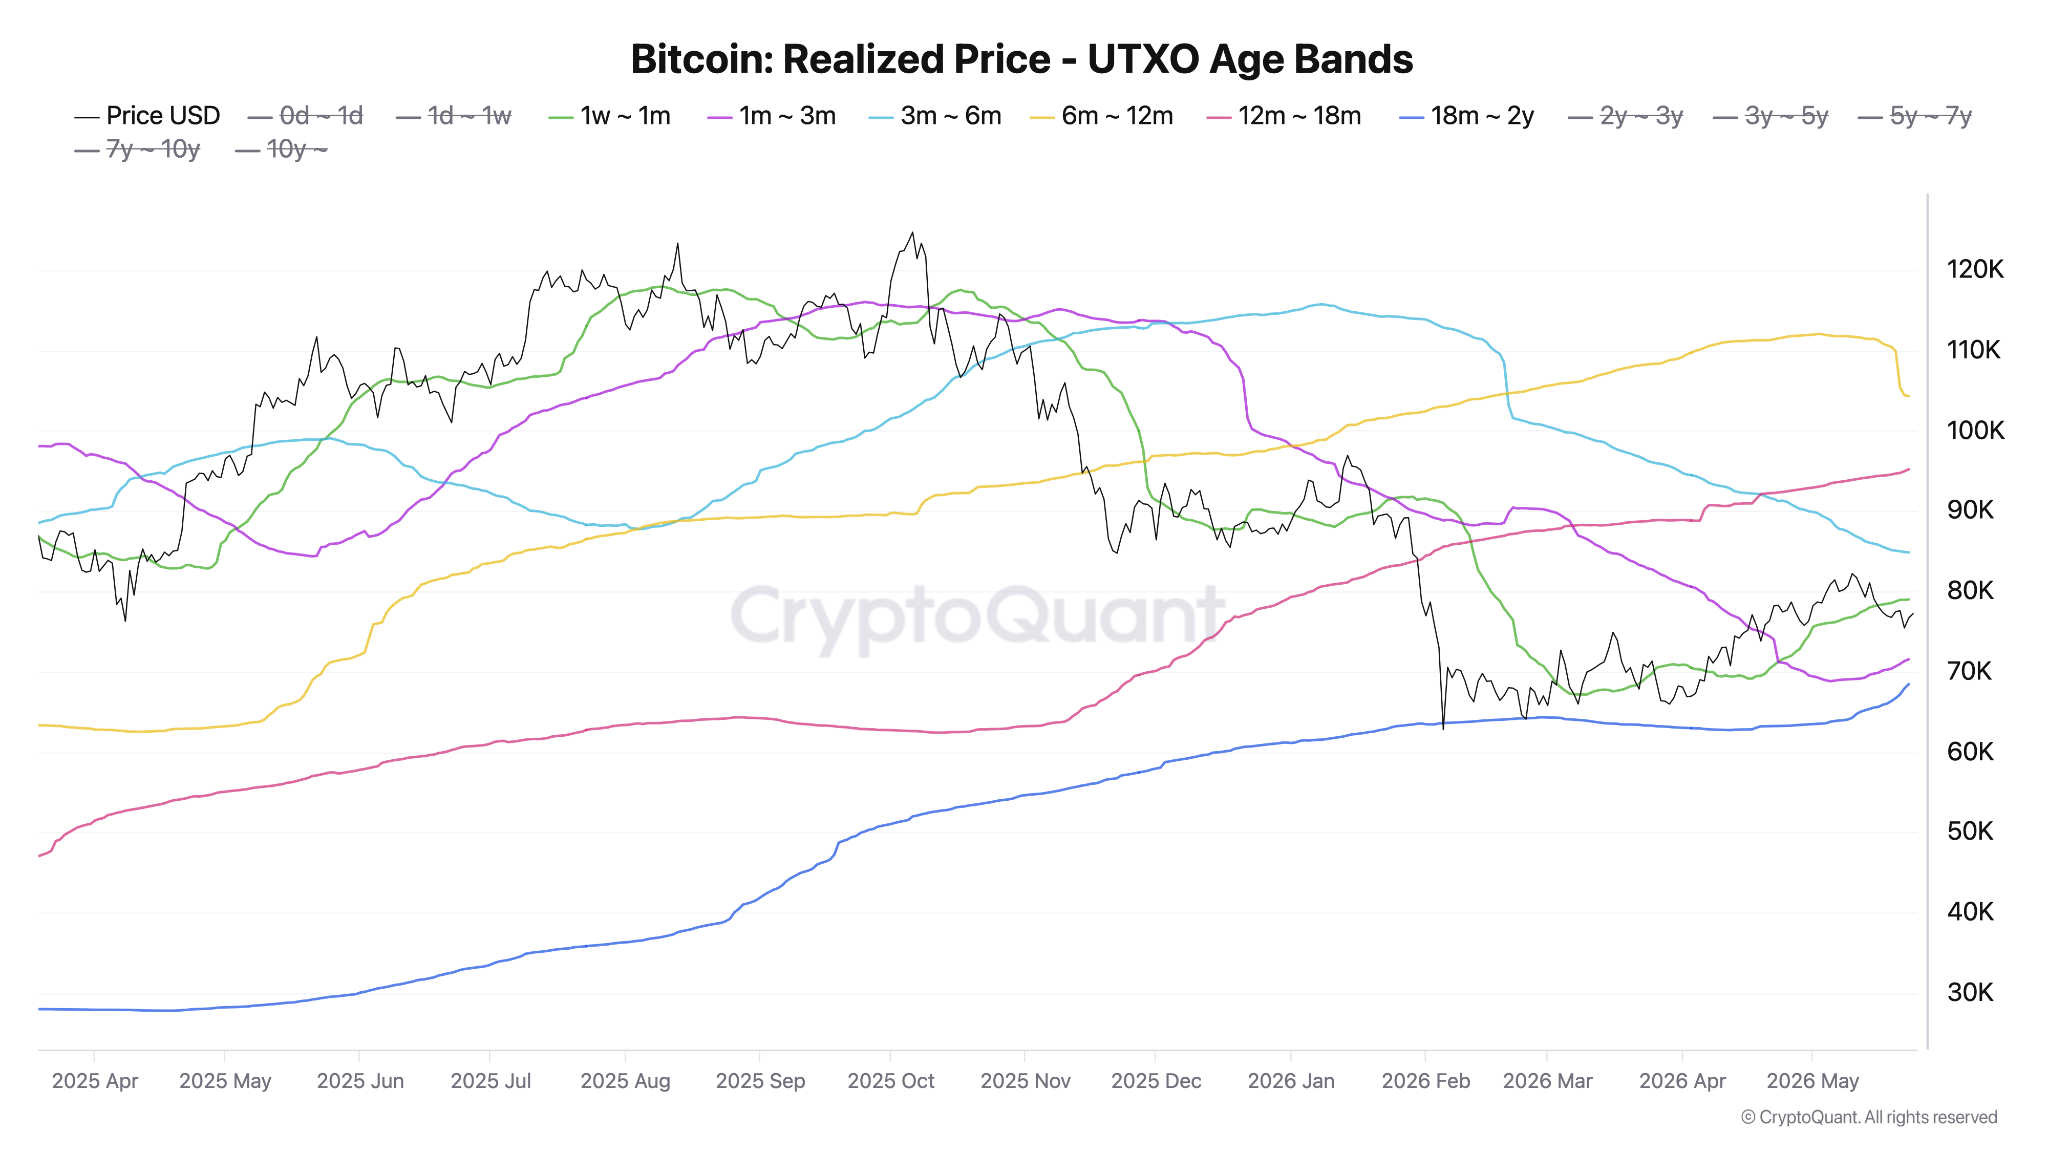
Within the Realised Price by Age framework, recent accumulators sitting underwater typically signal a regime test, though with the price now above these levels, it is only if we fall back again that this breach becomes significant.
Spot prices have also traded firmly below the Short-Term Holder Realised Price (STHRP) of approximately $78,600 for the duration of the week, indicating that the entire 155-day holder cohort is underwater. A lack of strong institutional buying can then feed dwindling demand as a ripple effect across underwater buyers in all cohorts.
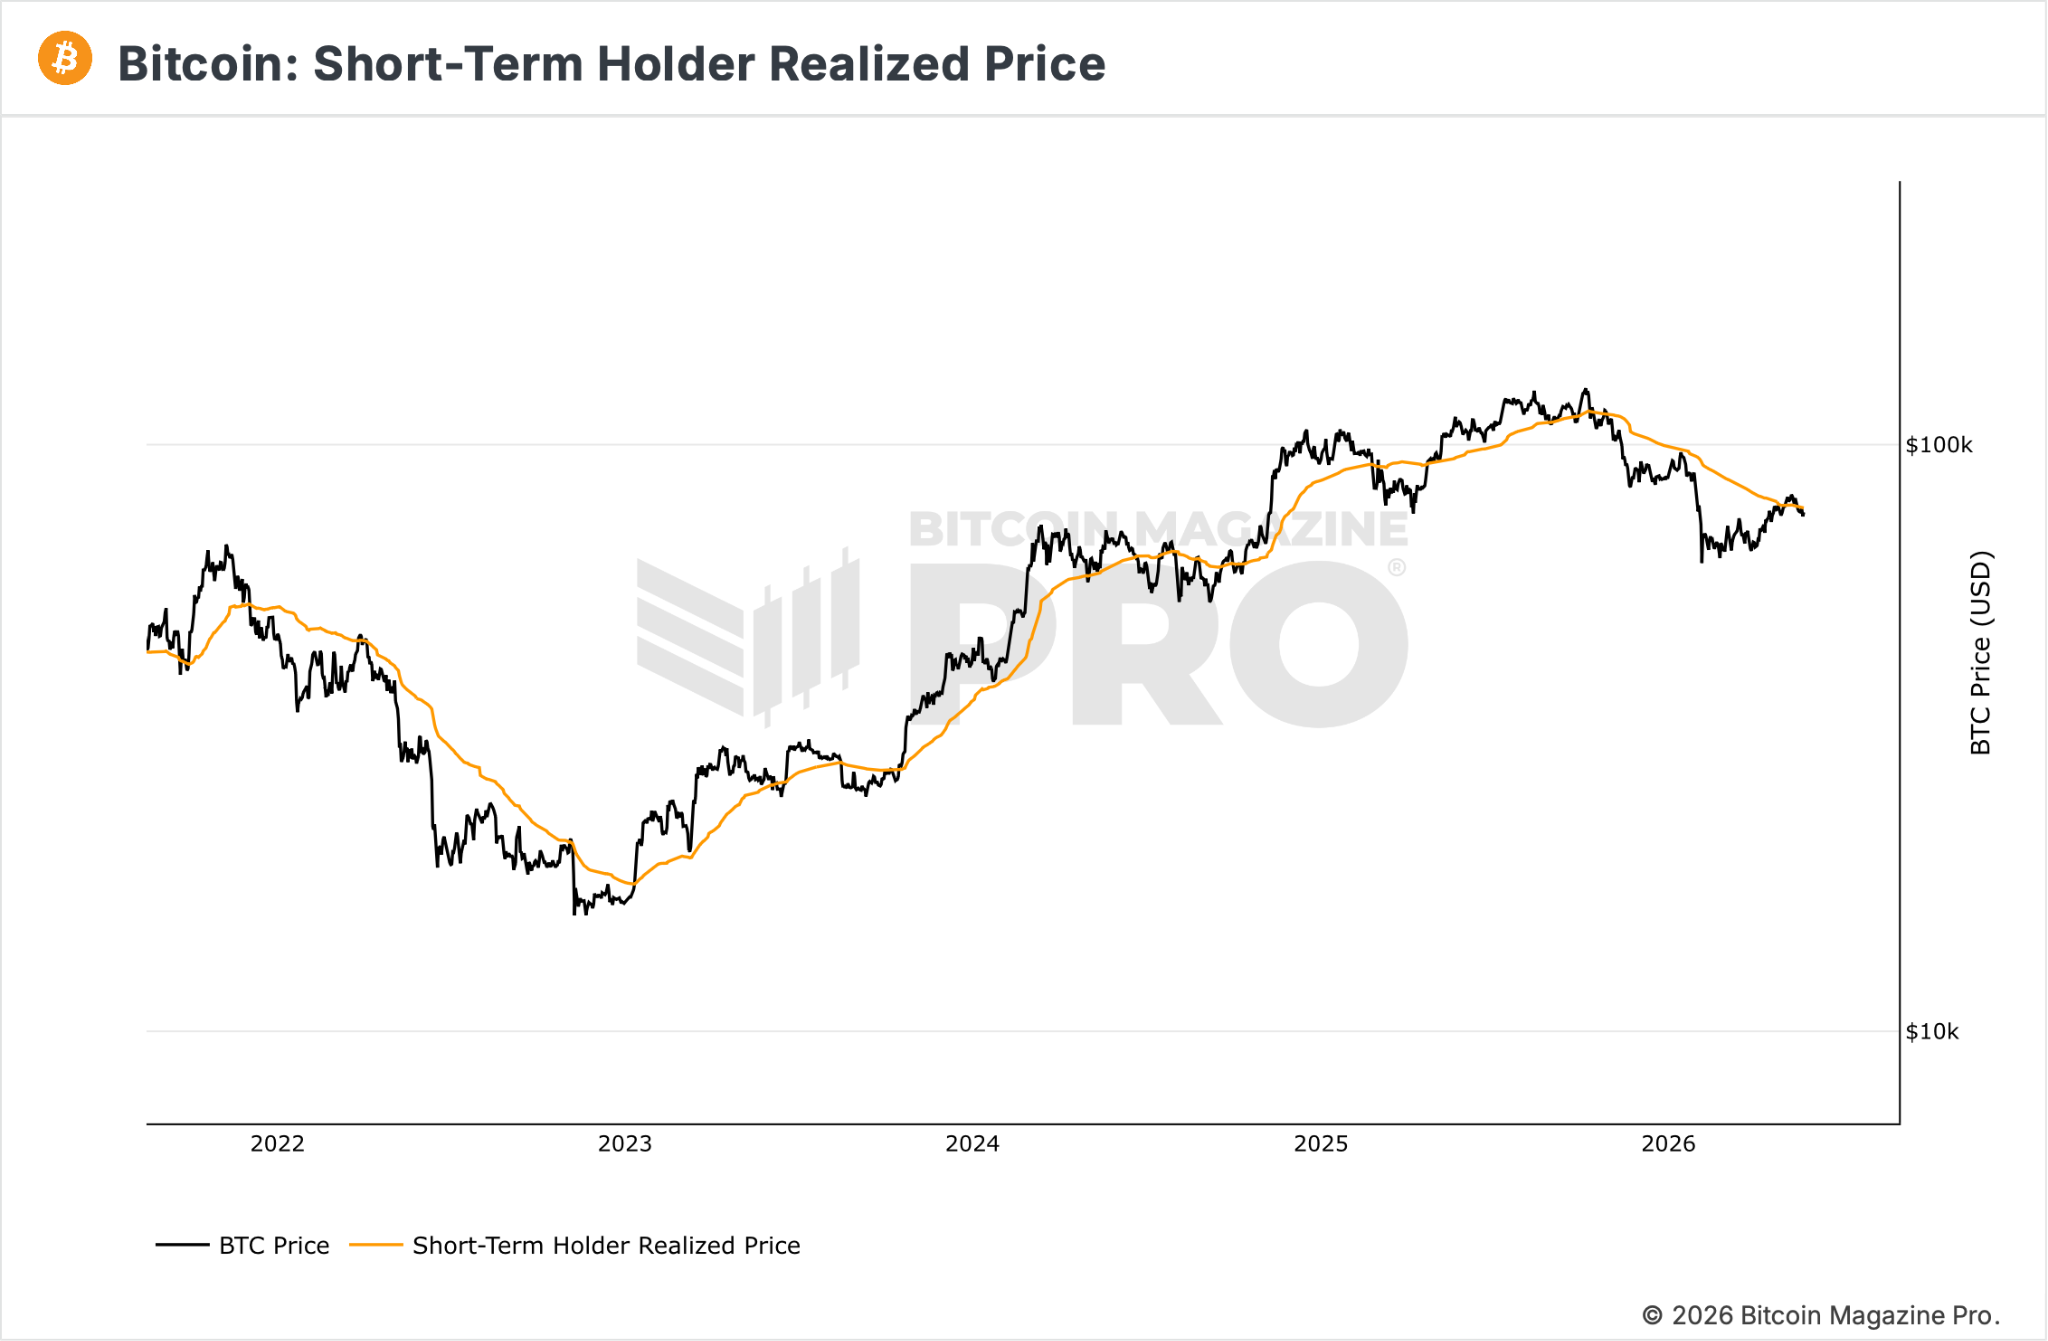
This creates a formidable overhead resistance layer, as rallies towards the $79,000 threshold are likely to meet significant breakeven-driven distribution. Beyond this immediate ceiling, the November to February cohort cost basis at $85,900 remains the ultimate structural barrier, suggesting that while the floor has softened, the macro ceiling remains rigid.
Navigating between these levels is a pronounced UTXO air gap spanning the $72,000 to $82,000 range, which is likely to become our new trading range. This is the range where there has been sparse volume nodes and limited historical liquidity. The lower threshold also has confluence as the former range high for Q1 2026 and the price is currently trading at the middle of our expected range.
The mechanical reality of the market today is that, absent a fresh demand catalyst, the path of least resistance tilts towards price being constrained to this range.
Despite these tactical headwinds, broader supply-side metrics remain constructive. Exchange reserves continue to oscillate near a seven-year low of 2.21 million BTC, while long-term holder supply remains steadfast at 14.43 million BTC. Neither dataset shows the aggressive distribution footprint typical of a sustained bearish regime change. For now, market activity looks characterised by passive profit-taking from transient cohorts rather than aggressive or forced distribution by high-conviction and longer term holders, keeping the long-term structural outlook intact.

General Macro Update
Sticky Inflation And Housing Constraints Complicate Federal Reserve Outlook
Persistent inflation pressures across housing, energy and services sectors are reducing the likelihood of near-term interest rate cuts in the US. Rising mortgage rates, elevated energy prices and broad-based increases in sticky inflation categories suggest that the Federal Reserve may need to maintain restrictive monetary policy for longer than markets initially expected.
Sticky vs Flexible Inflation Diverge
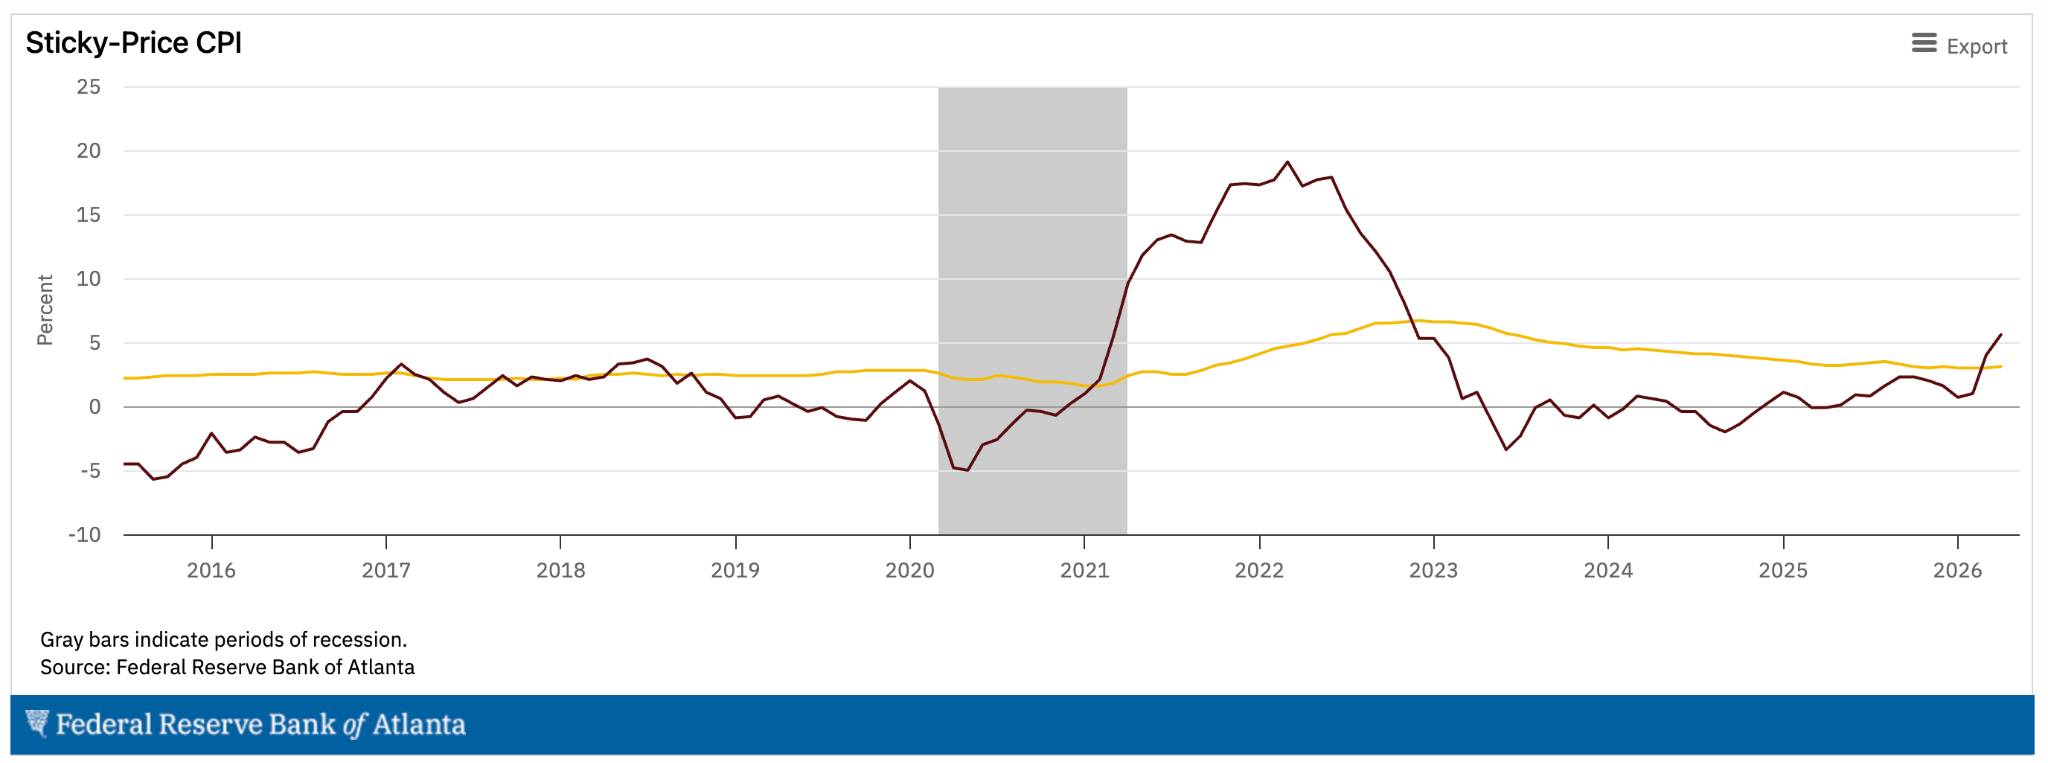
Recent inflation data and market pricing also indicate that investors are beginning to adjust expectations for higher long-term inflation and reduced real returns. The Federal Reserve Bank of Atlanta reported that sticky-price consumer inflation rose at a 4.6 percent annualised pace in April, while flexible-price inflation accelerated sharply to 19.3 percent on a three-month annualised basis. Service-sector inflation increased by 3.4 percent year-on-year, reflecting persistent pricing pressure across housing, transport, healthcare and subscription-based services.
Housing Supply Reinforces The Inflation Floor
The US housing market remains one of the clearest contributors to persistent inflation. Earlier expectations that lower interest rates would support a recovery in residential construction have weakened as the 30-year fixed mortgage rate moved above 6.5 percent alongside rising Treasury yields. Housing completions declined to an annualised pace of 1.37 million in March, down from 1.6 million a year earlier and below the April 2022 peak of 1.82 million.
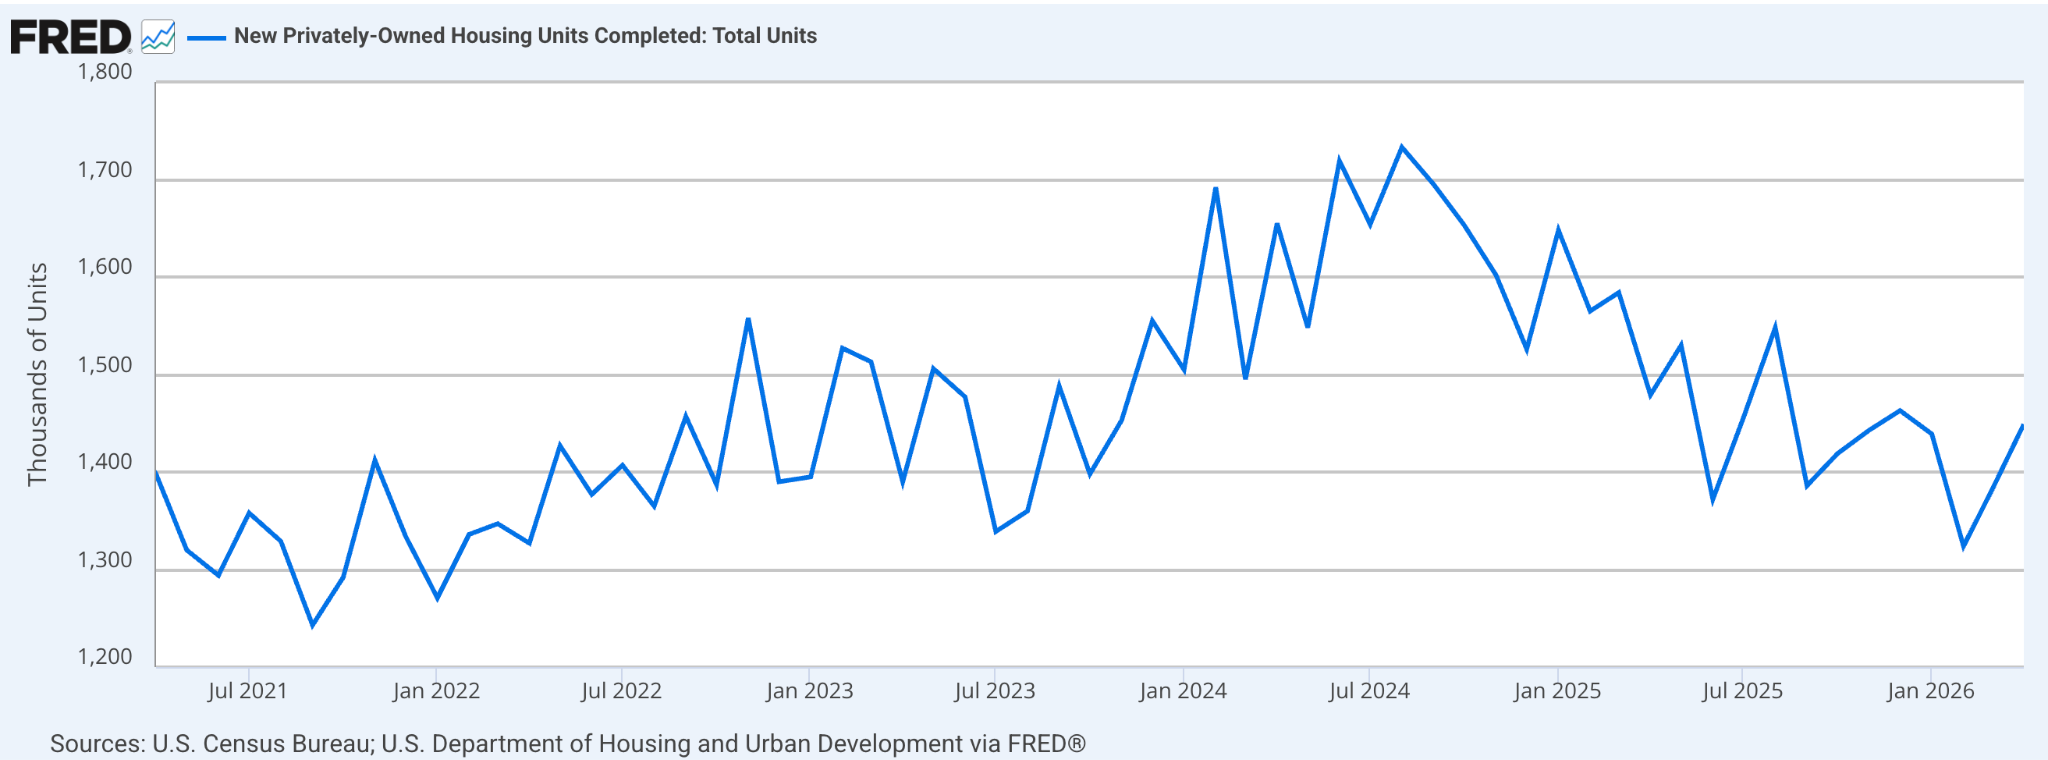
The slowdown in new housing supply continues despite estimates that the US market remains roughly four million homes short of demand once demographic changes are accounted for. Rising material and transportation costs are also weighing on builder confidence and limiting appetite for new projects. That combination is constraining housing supply and supporting higher rents and home prices.
Housing carries significant weight in inflation calculations because shelter costs account for roughly 35 percent of the Consumer Price Index (CPI). As shortages persist, elevated rents and mortgage costs keep feeding into broader inflation measures. Higher borrowing costs for developers also discourage construction, reinforcing the supply squeeze.
Energy And Bond Markets Add Reinforcing Pressure
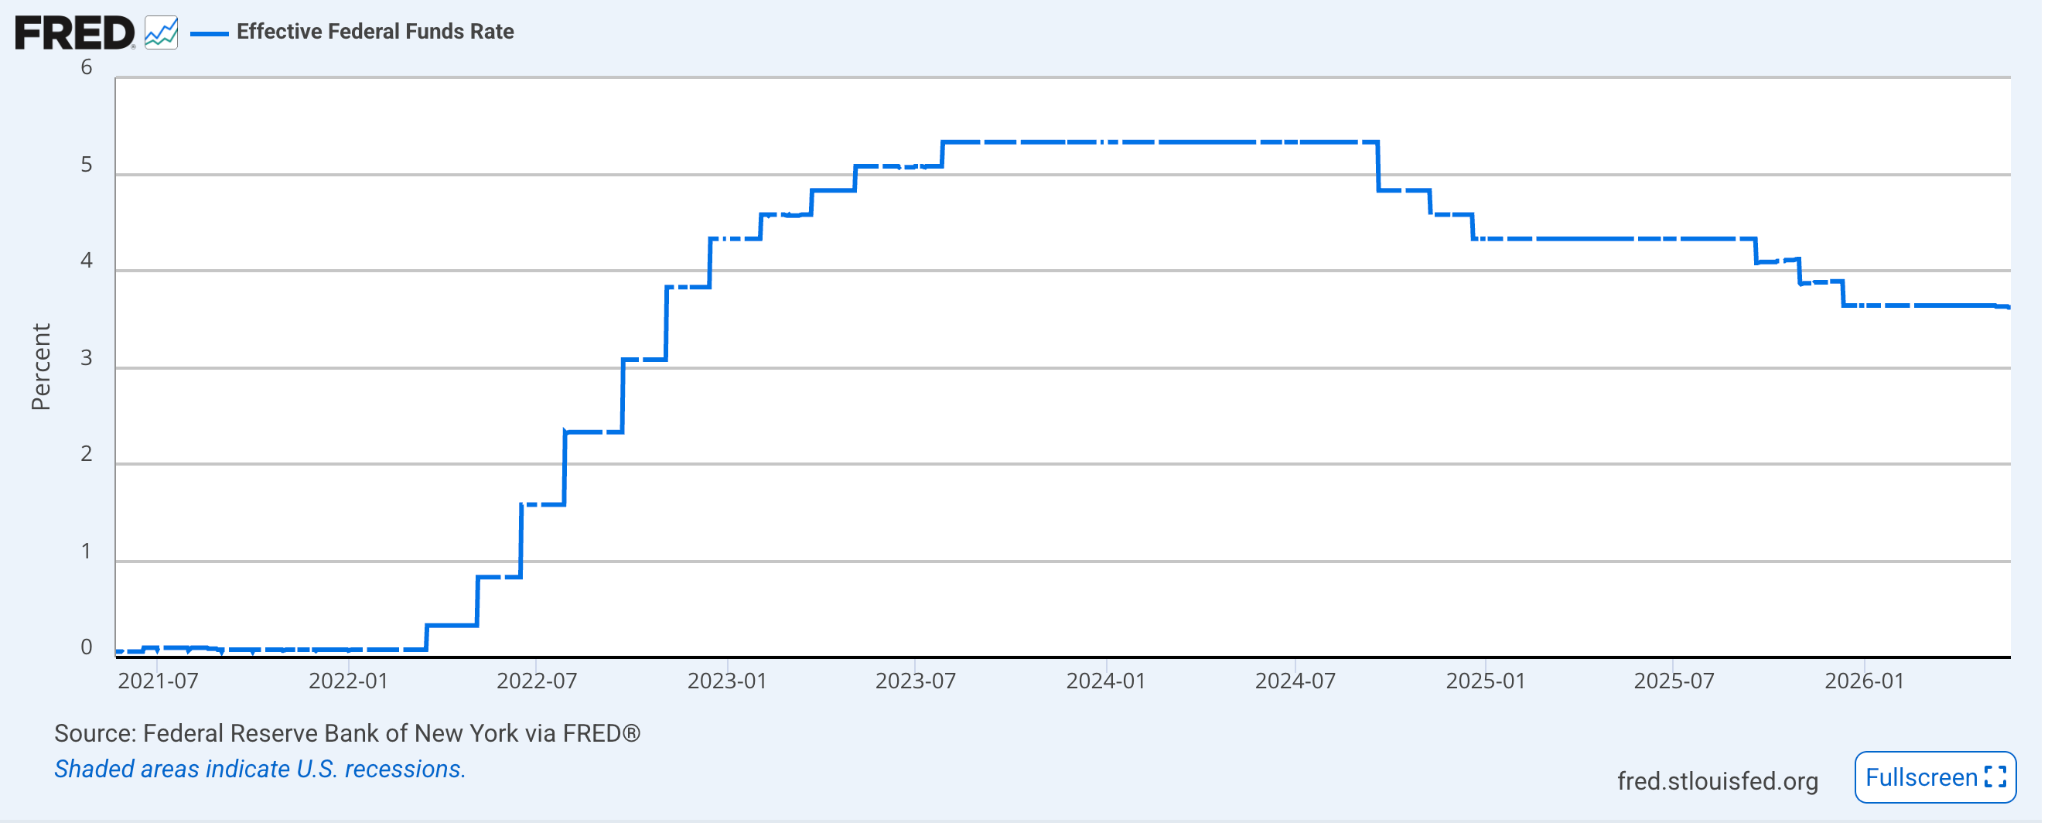
Energy and bond markets add reinforcing pressure. Brent crude continues to trade above $100 per barrel following the Iran-driven supply shock earlier this year, while 2-year Treasury yields are holding above 4.1 percent against an effective federal funds rate near 3.65 percent.
Market pricing is no longer consistent with the rate-cut path consensus assumed at the start of 2026, and these conditions add to the inflation risk already embedded in housing and services.
The Policy Constraint
This shift presents a challenge for policymakers. Although markets had previously expected lower rates, persistent inflation in services and energy-sensitive sectors is complicating the Fed’s ability to ease. Inflation becomes particularly difficult to manage when price increases spread into sticky categories such as housing, healthcare and wages, because those prices tend to adjust slowly downward even if demand weakens.
Sticky inflation can also shift inflation expectations. When households and businesses expect prices to stay elevated, workers demand higher wages while firms keep raising prices to protect margins. This creates a self-reinforcing cycle that can prolong inflationary conditions and weaken confidence in the central bank’s ability to restore price stability.
Bond investors are especially sensitive to this environment because inflation erodes real returns, meaning returns after adjusting for rising prices. As inflation expectations rise, investors tend to demand higher yields to compensate for that loss in purchasing power. The dynamic can push borrowing costs up across credit markets, equities and foreign exchange valuations.
The persistence of both flexible and sticky inflation measures above the Fed’s 2 percent target suggests that inflationary pressures remain embedded within the US economy. Policymakers must now judge whether current shocks are temporary supply disruptions or signals of a more prolonged inflation regime that may require further tightening.

Consumer Sentiment Collapses To A Record Low As Households Brace For Higher-For-Longer Inflation
US consumer sentiment fell to its weakest reading on record in May, even as the labour market continued to show resilience. The contrast points to a household sector under acute price-pressure stress despite stable employment, complicating the Fed’s inflation calculus heading into the June Federal Open Market Committee (FOMC) meeting.
Sentiment Hits A Historic Low
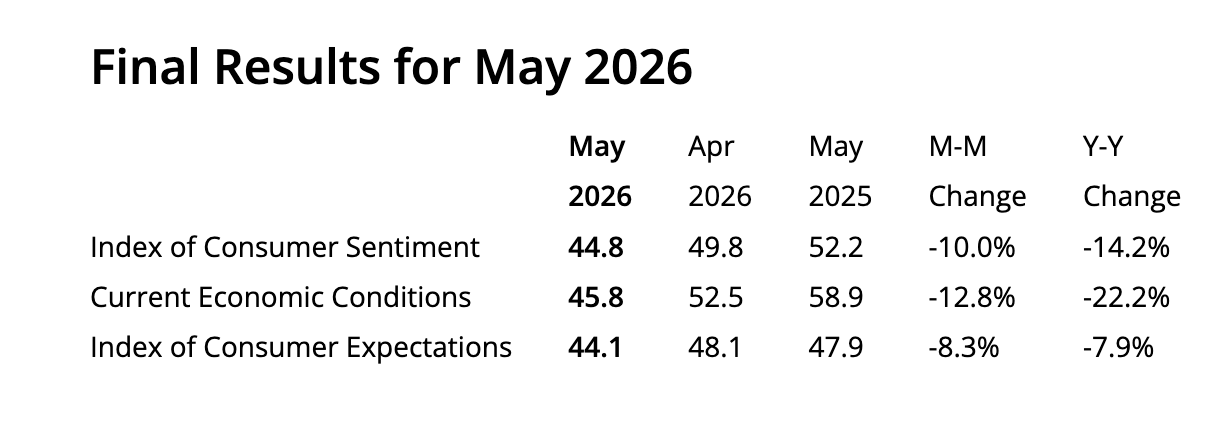
The University of Michigan’s final May Consumer Sentiment Index printed at 44.8, revised down from a preliminary reading of 48.2 and marking the third consecutive monthly decline. It is the lowest reading in the survey’s history. Lower-income households posted the steepest declines, reflecting the disproportionate impact of higher gasoline and essentials costs on those least able to absorb them. In the survey, 57 percent of respondents cited high prices as the main factor eroding their personal finances, while roughly one-third volunteered gasoline prices as a specific concern.

Inflation Expectations Re-Anchor Higher
More important for monetary policy was the move in inflation expectations. One-year-ahead inflation expectations edged up to 4.8 percent from 4.7 percent the previous month, while five-year expectations climbed to 3.9 percent from 3.5 percent. The five-year reading is the most consequential data point because long-horizon expectations are the variable the Fed has consistently said it would defend at any cost. A move of that size in a single month indicates households are no longer assuming inflation returns to the 2 percent target on its own.
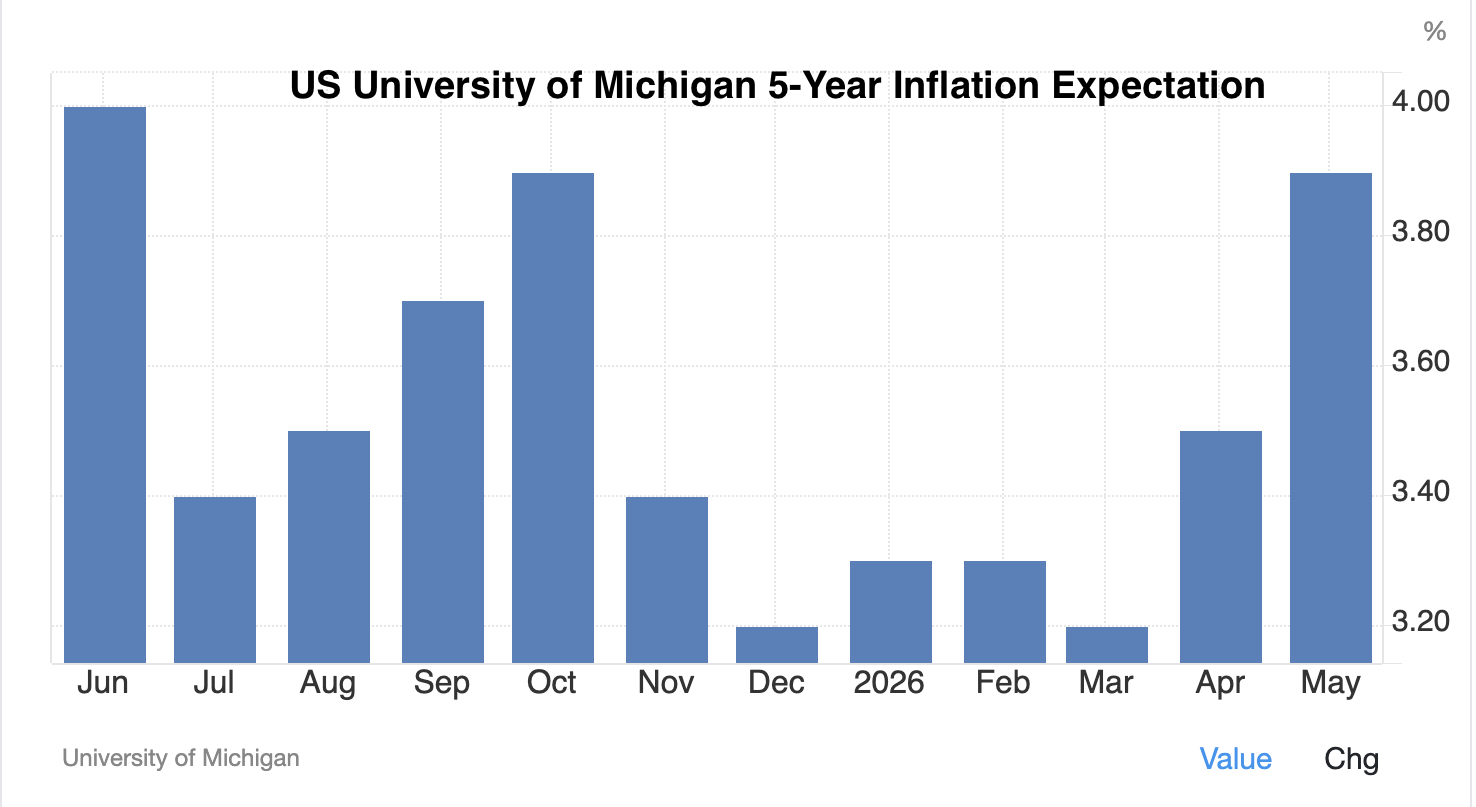
The expectations channel matters because it shapes wage demands, firms’ pricing decisions and household savings behaviour. Once expectations re-anchor to a higher equilibrium, the cost of returning actual inflation to target rises materially. Chair Jerome Powell defended this anchoring through two prior policy cycles, but the May reading suggests that defence is now being tested under the incoming Kevin Warsh chairmanship.
Labour Market Has Not Cooled
The labour market, meanwhile, has not yet delivered the disinflationary cooling that would offset these dynamics. Initial jobless claims fell to 209,000 for the week ending 16 May, within the 190,000 to 220,000 range that has prevailed throughout most of 2026. Continuing claims were broadly stable at 1.782 million for the week ending 9 May. By historical standards, any sustained reading below 250,000 in initial claims is consistent with a tight labour market.
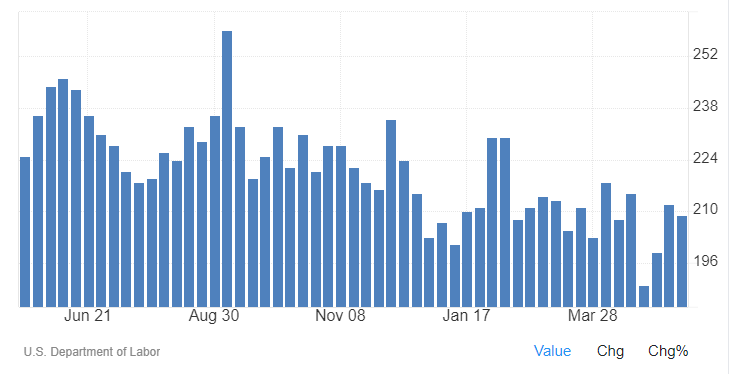
Hiring has slowed, but layoffs have not increased. April nonfarm payrolls added 115,000 jobs and the unemployment rate held at 4.3 percent, the first back-to-back monthly payroll gain in nearly a year. The current environment can be described as a “low-hire, low-fire” equilibrium, where firms are reluctant both to add staff and to release existing workers given continued uncertainty over consumer demand and input costs.
The combination is unusual: a labour market stable enough to support continued consumption, set against a household sector reporting acute distress over the cost of living. The proximate driver is real wage compression. With headline CPI at 3.8 percent year-on-year and nominal wage growth running near 3.5 percent, real average hourly earnings have turned negative. That gap is consistent with the spontaneous price-mention data in the University of Michigan survey and explains why sentiment can collapse while employment stays broadly stable.
For the Fed, the implication is constraining. A sentiment-led pullback in consumer spending would normally be a disinflationary force the central bank could welcome. But because the sentiment shock has coincided with a meaningful upward revision in inflation expectations, the Fed cannot lean on demand softness without first re-anchoring those expectations. Until five-year inflation expectations move back towards 3 percent or lower, an easing bias remains difficult to justify.
The next data prints are critical. The April Personal Consumption Expenditures (PCE) release on 28 May will provide the Fed’s preferred measure of services inflation, and May employment data follows on 5 June. If PCE confirms the CPI reacceleration and payrolls stay near current levels, the June FOMC meeting becomes a live event for either removing the easing bias entirely or signalling readiness to resume tightening in the second half of the year. For households, the most concrete risk is that real wages stay negative through the third quarter, eroding the consumption base that has so far kept the labour market in its low-hire, low-fire equilibrium.

News From the Cryptosphere
Truth Social Abandons Bitcoin ETF Push as Competition and Fee Compression Intensify

Trump Media & Technology Group’s Truth Social has formally withdrawn its applications for multiple crypto exchange-traded funds, including the proposed Truth Social Bitcoin Exchange Traded Fund (ETF), Truth Social Bitcoin & Ethereum ETF, and Crypto Blue Chip ETF, according to filings submitted to the US Securities and Exchange Commission. The filings, originally introduced in 2025 through sponsor and adviser Yorkville America, were voluntarily withdrawn before receiving regulatory approval, with the company stating it no longer intends to pursue the offerings “at this time”.
Yorkville framed the decision as a strategic shift away from Securities Act of 1933 structures towards products governed under the Investment Company Act of 1940, arguing that the latter framework offers greater flexibility for differentiated investment strategies, stronger investor protections, and broader distribution capabilities. ETF analysts and market observers widely read the withdrawal as a reflection of deteriorating economics within the increasingly saturated spot Bitcoin ETF market, rather than a genuine regulatory restructuring.
The withdrawal comes amid intensifying fee competition among major asset managers. Morgan Stanley’s recently launched MSBT fund entered the market with an ultra-low 0.14 percent fee, adding pressure on smaller entrants trying to compete against dominant incumbents such as BlackRock and Fidelity Investments. Spot Bitcoin ETFs have effectively become commoditised products where scale, liquidity, distribution and pricing power matter more than branding.
The move also reflects broader cooling across the US crypto ETF sector in 2026. After substantial inflows following the initial approval of spot Bitcoin ETFs in early 2024, new inflows have slowed significantly this year, while several funds have recorded sustained outflows amid softer institutional demand and declining market momentum. Truth Social’s existing ETF lineup reportedly attracted only modest assets under management, further weakening the case for launching another late-stage spot Bitcoin product into an already crowded market.

US Commerce Department Commits $2 Billion in CHIPS Act Incentives to Nine Quantum Companies

The US Department of Commerce announced on 21 May 2026 that it had signed letters of intent with nine companies for $2.013 billion in CHIPS and Science Act incentives to accelerate domestic capacity in quantum computing, with the funding administered through the National Institute of Standards and Technology. The portfolio splits between two domestic quantum-foundry awards and seven quantum-computing system developers. IBM is the anchor recipient with $1 billion to establish a new wafer-foundry subsidiary, followed by GlobalFoundries at $375 million, while Atom Computing, D-Wave, Infleqtion, PsiQuantum and Quantinuum each receive $100 million and Diraq receives up to $38 million. As a condition of each award, NIST will take a minority, non-controlling equity stake in every recipient.
The mechanics distinguish this initiative from previous federal quantum funding. The Commerce Department is using CHIPS Act authority, originally legislated to backstop semiconductor capacity, to seed a sovereign hardware base for fault-tolerant quantum systems, with the foundry awards explicitly targeting domestic production across superconducting, trapped-ion, photonic, topological, and silicon-spin architectures. The equity-stake structure is an unusual element. Federal industrial policy has historically operated through grants and contracts rather than minority share positions, and the move imports a sovereign-wealth posture into US technology policy. Funds are disbursed in tranches against capability milestones rather than as upfront grants, and the agreements remain non-binding letters of intent pending finalisation.
The announcement has direct implications for the cryptographic foundations of public-blockchain systems. Bitcoin and Ethereum both rely on elliptic-curve digital signature schemes (ECDSA in Bitcoin’s case, with Ed25519 used elsewhere) whose security collapses against a sufficiently large fault-tolerant quantum computer running Shor’s algorithm. The same Commerce Department, through NIST, has run a parallel post-quantum cryptography standardisation programme since 2016 and finalised its first three post-quantum encryption standards in August 2024. The $2 billion in hardware funding accelerates the offensive side of the same equation: the closer the US gets to scalable fault-tolerance, the more urgent the migration timeline becomes for any chain whose signature scheme is not yet quantum-resistant.
The announcement ultimately belongs to a broader trajectory of maturation in which crypto-asset security is being repositioned as a national-infrastructure concern rather than a niche cryptographic curiosity.
By underwriting both the breaking and the rebuilding sides of the equation, the federal government is institutionalising quantum risk as a fixed feature of the long-run macro outlook for digital assets, and reinforcing the regulatory normalisation in which crypto protocols are increasingly evaluated against the same standards-driven security framework that applies to traditional financial infrastructure.